- Capabilities
- Getting started
- Architecture center
- Platform updates
Chart XY
Consider using the Vega Chart widget if the Chart XY widget does not enable desired functionality or formatting.
The Chart XY widget is used to visualize Objects as interactive charts. Module builders configuring a Chart XY widget can:
- Display data as bar, line, and scatter charts.
- Choose which properties are visualized, how these properties are aggregated (e.g. count, sum, average), and whether/how the properties are segmented.
- Use Function-backed layers to display more advanced aggregation types and charts.
- Set display options for chart titles, axes, legends, and numerical formatting.
- Enable selection and downstream filtering on a chart.
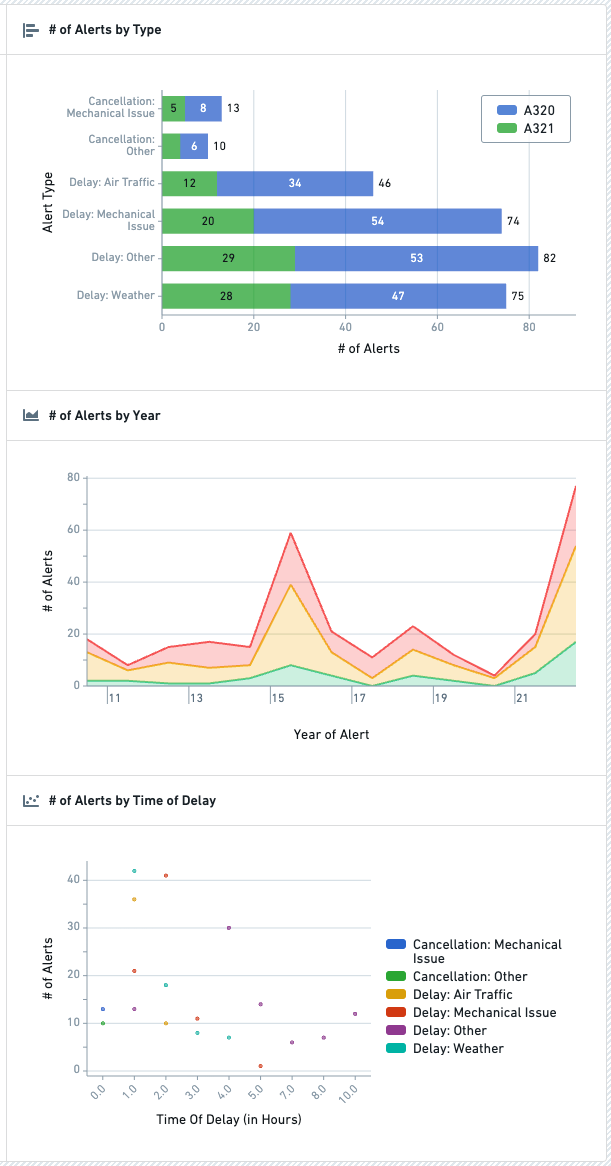
The below screenshot shows an example of three configured Chart XY widgets displaying Flight Alerts data:
Configuration options
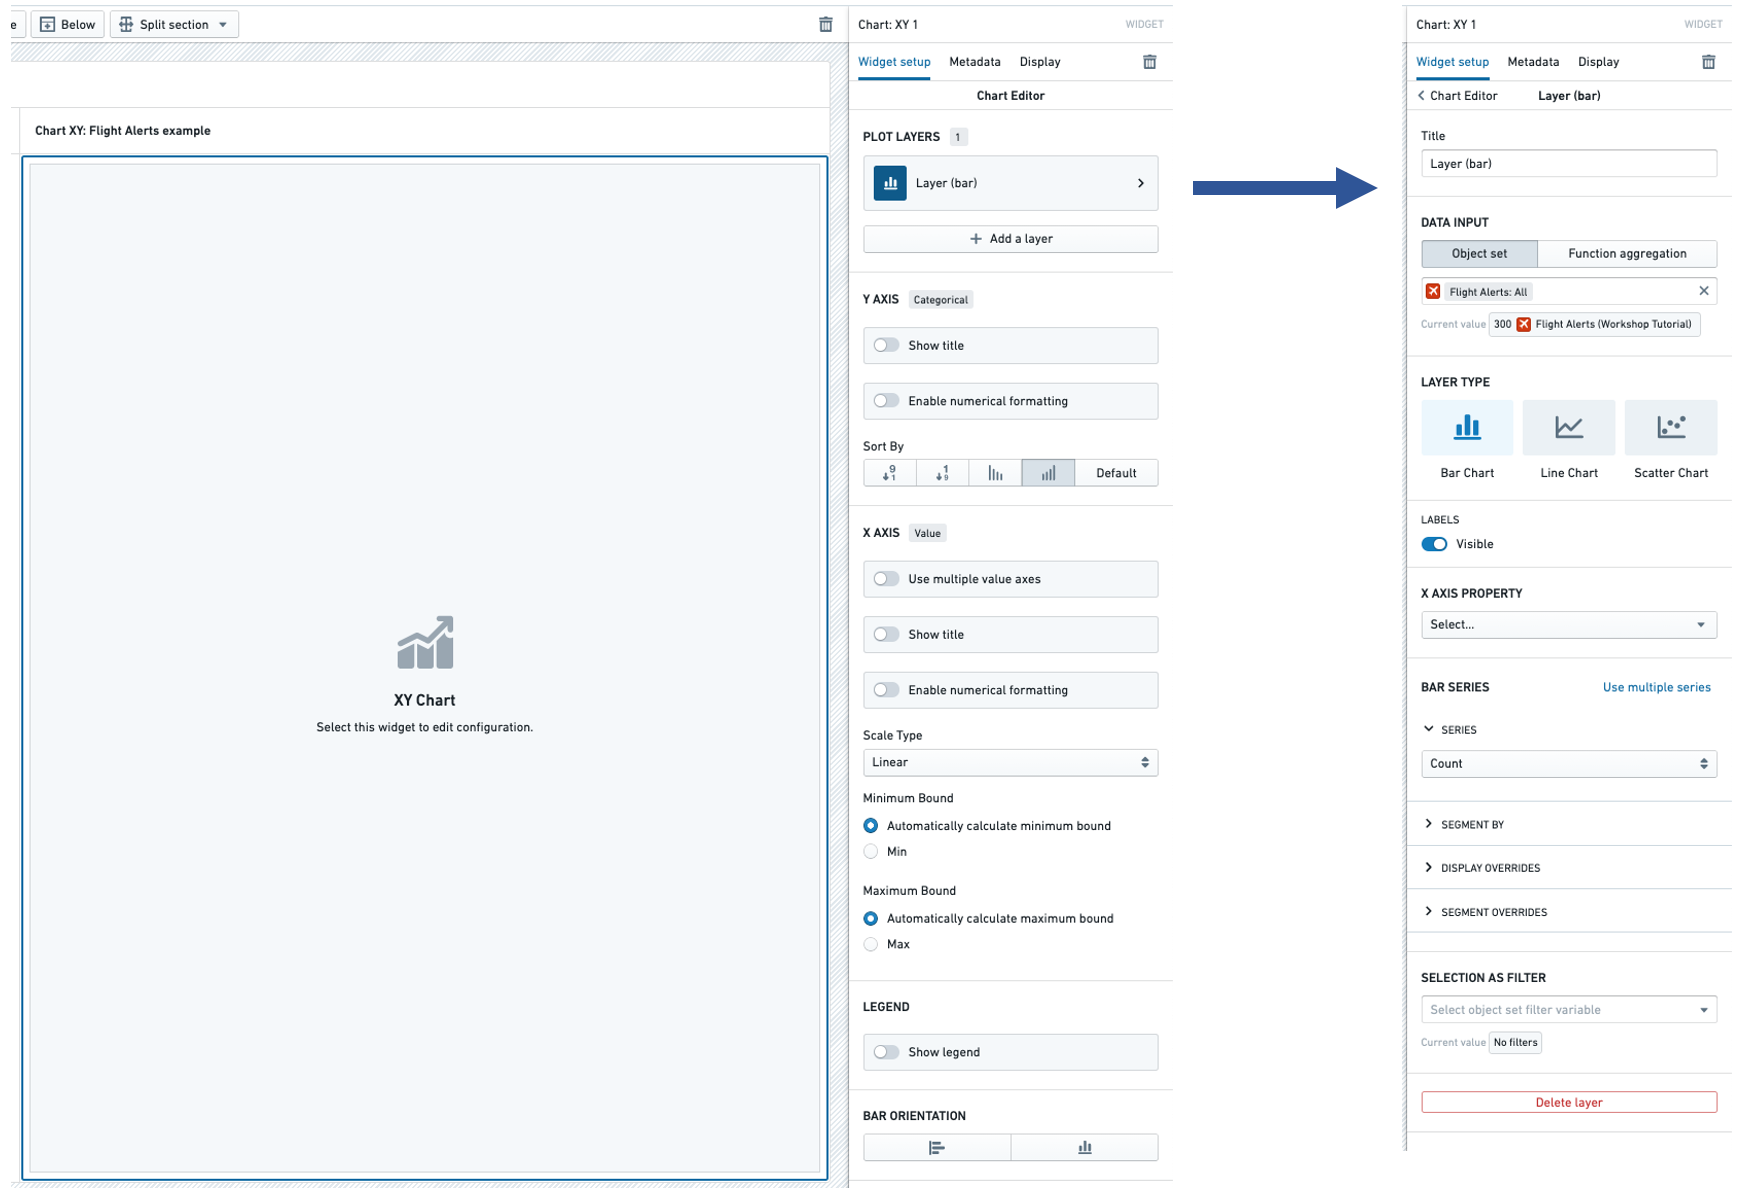
In the image below, to the left of the blue arrow you can see a newly added (but not yet configured) Chart XY widget, alongside its initial configuration panel. To the right of the blue arrow in the image below, you can see an individual Layer configuration panel with the backing object set of Flight Alerts already populated:
Layer configuration options
Configuring a Layer is required to add data to the Chart XY widget. The following configuration options are available for a Layer:
- Title
- Sets a title for the current Layer within your configuration panel.
- Note: This title is not visible to module users, but is intended to help builders organize and manage complex Chart XY configurations that use multiple Layers.
- Data input
- Controls the input data for this Layer.
- The Object set option allows a Workshop object set variable to be used as input.
- The Function aggregation option allows a function that returns a 2D Aggregation or 3D Aggregation to be used as input.
- Note: Function aggregation layers will only have a subset of the below Layer configuration options available.
- The Time series set option allows a Workshop time series set variable to be used as input. See Variables for more information on time series set variables. This configures a time series chart, with the time range on the X axis, and the time series values of the variable on the Y axis.
- Layer type
- Selects the type of chart displayed. Current options include Bar Chart, Line Chart, and Scatter Chart. If the data input is a time series set, only the Line Chart option is supported. See Variables for more information on time series set variables.
- Area options
- Provides three visualization options for line charts:
- "Line" (which displays a simple line chart),
- "Area" (which plots a line chart and shades the area beneath each line), and
- "Stacked" (which is similar to the "Area" option but stacks segmented chart values on top of each other).
- Area options are only available for line charts.
- Provides three visualization options for line charts:
- Labels
- Toggles the display of value labels on the chart.
- This option is currently available for Bar Charts and Line Charts.
- X axis property
- Determines the property type plotted on the chart.
- Bar / line / chart series
- Use single / multiple series
- Allows either one or more chart series to be plotted for the selected X axis property.
- For instance, if "Alert Type" was selected as the X axis property, multiple series would allow the plotting of both the count of each "Alert Type" and also the sum of the "# of Hours Delayed" for each "Alert Type".
- Series aggregation
- Determines the aggregation method used to produce each value plotted on the chart.
- By default, this is set to "Count."
- Other options include: "Average," "Min," "Max," "Sum," and "Approximate Unique Count."
- Segment by
- Optional.
- Enables each plotted value to be segmented by a secondary property type.
- As an example, if "Alert Type" was selected as the X axis property and then "Aircraft Type" was selected as the Segment by option on a bar chart, each bar would show the count of objects of each "Alert Type" segmented by each "Aircraft Type".
- Display of null/missing values
- Only available for Line chart.
- Controls how null or missing values are displayed on a Line chart.
- Options are "Gap" (where a missing value is displayed as an empty gap in a plotted line), "Ignored" (where a missing value is ignored and a plotted line instead connects the previous and next available values), or "Zeroes" (where a missing value is treated as equivalent to value of "0).
- Display override
- Optional.
- Overrides the legend display name of the current series.
- For segmented charts, overrides the legend display name of a single segment.
- Segment overrides
- Only available for Bar chart.
- Modifies how each bar chart value is displayed.
- Options include: "Stacked," "Percentage," and "Grouped."
- Use single / multiple series
- Selection as filter
- Optional and only available for Object set-backed charts.
- When set, allows for selection and downstream widget filtering for this chart layer via the output Object set filter variable.
- Delete layer
- Allows the current chart layer to be deleted.
- Scenarios
- Compare against Scenarios
- Enable this toggle to select the Scenario array variable to compare data from. This will compare the data in the table to values from the Scenarios in the array using the "segment by" axis of the chart.
- If this option is enabled, you cannot segment by other properties.
- Scenarios compared within a single layer are assigned colors automatically, and the layer's Color setting applies to every scenario in the layer. To control the color of each scenario, configure a separate layer per scenario and enable Load data from scenario on each layer, as described in Set a different color for each scenario.
- See the Scenarios documentation for more information on Scenarios.
- Compare against Scenarios
Runtime configuration options
Some Chart XY configuration options are available at runtime through the chart toolbar, rather than in the widget configuration panel.
Timestamp bucket size
When a chart layer uses a date or timestamp property as the X axis property with basic rather than function-backed aggregation, a cog (settings) button appears in the chart toolbar at runtime. The button appears only under these conditions. Selecting this icon opens a bucket size selector that allows you to configure how timestamp values are grouped—for example, by day, week, or month.
Chart-wide configuration options
In addition to the configuration options for a layer described above, the main Chart XY configuration panel contains a number of chart-wide configuration options:
- Categorical axis
-
Show title
- If enabled, displays the title of the categorical axis and also allows this title to be overridden.
- By default, this title will display the property type(s) plotted within the chart's series.
-
Enable numerical formatting
- If enabled, provides configuration options for numerical values displayed in the categorical axis keys.
- Configuration options include numerical grouping, min / max decimals shown, scientific notation, and others.
-
Sort by
- Controls sorting logic for how each charted value is displayed.
- By default, sorts categorical keys alphabetically from A to Z.
- Other options include sorting by value (ascending or descending) and Custom sorting.
- To define a custom category order, assign numeric sort values to a property and select that property as the sort metric.
-
- Value axis
- Use multiple value axes
- Only available if multiple chart series have been configured and allows value axes to be configured on a per series basis. This can be helpful when different series on a chart have substantially different value scales.
- Show title
- If enabled, displays the title of the value axis and also allows this title to be overridden.
- By default, this title will display the aggregation type(s) used within the chart's series.
- Enable numerical formatting
- If enabled, provides configuration options for numerical values displayed in the values axis.
- Configuration options include numerical grouping, min / max decimals shown, scientific notation, and others.
- Scale type
- Allows the value axis scale to be set to either "Linear" (the default) or "Logarithmic."
- Minimum bound
- By default, set to "Automatically calculate minimum bound" based on the displayed chart values.
- If switched to "Min," the module builder can control the minimum value display on the value axis.
- Maximum bound
- By default, set to "Automatically calculate maximum bound" based on the displayed chart values.
- If switched to "Max," the module builder can control the maximum value display on the value axis.
- Use multiple value axes
- Legend
- Show legend
- Toggles display of a legend of chart series' titles and series' colors.
- Positioning options
- When "Show legend" is enabled, controls the positioning of the legend within the chart.
- Show legend
- Bar orientation
- Horizontal / vertical toggle
- Controls the orientation of the chart.
- For a Bar chart, "Horizontal" is the default.
- For a Line chart or Scatter chart, only "Vertical" is allowed.
- Horizontal / vertical toggle
Function aggregations (Function-backed layers)
Configuring a function-backed layer requires writing a function that returns either a TwoDimensionalAggregation or ThreeDimensionalAggregation.
The code examples in this section are available in TypeScript v1, TypeScript v2, and Python. Select the tab that matches your function version. The two worked examples that follow are shown in TypeScript only; Python authors should follow Create a custom aggregation with Python functions. TypeScript v1 defines each function as a method on an exported class, annotated with the @Function() decorator from @foundry/functions-api. TypeScript v2 defines each function as the default export of a file and imports types from @osdk/functions. For a full comparison, review the TypeScript v1 versus TypeScript v2 comparison.
Aggregation return value shape
Both aggregation types exist in every function version with the following type parameters: TwoDimensionalAggregation<Key, Value> and ThreeDimensionalAggregation<Key, Segment, Value>. However, TypeScript v1 wraps the buckets in an object under a buckets key while TypeScript v2 returns the bare array of buckets. For a three-dimensional aggregation, TypeScript v2 also holds each inner bucket array under a groups key rather than a value key. Python keeps the wrapper and builds it from the SingleBucket and NestedBucket classes in functions.api. These differences apply only to the literal you construct in the function body: every version serializes a given declared return type to the same output, so the widget needs no change after a migration. A leftover TypeScript v1 { buckets: ... } literal fails inside the function, because it does not satisfy TypeScript v2's array-typed ThreeDimensionalAggregation.
The following minimal function returns the same two-dimensional aggregation in each version:
Copied!1 2 3 4 5 6 7 8 9 10 11 12 13import { Double, Function, TwoDimensionalAggregation } from "@foundry/functions-api"; export class MyFunctions { @Function() public myTwoDimensionalAggregation(): TwoDimensionalAggregation<string, Double> { return { buckets: [ { key: "bucket1", value: 5.0 }, { key: "bucket2", value: 6.0 }, ], }; } }
Copied!1 2 3 4 5 6 7 8 9 10import { Double, TwoDimensionalAggregation } from "@osdk/functions"; function myTwoDimensionalAggregationFunction(): TwoDimensionalAggregation<string, Double> { return [ { key: "bucket1", value: 5.0 }, { key: "bucket2", value: 6.0 }, ]; } export default myTwoDimensionalAggregationFunction;
Copied!1 2 3 4 5 6 7 8 9 10 11 12 13 14 15from functions.api import ( function, Double, TwoDimensionalAggregation, SingleBucket ) @function def my_two_dimensional_aggregation_function() -> TwoDimensionalAggregation[str, Double]: return TwoDimensionalAggregation( buckets=[ SingleBucket(key="bucket1", value=Double(5.0)), SingleBucket(key="bucket2", value=Double(6.0)), ] )
A three-dimensional aggregation nests a second list of buckets inside each top-level bucket. TypeScript v1 wraps the top-level buckets under a buckets key and holds the nested list under value. TypeScript v2 changes both levels: it returns a bare array, and each top-level entry holds the nested list under groups, leaving only the innermost level keyed value. In Python, each top-level bucket is a NestedBucket whose buckets argument holds the inner SingleBucket list. See the aggregation types reference for the full shape of each type.
Two-dimensional aggregation example
In TypeScript v1, the result of a grouped aggregation is itself a TwoDimensionalAggregation, so .groupBy(...).sum(...) can be returned directly. This is not true in TypeScript v2: .aggregate() returns a flat array of rows, one row per group, and no helper converts those rows into a TwoDimensionalAggregation. Annotating an .aggregate() call with the aggregation type is a type error, so the function must build the return value from the rows itself. Read each group value from row.$group.<groupByKey> and the metric from row.<propertyApiName>.sum, which inherits the property's nullability and can therefore be undefined.
Three further differences shape the TypeScript v2 example below:
- TypeScript v1 bucket keys use
IRange<Timestamp>, which carriesminandmax; the TypeScript v2 equivalent isRange<TimestampISOString>, which carriesstartValueandendValue. Do not confuse theRangefunction type with the$rangesgroup-by input, which is an array of[start, end]tuples. - A
$durationgroup value is a single scalar marking the start of its bucket rather than a range, so the example derives the end of each one-day bucket itself. The?? 0default on each metric is necessary, because a metric is absent when the property it aggregates has no value. - The
"unordered"value in each$selectentry means the result carries no defined row order, and two separate.aggregate()calls are not guaranteed to return their groups in the same order. The example therefore joins the numerator and denominator results on their group values rather than by position.
The TypeScript v2 function has no class, so TypeScript v1's private divide method becomes a module-level function in the same file for TypeScript v2.
Below is a full example that returns a TwoDimensionalAggregation to chart one time series divided by another time series:
Copied!1 2 3 4 5 6 7 8 9 10 11 12 13 14 15 16 17 18 19 20 21 22 23 24 25 26 27 28 29 30 31 32 33import { Double, Function, TwoDimensionalAggregation, ThreeDimensionalAggregation, IRange, Timestamp } from "@foundry/functions-api"; import { ObjectSet, MyObjectType } from "@foundry/ontology-api" export class TimeseriesAggregations { @Function() public async percentOfTotal(objects:ObjectSet<MyObjectType>): Promise<TwoDimensionalAggregation<IRange<Timestamp>, Double>> { const numerators = await objects.groupBy(e => e.date.byDays()) .sum(e => e.value); const denominators = await objects.groupBy(e => e.date.byDays()) .sum(e => e.total); return this.divide(numerators, denominators); } private divide(numerators:TwoDimensionalAggregation<IRange<Timestamp>, Double>, denominators: TwoDimensionalAggregation<IRange<Timestamp>, Double>): TwoDimensionalAggregation<IRange<Timestamp>, Double> { const percentage = numerators.buckets.map((bucket, i) => { const numerator = bucket.value; const denominator = denominators.buckets[i].value; if (denominator == 0) { return { key: bucket.key, value: 0 }; } return { key: bucket.key, value: numerator / denominator } }); return { buckets: percentage }; } }
Copied!1 2 3 4 5 6 7 8 9 10 11 12 13 14 15 16 17 18 19 20 21 22 23 24 25 26 27 28 29 30 31 32 33 34 35 36 37 38 39 40 41 42 43 44 45 46 47 48 49 50 51 52 53 54 55 56 57import { ObjectSet } from "@osdk/client"; import { Double, Range, TimestampISOString, TwoDimensionalAggregation } from "@osdk/functions"; import { MyObjectType } from "@ontology/sdk"; const ONE_DAY_IN_MS = 24 * 60 * 60 * 1000; // A $duration group value marks only the start of its bucket, so the end of the // one-day bucket has to be derived before it can be used as a Range key. function toDayRange(start: Date): Range<TimestampISOString> { const end = new Date(start.getTime() + ONE_DAY_IN_MS); return { startValue: start.toISOString(), endValue: end.toISOString() }; } function divide( numerators: TwoDimensionalAggregation<Range<TimestampISOString>, Double>, denominators: Map<string, Double> ): TwoDimensionalAggregation<Range<TimestampISOString>, Double> { return numerators.map(bucket => { const numerator = bucket.value; const denominator = denominators.get(bucket.key.startValue!) ?? 0; if (denominator === 0) { return { key: bucket.key, value: 0 }; } return { key: bucket.key, value: numerator / denominator }; }); } async function percentOfTotal( objects: ObjectSet<MyObjectType> ): Promise<TwoDimensionalAggregation<Range<TimestampISOString>, Double>> { const numeratorRows = await objects.aggregate({ $select: { "value:sum": "unordered" }, $groupBy: { date: { $duration: [1, "days"] } }, }); const denominatorRows = await objects.aggregate({ $select: { "total:sum": "unordered" }, $groupBy: { date: { $duration: [1, "days"] } }, }); const numerators = numeratorRows .filter(row => row.$group.date != null) .map(row => ({ key: toDayRange(new Date(row.$group.date!)), value: row.value.sum ?? 0, })); // Keyed by bucket start rather than by row position, because the two // aggregations are unordered and may return their groups in different orders. const denominators = new Map<string, Double>( denominatorRows .filter(row => row.$group.date != null) .map(row => [new Date(row.$group.date!).toISOString(), row.total.sum ?? 0]), ); return divide(numerators, denominators); } export default percentOfTotal;
Three-dimensional aggregation example
TypeScript v1 produces a second aggregation dimension with .segmentBy(). TypeScript v2 has no separate segment clause; the closest available construct is a second key in the same $groupBy object, which is what the example below uses. A multi-key $groupBy groups on both keys at once rather than nesting a segment inside each date bucket. Once $groupBy holds more than one key, ordering is no longer allowed and every $select value must be "unordered". The result remains a flat array of rows, one row per combination of group values. The TypeScript v2 example nests the rows under their date bucket before returning them and joins the numerator and denominator results on their group values rather than by position.
TypeScript v1 .topValues() converts to the TypeScript v2 "exact" strategy, with a higher default bucket count: 1,000 in TypeScript v1, 10,000 in TypeScript v2. A grouping stays accurate only while the property's distinct values fit inside that count; above it, objects are excluded from the returned groups and the aggregation becomes approximate. The platform reports whether each result was accurate or approximate, but the TypeScript OSDK does not expose that field. For a high-cardinality property, raise the count with { $exactWithLimit: n }.
Below is a full example that returns a ThreeDimensionalAggregation which will chart a separate series for each value returned by segmentBy():
Copied!1 2 3 4 5 6 7 8 9 10 11 12 13 14 15 16 17 18 19 20 21 22 23 24 25 26 27 28 29 30 31 32 33 34import { Double, Function, TwoDimensionalAggregation, ThreeDimensionalAggregation, IRange, Timestamp } from "@foundry/functions-api"; import { ObjectSet, MyObjectType } from "@foundry/ontology-api" export class TimeseriesAggregations { @Function() public async percentOfTotalSegmented(objects:ObjectSet<MyObjectType>): Promise<ThreeDimensionalAggregation<IRange<Timestamp>, string, Double>> { const numerators = await objects.groupBy(e => e.date.byDays()) .segmentBy(e => e.groupId.topValues()) .sum(e => e.value); const denominators = await objects.groupBy(e => e.date.byDays()) .segmentBy(e => e.groupId.topValues()) .sum(e => e.total); return this.divideThreeDimensional(numerators, denominators); } private divideThreeDimensional(numerators:ThreeDimensionalAggregation<IRange<Timestamp>, string, Double>, denominators: ThreeDimensionalAggregation<IRange<Timestamp>, string, Double>): ThreeDimensionalAggregation<IRange<Timestamp>, string, Double> { var percentage = numerators.buckets; //copy for (let i = 0; i < numerators.buckets.length; i++) { for (let j = 0; j < numerators.buckets[i].value.length; j++) { percentage[i].value[j].value = numerators.buckets[i].value[j].value / denominators.buckets[i].value[j].value; } } return { buckets: percentage }; } }
Copied!1 2 3 4 5 6 7 8 9 10 11 12 13 14 15 16 17 18 19 20 21 22 23 24 25 26 27 28 29 30 31 32 33 34 35 36 37 38 39 40 41 42 43 44 45 46 47 48 49 50 51 52 53 54 55 56 57 58 59 60 61 62 63 64 65 66 67 68 69 70 71 72 73 74 75 76 77 78 79 80 81 82 83 84 85 86 87 88import { ObjectSet } from "@osdk/client"; import { Double, Range, ThreeDimensionalAggregation, TimestampISOString } from "@osdk/functions"; import { MyObjectType } from "@ontology/sdk"; const ONE_DAY_IN_MS = 24 * 60 * 60 * 1000; // A $duration group value marks only the start of its bucket, so the end of the // one-day bucket has to be derived before it can be used as a Range key. function toDayRange(start: Date): Range<TimestampISOString> { const end = new Date(start.getTime() + ONE_DAY_IN_MS); return { startValue: start.toISOString(), endValue: end.toISOString() }; } // aggregate() returns one flat row per date and segment pair, so the rows have // to be regrouped before they match the nested three-dimensional shape. function nestSegmentsByDate( rows: Array<{ date: Date; segment: string; value: Double }> ): ThreeDimensionalAggregation<Range<TimestampISOString>, string, Double> { const byDate = new Map<number, Array<{ key: string; value: Double }>>(); for (const row of rows) { const segments = byDate.get(row.date.getTime()) ?? []; segments.push({ key: row.segment, value: row.value }); byDate.set(row.date.getTime(), segments); } return Array.from(byDate, ([start, groups]) => ({ key: toDayRange(new Date(start)), groups, })); } function divideThreeDimensional( numerators: ThreeDimensionalAggregation<Range<TimestampISOString>, string, Double>, denominators: Map<string, Double> ): ThreeDimensionalAggregation<Range<TimestampISOString>, string, Double> { return numerators.map(bucket => ({ key: bucket.key, groups: bucket.groups.map(segment => { const denominator = denominators.get(`${bucket.key.startValue}|${segment.key}`) ?? 0; return { key: segment.key, value: denominator === 0 ? 0 : segment.value / denominator, }; }), })); } async function percentOfTotalSegmented( objects: ObjectSet<MyObjectType> ): Promise<ThreeDimensionalAggregation<Range<TimestampISOString>, string, Double>> { const numeratorRows = await objects.aggregate({ $select: { "value:sum": "unordered" }, $groupBy: { date: { $duration: [1, "days"] }, groupId: "exact", }, }); const denominatorRows = await objects.aggregate({ $select: { "total:sum": "unordered" }, $groupBy: { date: { $duration: [1, "days"] }, groupId: "exact", }, }); const numerators = nestSegmentsByDate( numeratorRows .filter(row => row.$group.date != null) .map(row => ({ date: new Date(row.$group.date!), segment: row.$group.groupId, value: row.value.sum ?? 0, })), ); // Keyed by date and segment rather than by row position, because the two // aggregations are unordered and may return their groups in different orders. const denominators = new Map<string, Double>( denominatorRows .filter(row => row.$group.date != null) .map(row => [ `${new Date(row.$group.date!).toISOString()}|${row.$group.groupId}`, row.total.sum ?? 0, ]), ); return divideThreeDimensional(numerators, denominators); } export default percentOfTotalSegmented;
Python authors write the same charts with the TwoDimensionalAggregation and ThreeDimensionalAggregation classes from functions.api. The Python Ontology SDK also provides a bridge that TypeScript v2 does not, supported only when using v2 of the Python Ontology SDK. TwoDimensionalAggregation.from_osdk() and ThreeDimensionalAggregation.from_osdk(result, "date", "groupId") convert a grouped aggregation result into the bucket structure the widget expects. Both take the group-by property API names, which stay camelCase even where the surrounding Python identifiers are snake_case. See Create a custom aggregation with Python functions for a Python example.
For more TSv1 examples, see the Functions documentation on object set aggregations and creating custom aggregations.