- Capabilities
- Getting started
- Architecture center
- Platform updates
Getting started
The application previously known as Workflow Builder is now called Workflow Lineage.
Use Cmd+I (macOS) or Ctrl+I (Windows) to view a graph of the objects, actions, functions, and trained models that back your resource. In AI FDE, use the Workflow Lineage button in the chat outline header to open resources from the current conversation. You can also use Open in Workflow Lineage, commonly found under File or Actions, in the following applications:
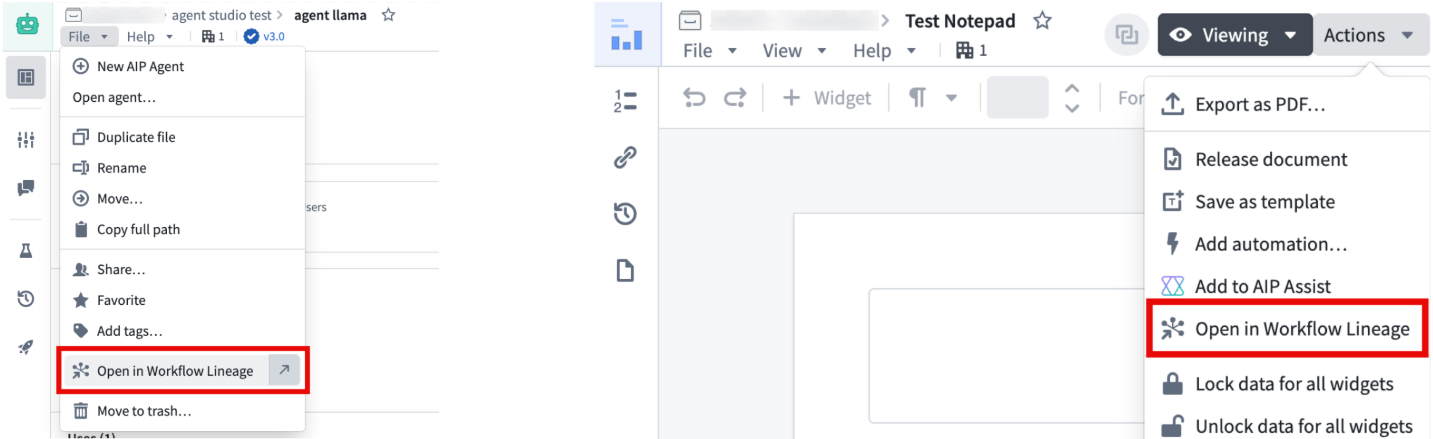
The following applications support these features:
- AI FDE
- Projects
- Folders
- Workshop
- Object types, Action types, Groups, Interfaces, Functions in Ontology Manager
- AIP Logic functions
- Custom Widgets
- Function repositories
- Global Branch branch and proposals page
- Automate
- Third-party applications
- Gaia maps
- Monitoring Views
- Models
- Quiver dashboards
- Machinery
- Slate
- Chatbot Studio
- Developer Console (Keyboard shortcut only)
- DevOps Resources Overview (Keyboard shortcut only)
- Marketplace (Keyboard shortcut only, in a draft resource's overview tab.)
- Notepad (Navigation option only)
- Object types in Pipeline Builder (Navigation option only)
When you open an object type, action type, function, or Logic function from Ontology Manager, Workflow Lineage automatically displays its upstream and downstream nodes.
When you open Workshop modules or third-party applications, Workflow Lineage limits the automatic expansion of dependencies to approximately 800 nodes. This prevents performance issues that could occur when thousands of nodes are automatically added to the graph. You can still manually expand additional nodes as needed by selecting nodes and using the dependency expansion icons.
To view all keyboard shortcuts, select Help > View hotkeys or review the keyboard shortcuts documentation.
Global Branching support
Workflow Lineage supports Global Branching, allowing you to inspect, edit, and validate workflow resources on a branch before merging changes into main. When working on a global branch, you can open Workflow Lineage from branch-aware entry points including the AI FDE panel, the global branch bottom bar, the branch page, and the proposal page. You can also use the Cmd+I (macOS) or Ctrl+I (Windows) shortcut from supported resources on a branch to open Workflow Lineage in the same branch context.
Learn more about Branching in Workflow Lineage.
Generate graphs with AI FDE
You can use AI FDE to visualize dependencies or create annotated Workflow Lineage graphs.
There are two ways to generate a lineage graph with AI FDE:
- Quick view: Press
Cmd+I(macOS) orCtrl+I(Windows) in the AI FDE window to generate a graph of all resources in your current chat context. - Custom graph: Ask AI FDE what you want to see: specific resources, downstream dependencies, or a slice of your workflow. AI FDE builds a lineage graph for the request and can annotate it with text nodes that describe your workflow.
Interface
Workflow Lineage's interface consists of the two main components, as seen in the following notional screenshot:
- Graph panel: An interactive graphical view of the entities backing your workflow and the relationships between them.
- Workshop panel: An interactive view of the selected Workshop applications.

Graph panel
When you select nodes on the graph panel, you can see the corresponding Workshop components highlighted on the Workshop panel. This makes it easy to see the exact places that are using specific nodes and can help show you where specific objects are being used.

When you select a specific node on the graph, you can use the Pin option to pin it to the left sidebar or view more details about the node.

When you select a node, Open in new tab appears to the right. Select it to open the resource in its native application. This option is available for functions, object types, action types, Workshop modules, Slate applications, AIP Agents, Notepads, Machines, interfaces, object views, Ontology SDKs, Gaia Maps, language models, and trained models.
To see all linked dependencies for a particular node, select the icon corresponding to the input type you want to see on the graph.
Use the expand buttons in the top toolbar to expand selected nodes one step upstream or downstream instead of right-clicking each node.
You can view the icons of each node type in the legend at the top right of the graph panel. Object type nodes are represented using the icon specified in the Ontology.
You can adjust node widths for each workflow graph to display longer node names.
In the example below, we want to see the nine actions dependent on the Outage Alert object. Select the same icon location inline on the object to show and hide those dependencies from view.

Filter trashed resources
Use the trash icon in the toolbar to remove trashed resources from the graph and exclude them from node connections. Select the icon again to restore the trashed resources.
Search by resource identifier
Paste a resource identifier (RID) into the search sidebar to search the graph. Supported resource types include object types, action types, interfaces, type groups, functions, AIP Logic, language models, and trained models. Workflow Lineage highlights matching resources on the graph.
Search by property name
When you search for a property display name, Workflow Lineage highlights object types that contain a property with that name.
Add resources to the graph
You can add resources to your Workflow Lineage graph in several ways:
- Add individual resources: Use the file search to find specific resources and add them to your graph one at a time.
- Add all resources from a folder or project: When using file search to find resources, a button appears next to folders and projects in the file explorer that lets you add every supported resource from that location as nodes on your graph.
To add all resources from a folder or project:
- Open the file search in Workflow Lineage.
- Navigate to the folder or project containing your resources.
- Select the button next to the folder or project name to add all supported resources from that location to your graph.
View selection details
Review details of a specific node by selecting the node and then opening the selection details panel on the left side of the screen. Details displayed vary depending on the type of node selected. The following is a list of sample details that can be found for each resource:
- Objects: A list of properties and where those properties are used throughout the workflow (see property provenance linked below), linkages, backing data source, and so on.
- Object links: Resource usage by objects, functions, actions, Workshop applications, and more.
- Functions: Inputs, outputs, dependencies, repository, ontology binding, and other relevant metadata.
- Actions: API, RID, input data, Ontology edits, and submission criteria.
- AIP Logic functions: Dependencies, automations, and metadata about creation details.
- Language models: Model descriptions and metadata on model creator and context windows.
- Workshop applications: Metadata about creation and action, function, and object dependencies.
- Custom widgets: Workshop applications that use the custom widget.
- Interfaces: Properties defined on the interface, the object types that implement the interface, and the interfaces it extends from.
- Geospatial maps: Connection buttons on nodes such as object types that provide access to geospatial map nodes and their relationships with other Ontology resources.
- Workbench boards: How Workbench boards relate to other resources in your workflow.
- Vertex graphs: Graph metadata, dependencies, and navigation options.
- Vertex graph templates: Template metadata, dependencies, and navigation options.
- SDK nodes (TypeScript v2 and Python): Relationships between objects registered to an SDK and the functions that depend on it. Select the object type and function buttons on an SDK node to explore these relationships.
- Trained models: Model API inputs and outputs, the selected branch, the model RID, function dependencies, and live deployment details.
When you select multiple nodes, use the Selection details panel to filter the selection. The histogram groups nodes by their action rules.

Support for multiple ontologies
The Workflow Lineage graph displays resources from all relevant ontologies, allowing you to visualize cross-ontology relationships.
All color modes apply to resources from other ontologies. In the default color mode, cross-ontology resources display with a gray header. A warning icon appears in the upper right corner of nodes belonging to a different ontology.
Action type nodes and object nodes will have limited functionality when you select an ontology different from their own. For example, you can only perform bulk updates on function-backed actions within the currently selected ontology.

If multiple ontologies are present, a warning icon will also appear next to the blue cube in the upper right corner of the graph. Though you can only select one ontology at a time, you can view the ontologies present in your graph and switch between them by selecting the cube icon.

Additional details
For Functions, you can view the code when you select the node. This includes the objects from which your function reads and a description of the logic. You can also bulk upgrade functions used in Workshop applications and automations.
When viewing a function execution, select the link icon on the right side of the Run history panel to copy a link to the function trace.
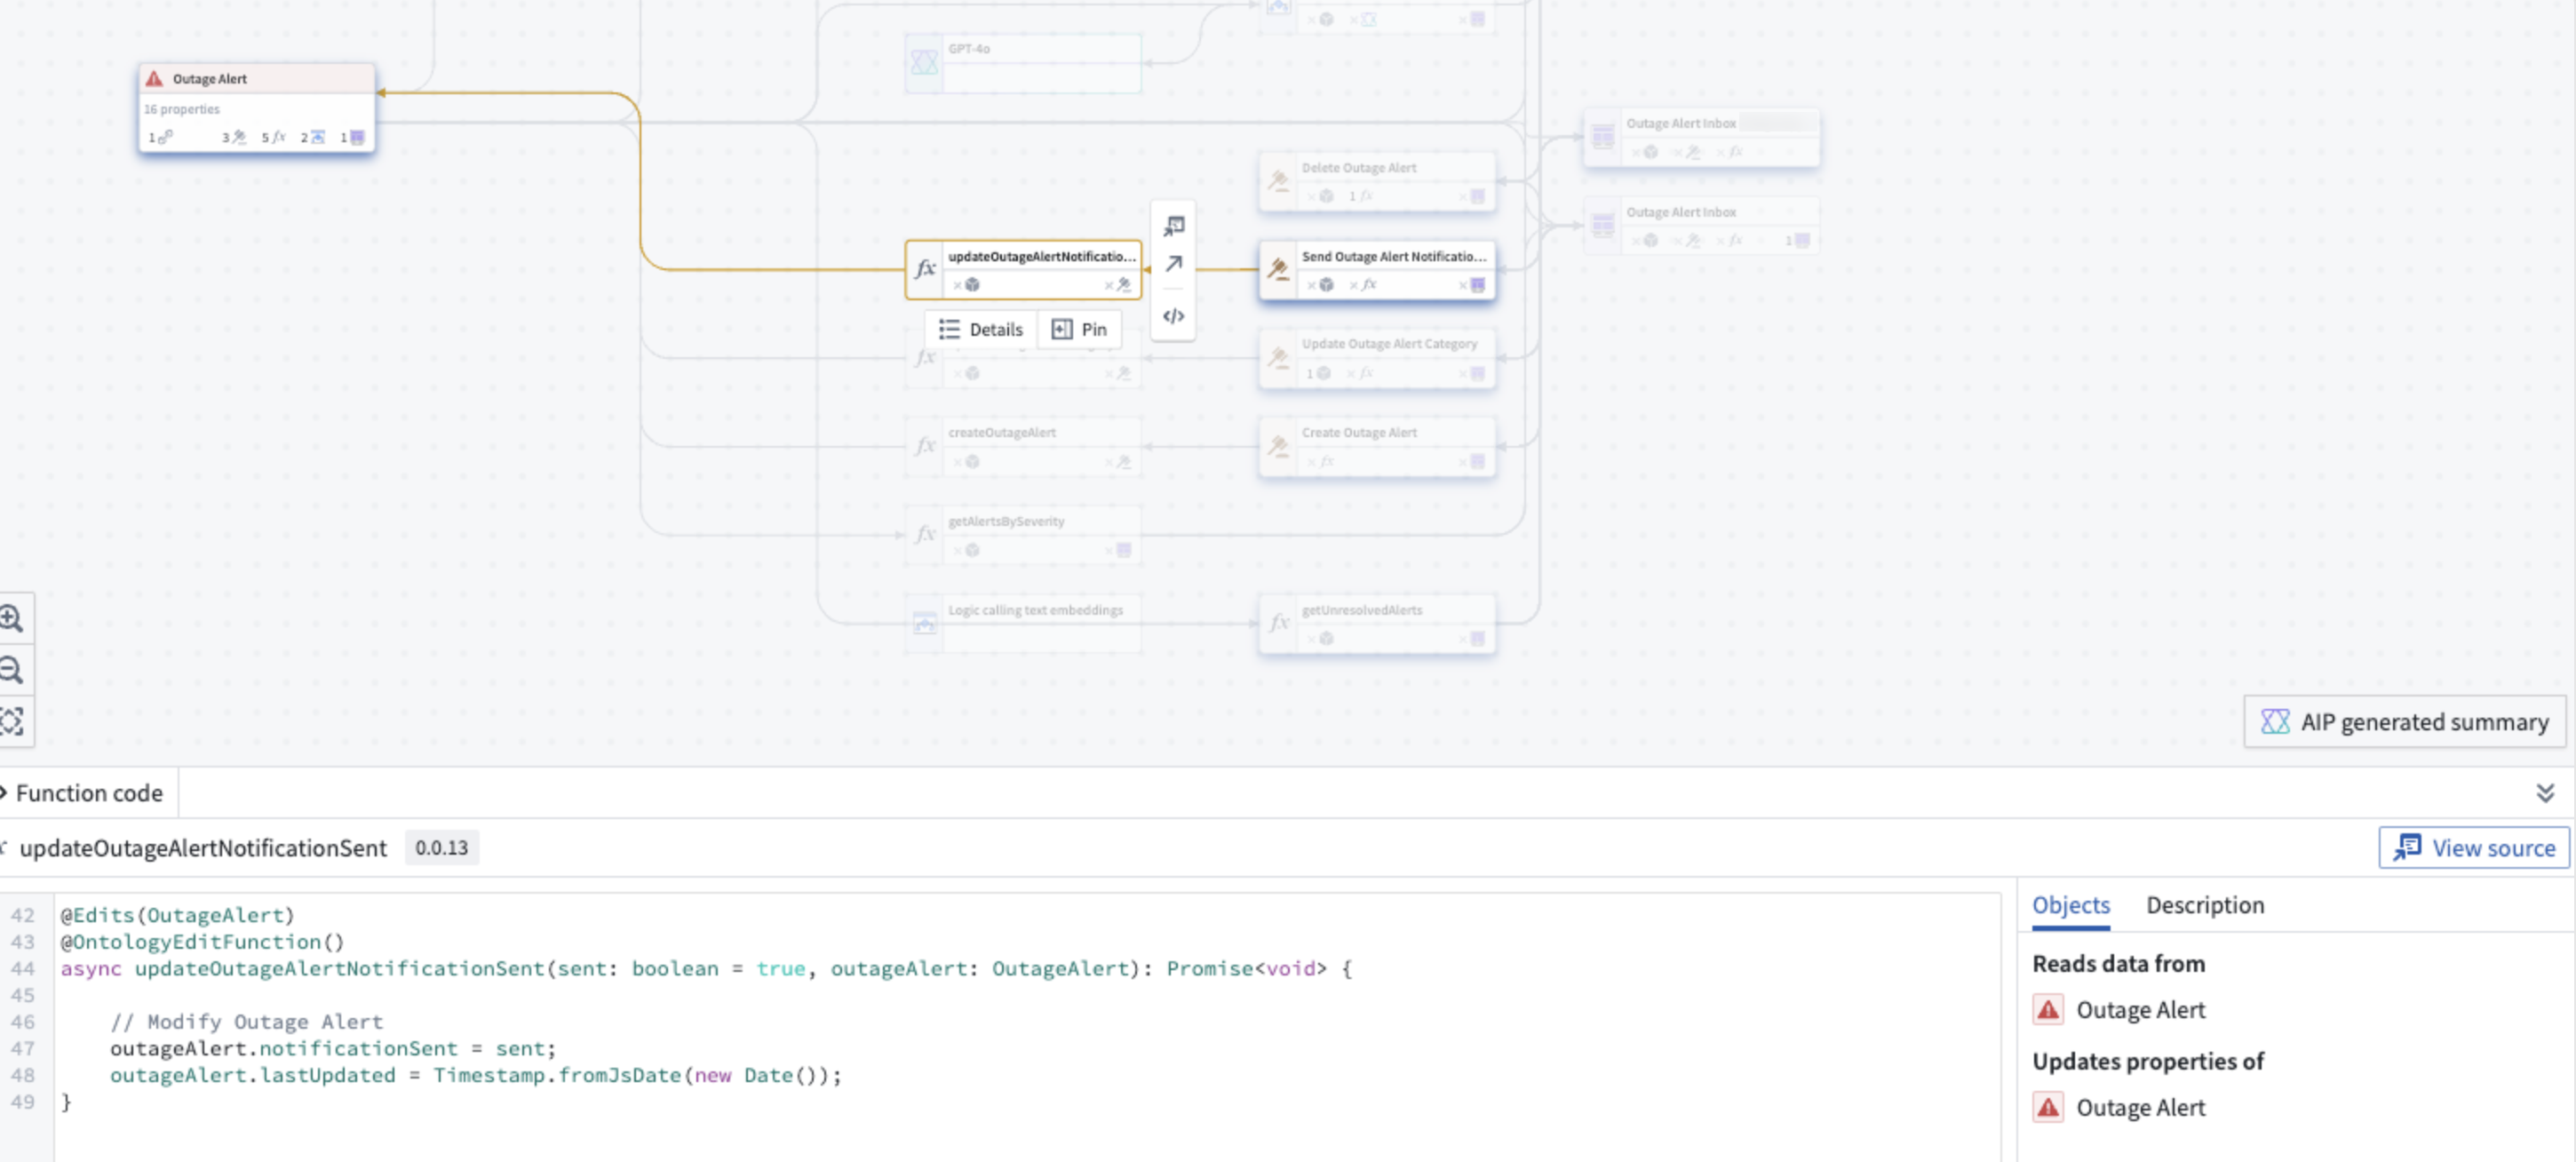
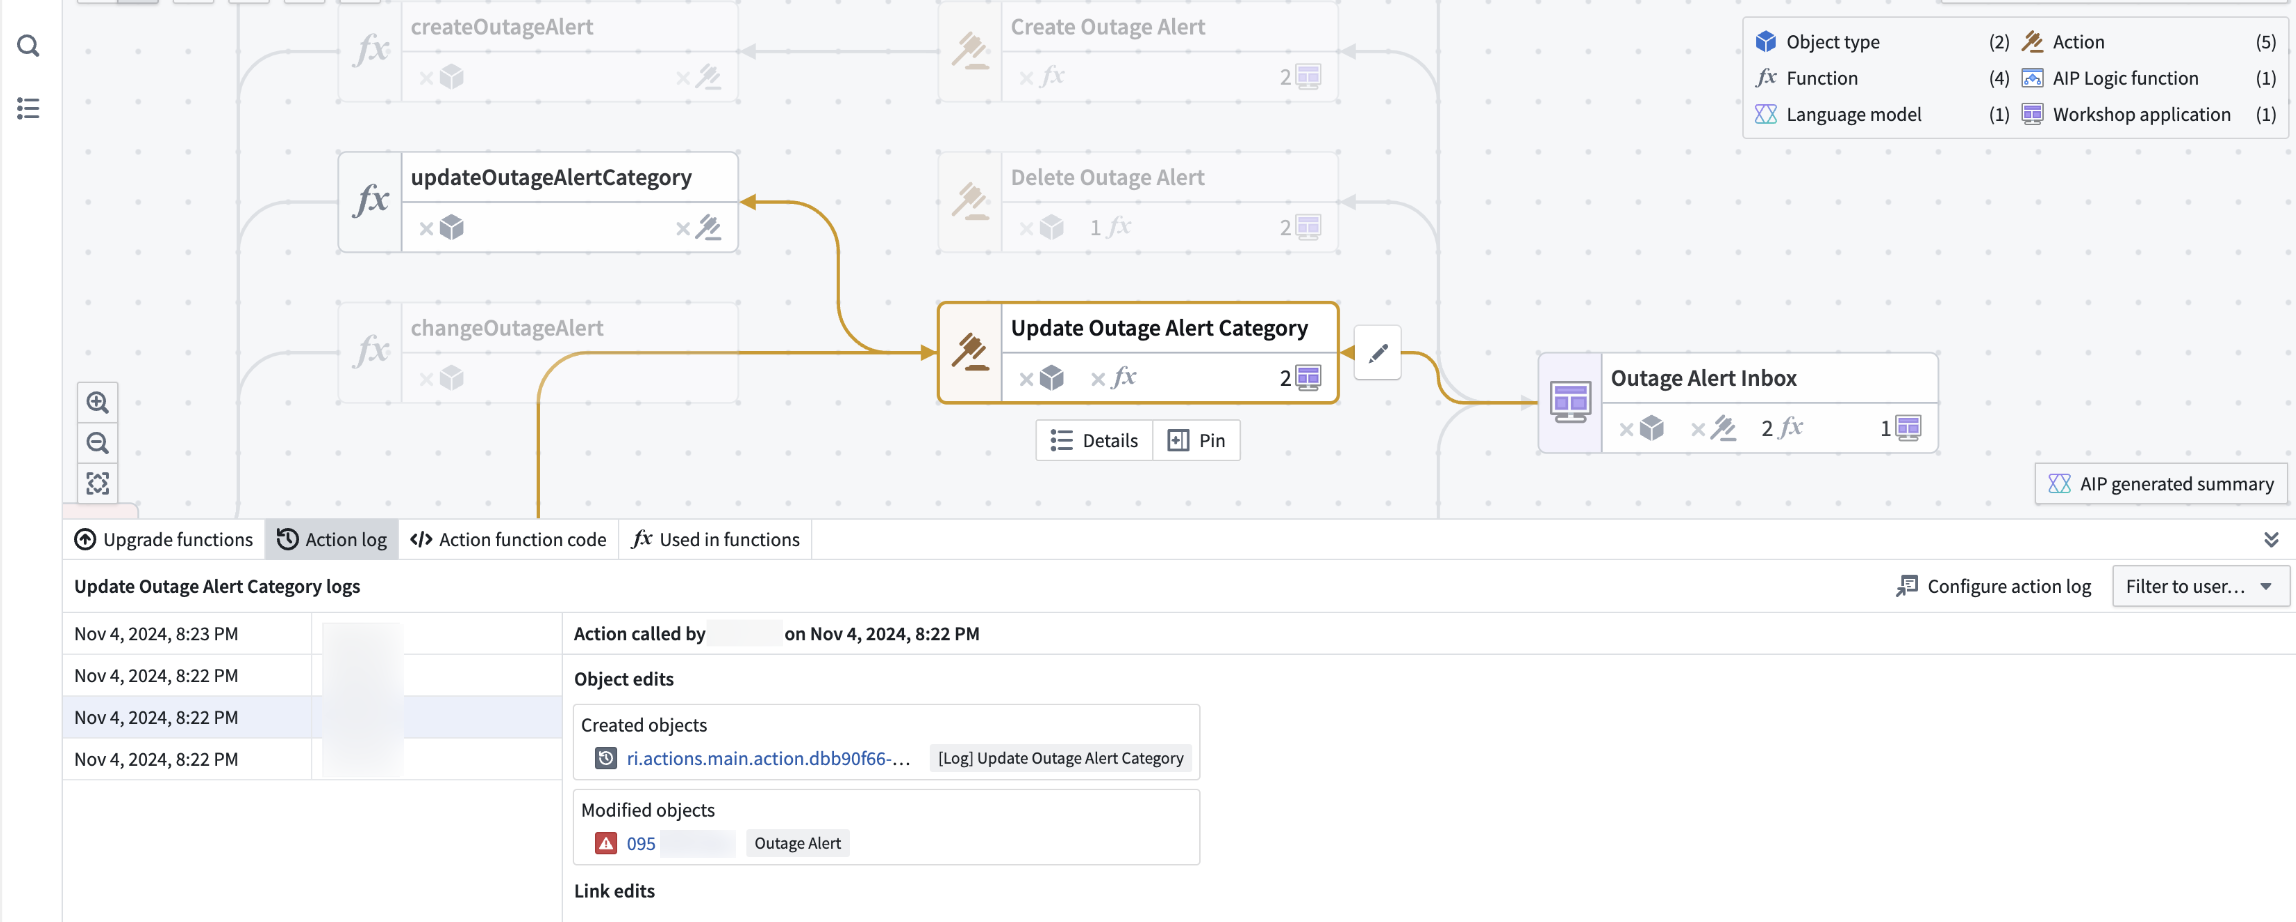
For Actions, you can view the action function code, the action log, and the option to upgrade the action. You can also bulk update the submission criteria on actions and bulk delete actions and objects.
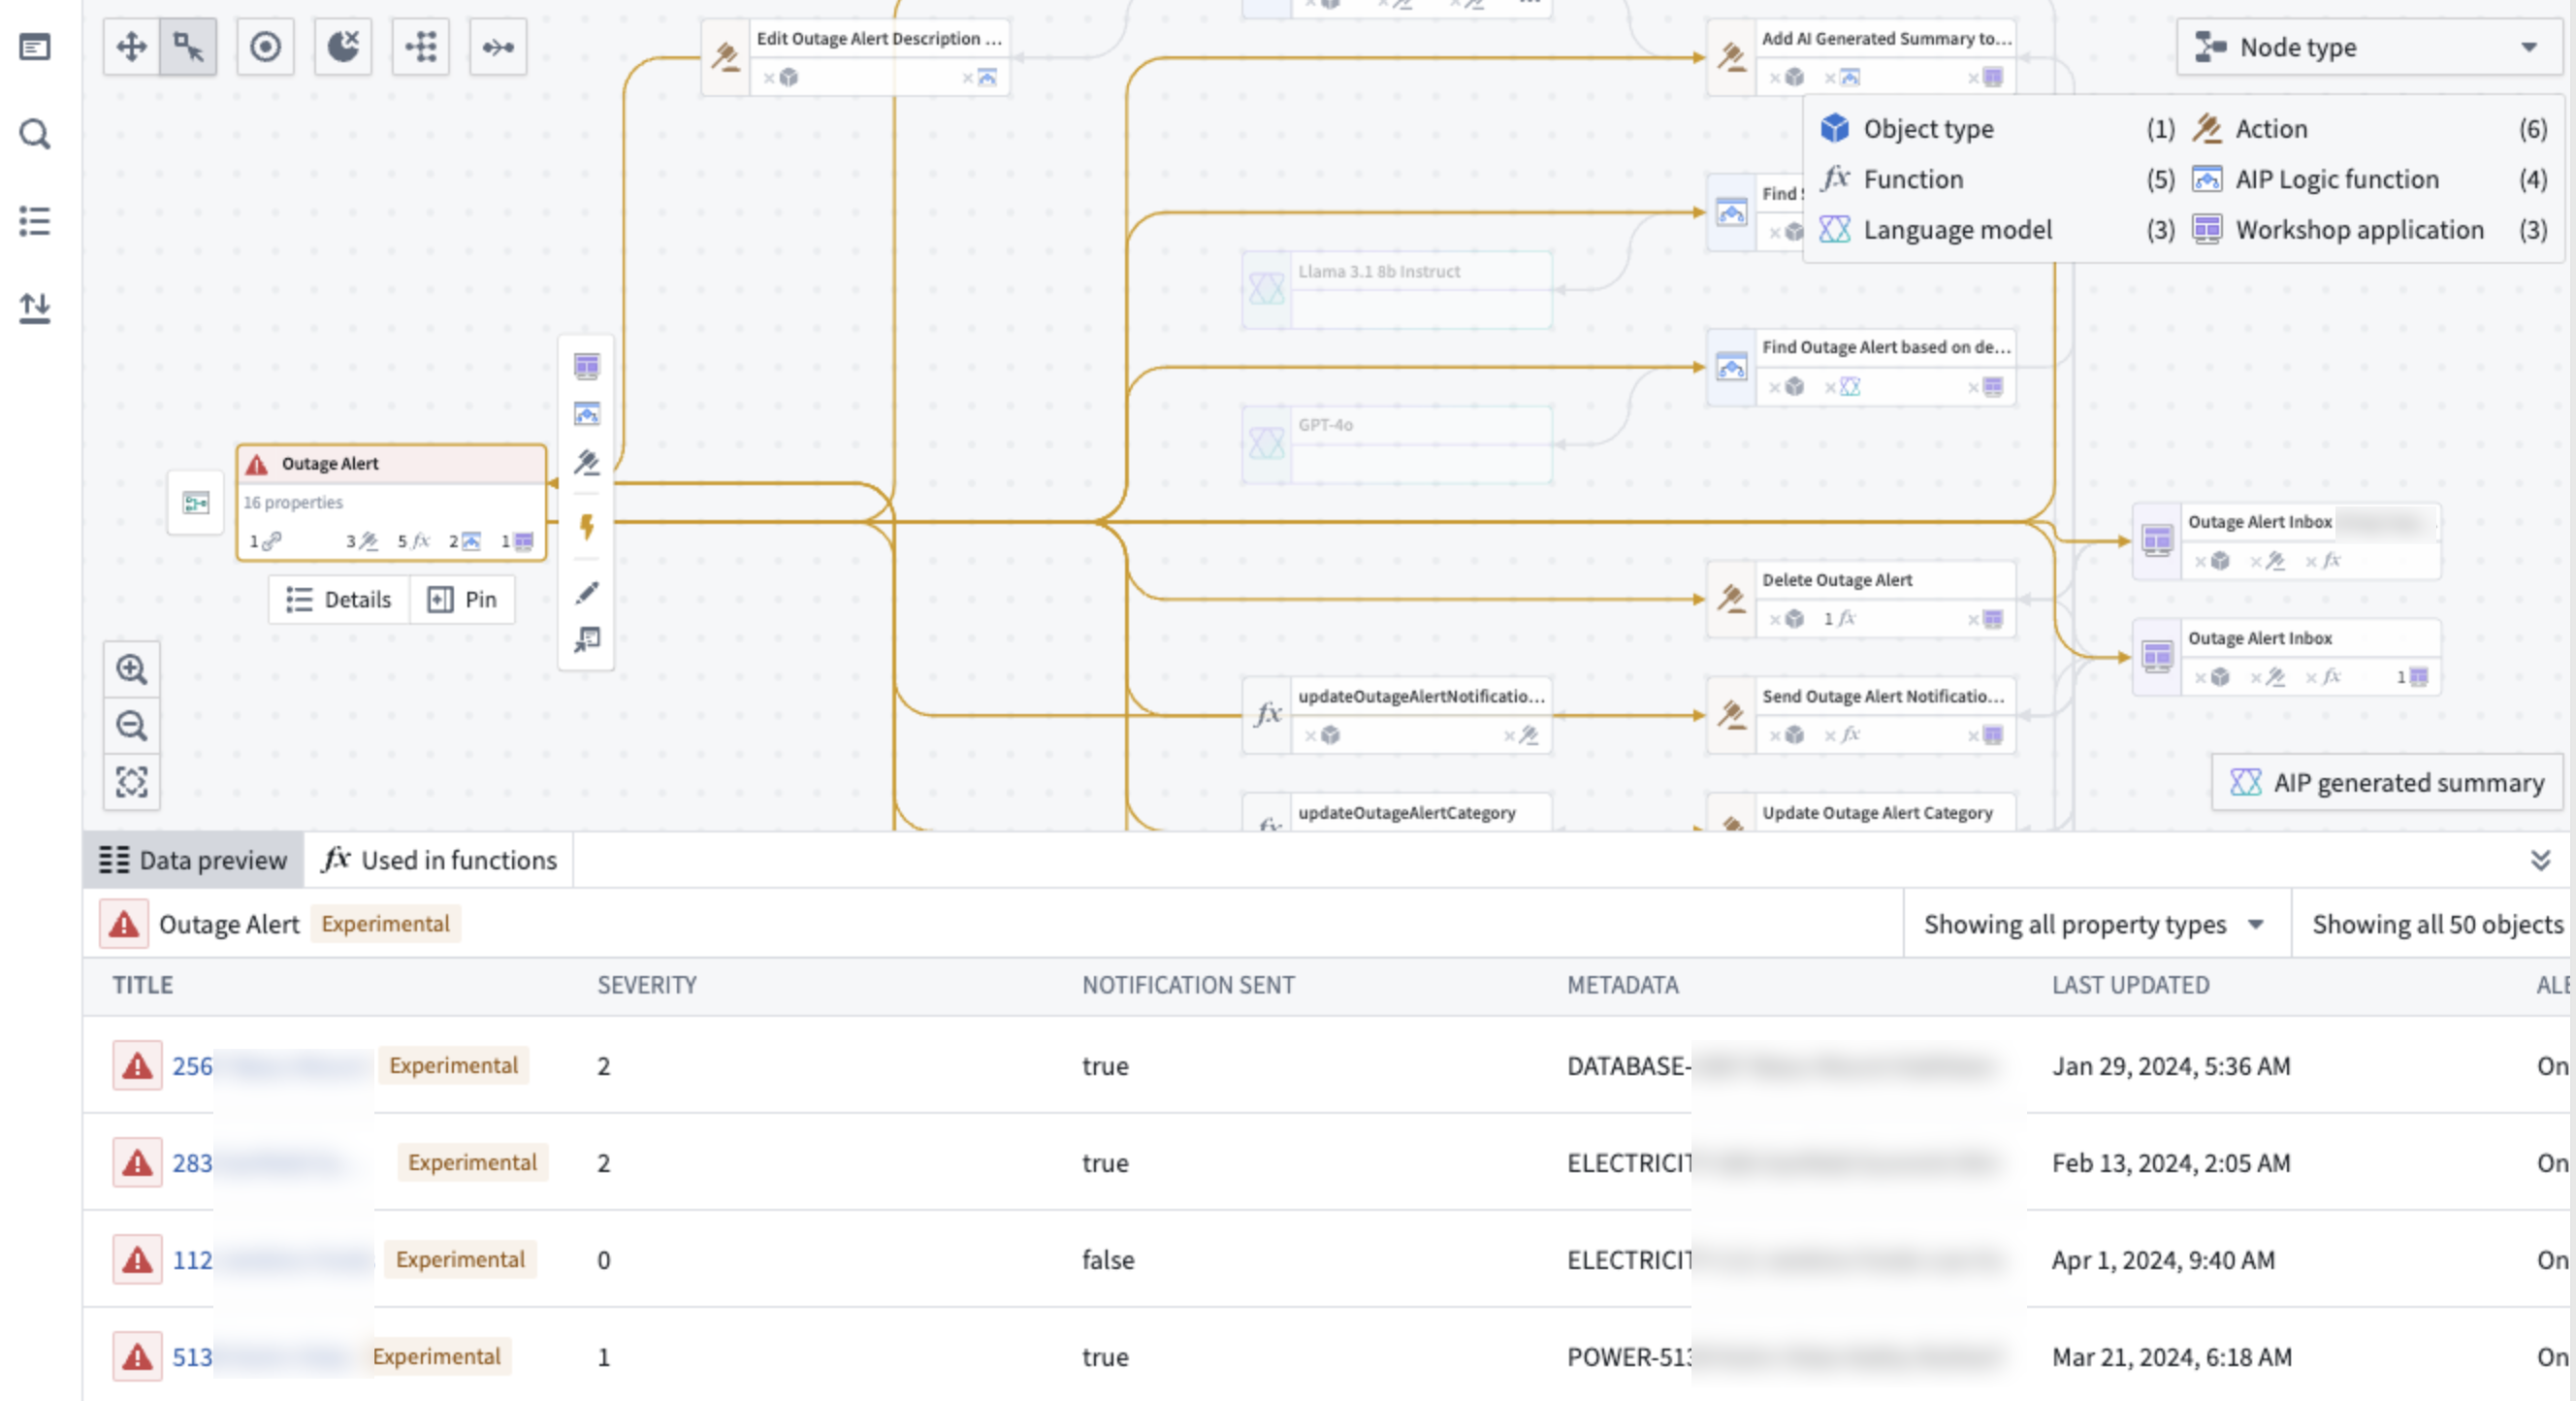
For objects, you can view a preview of the object data. You can also bulk delete actions and objects.
By default, the lines denoting object links and objects that are inputs to actions are not shown on the graph. To see these relationships, select the object nodes. You can use Cmd+A (macOS) or Ctrl+A (Windows) to select all nodes.
You can also view object links under the Links section of the Selection details panel. Hover over each object link to show a preview of all usages.
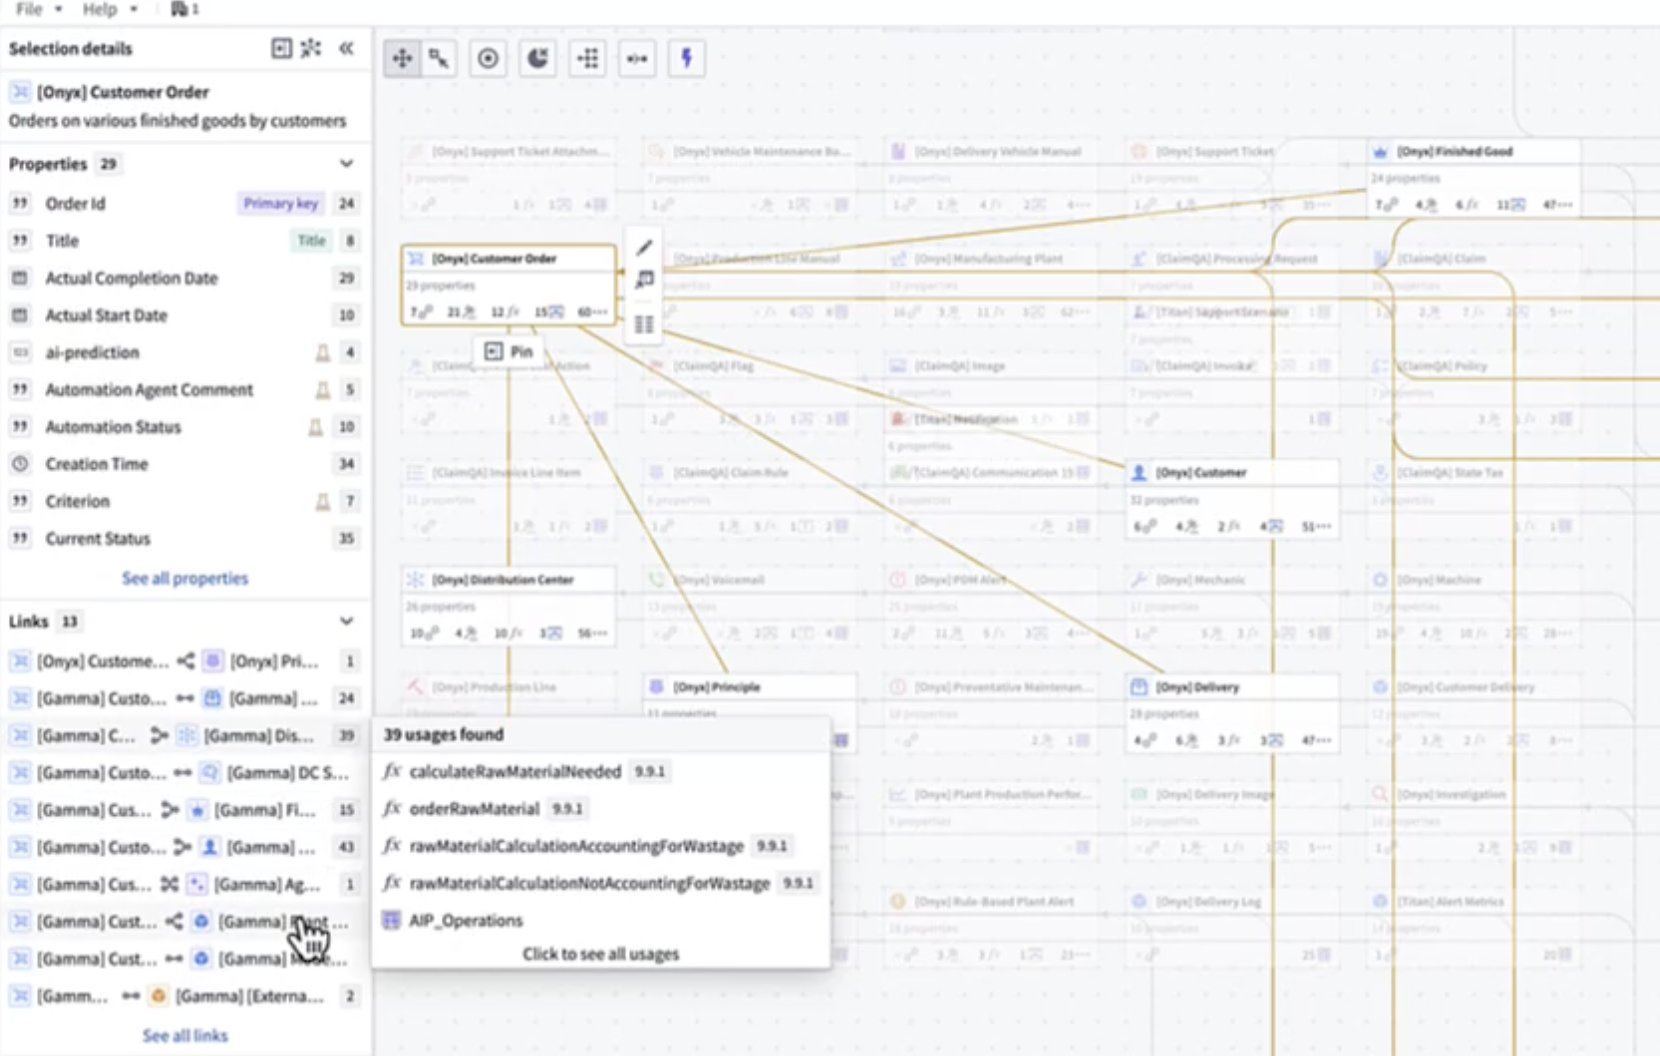
Select the link to view full details. If the link is being edited, a pen icon will appear next to the corresponding usage.

These links will also show up as dependencies in downstream resources.

For Automations, you can view property usages and dependencies in the Selection details sidebar. Under Condition ontology dependencies, you can see a breakdown of the specific object properties on which the automate's condition depends. Hover over the number to view the exact property.

You can also toggle the purple lightning bolt button at the top left of the graph to view the actions and functions that trigger the automation.
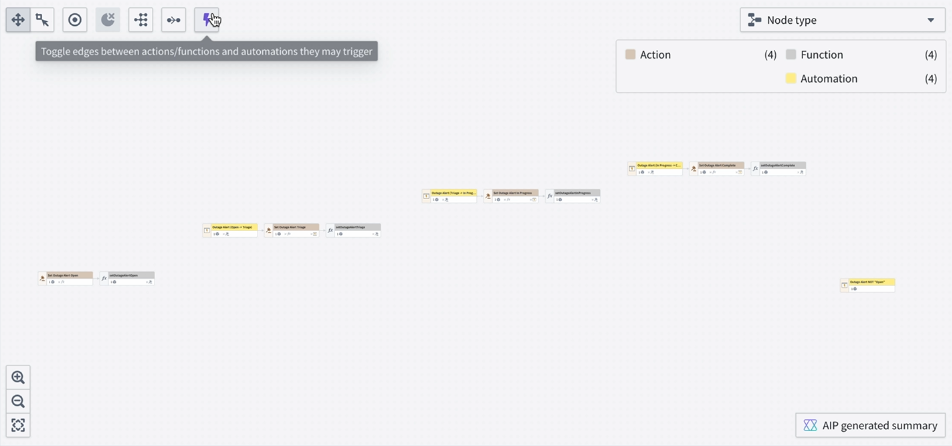
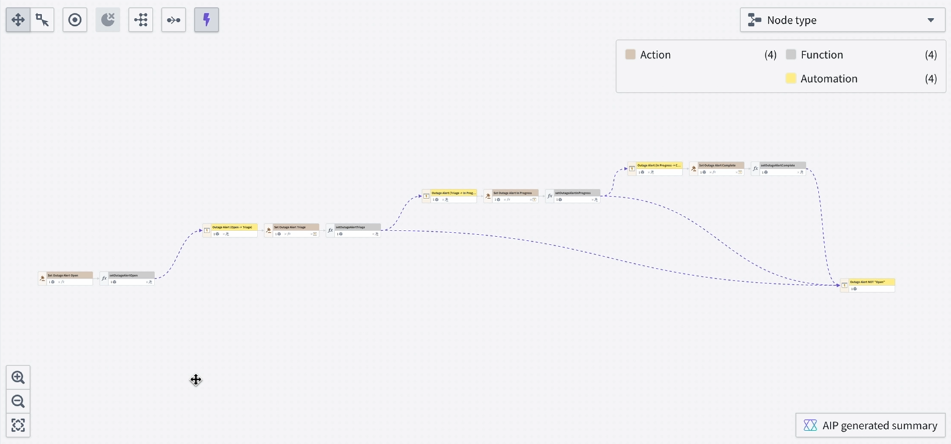
If you have an automation that triggers when a property is a specific value, Workflow Lineage will find the actions or functions that edit that property to that value and link them to the automation.

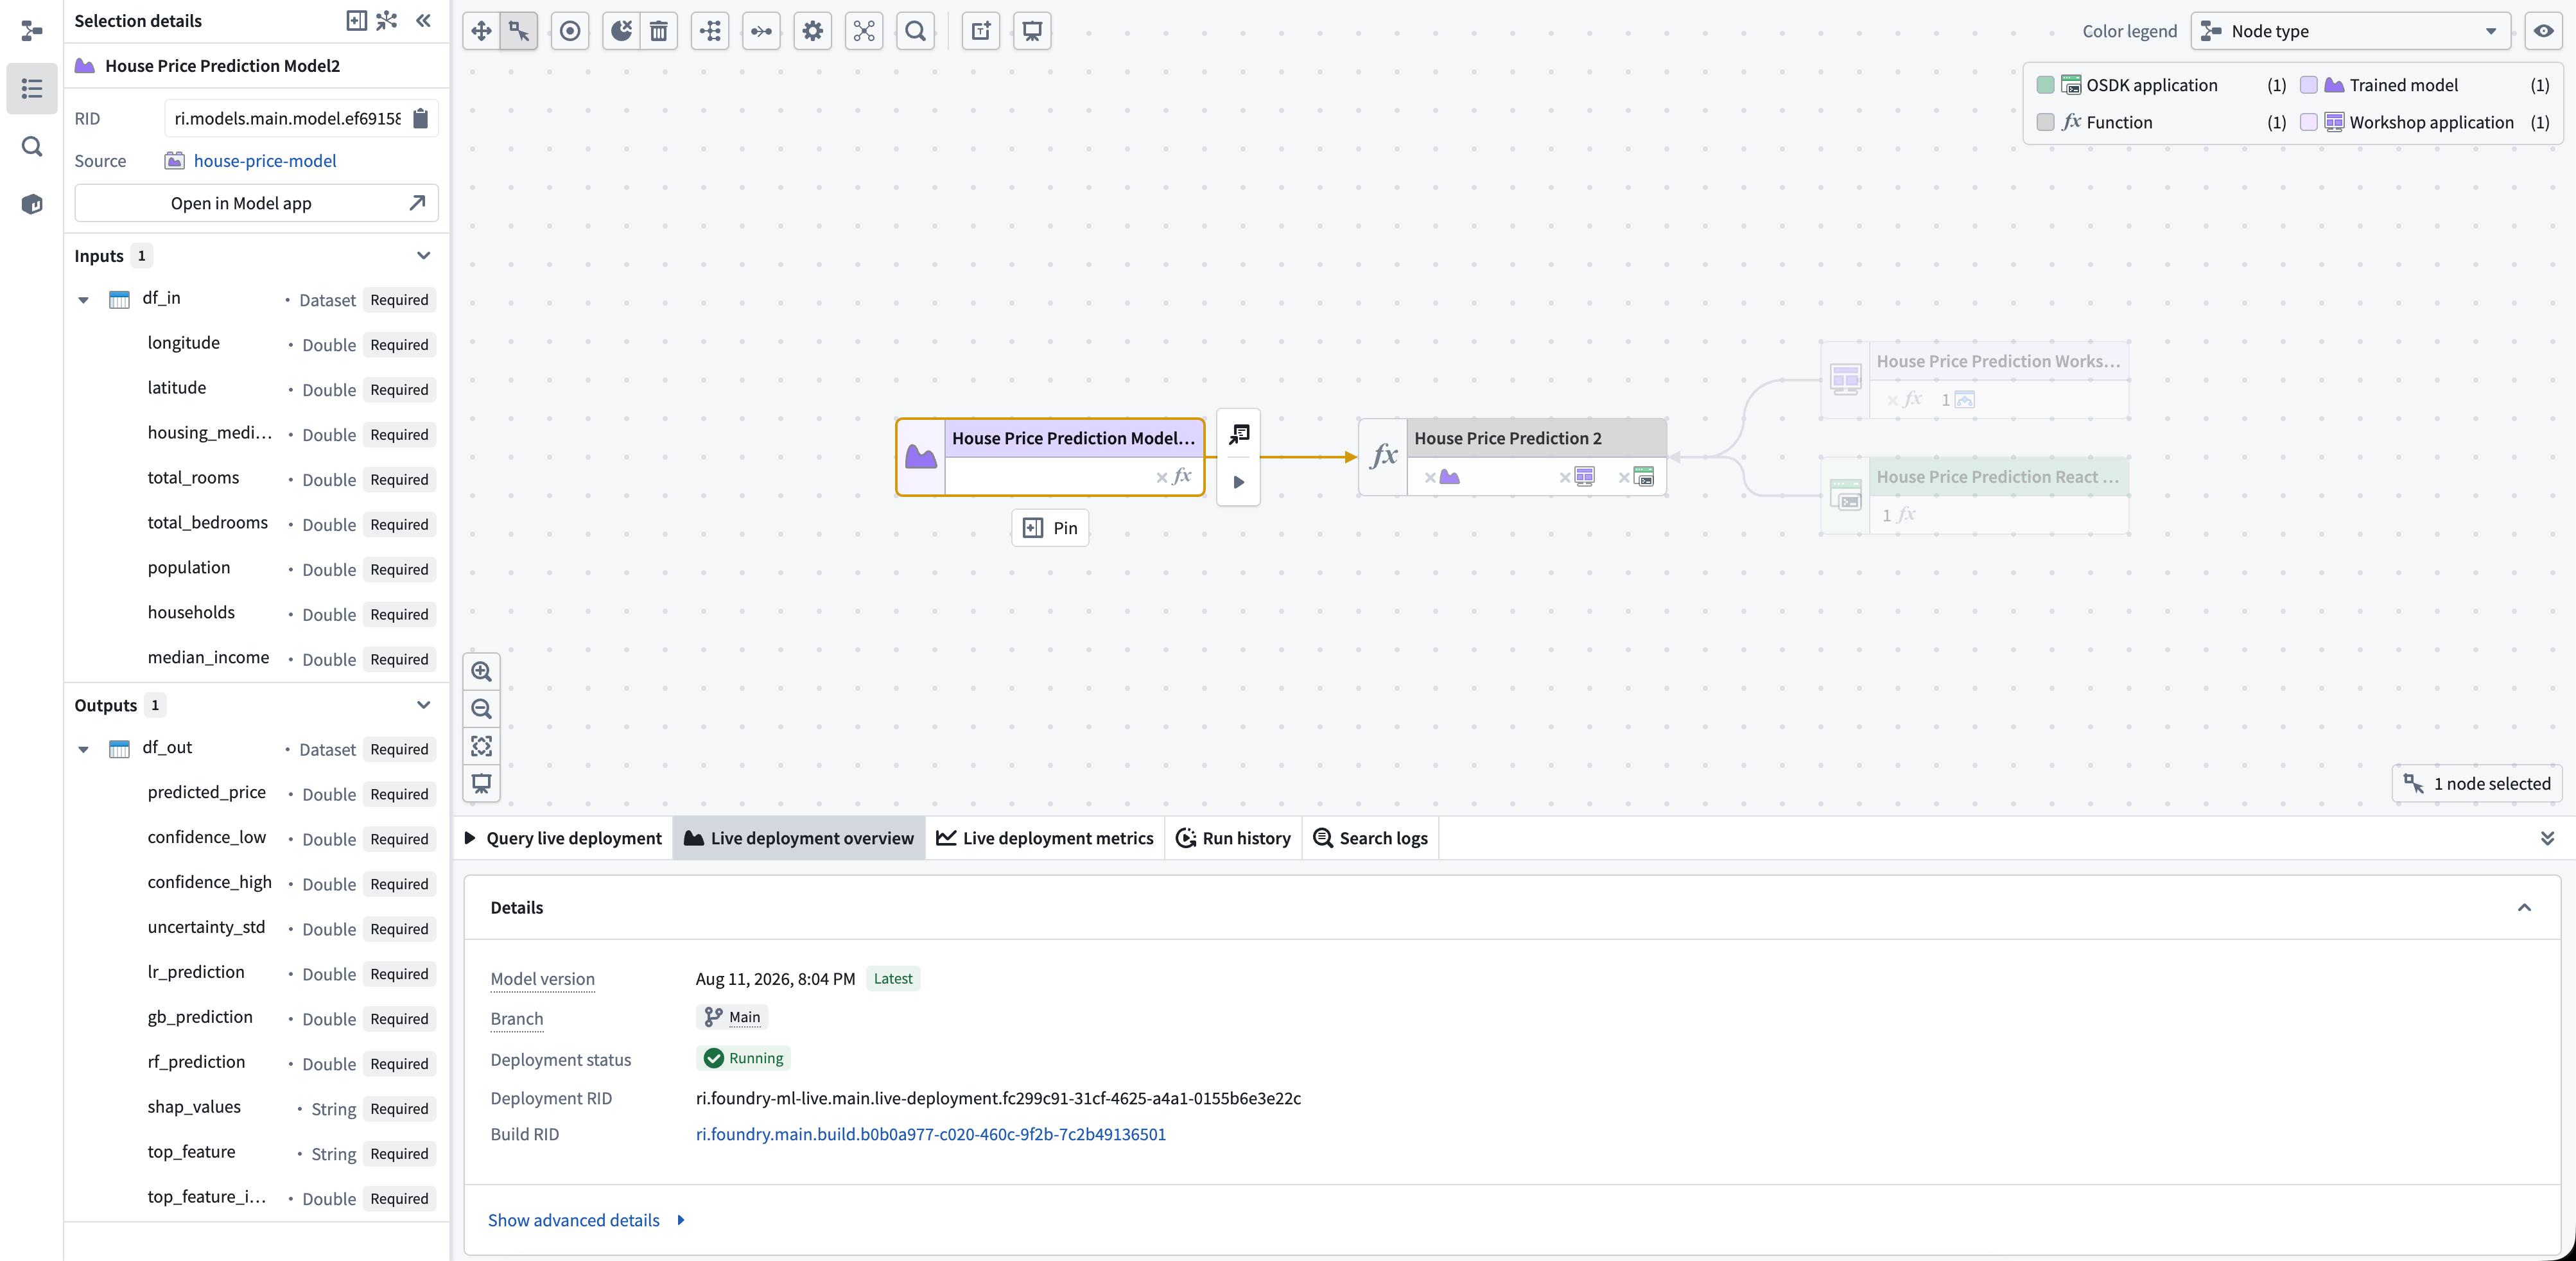
For trained models, you can inspect the functions that use the model and open the model in the Models application or Data Lineage. The Selection details panel shows the selected branch and the model API inputs and outputs for that branch.
When the trained model has a live deployment on the selected branch, the bottom panel provides the following:
- Query live deployment: Send a request to the deployment and inspect its response.
- Live deployment overview: Review deployment health, replicas, and debugging information.
- Live deployment metrics: Review deployment and replica metrics.
Workshop panel
On the Workshop panel, you can select different components and view the corresponding nodes highlighted on the Workflow Lineage graph.
At the bottom of the Workshop panel, the Entities section shows all backing objects and actions used in the application. When you select a specific entity, you can view exactly where the entity is used throughout the Workshop application.
If you have multiple Workshop applications on your graph, you can use the dropdown menu at the top to toggle between Workshop application views.
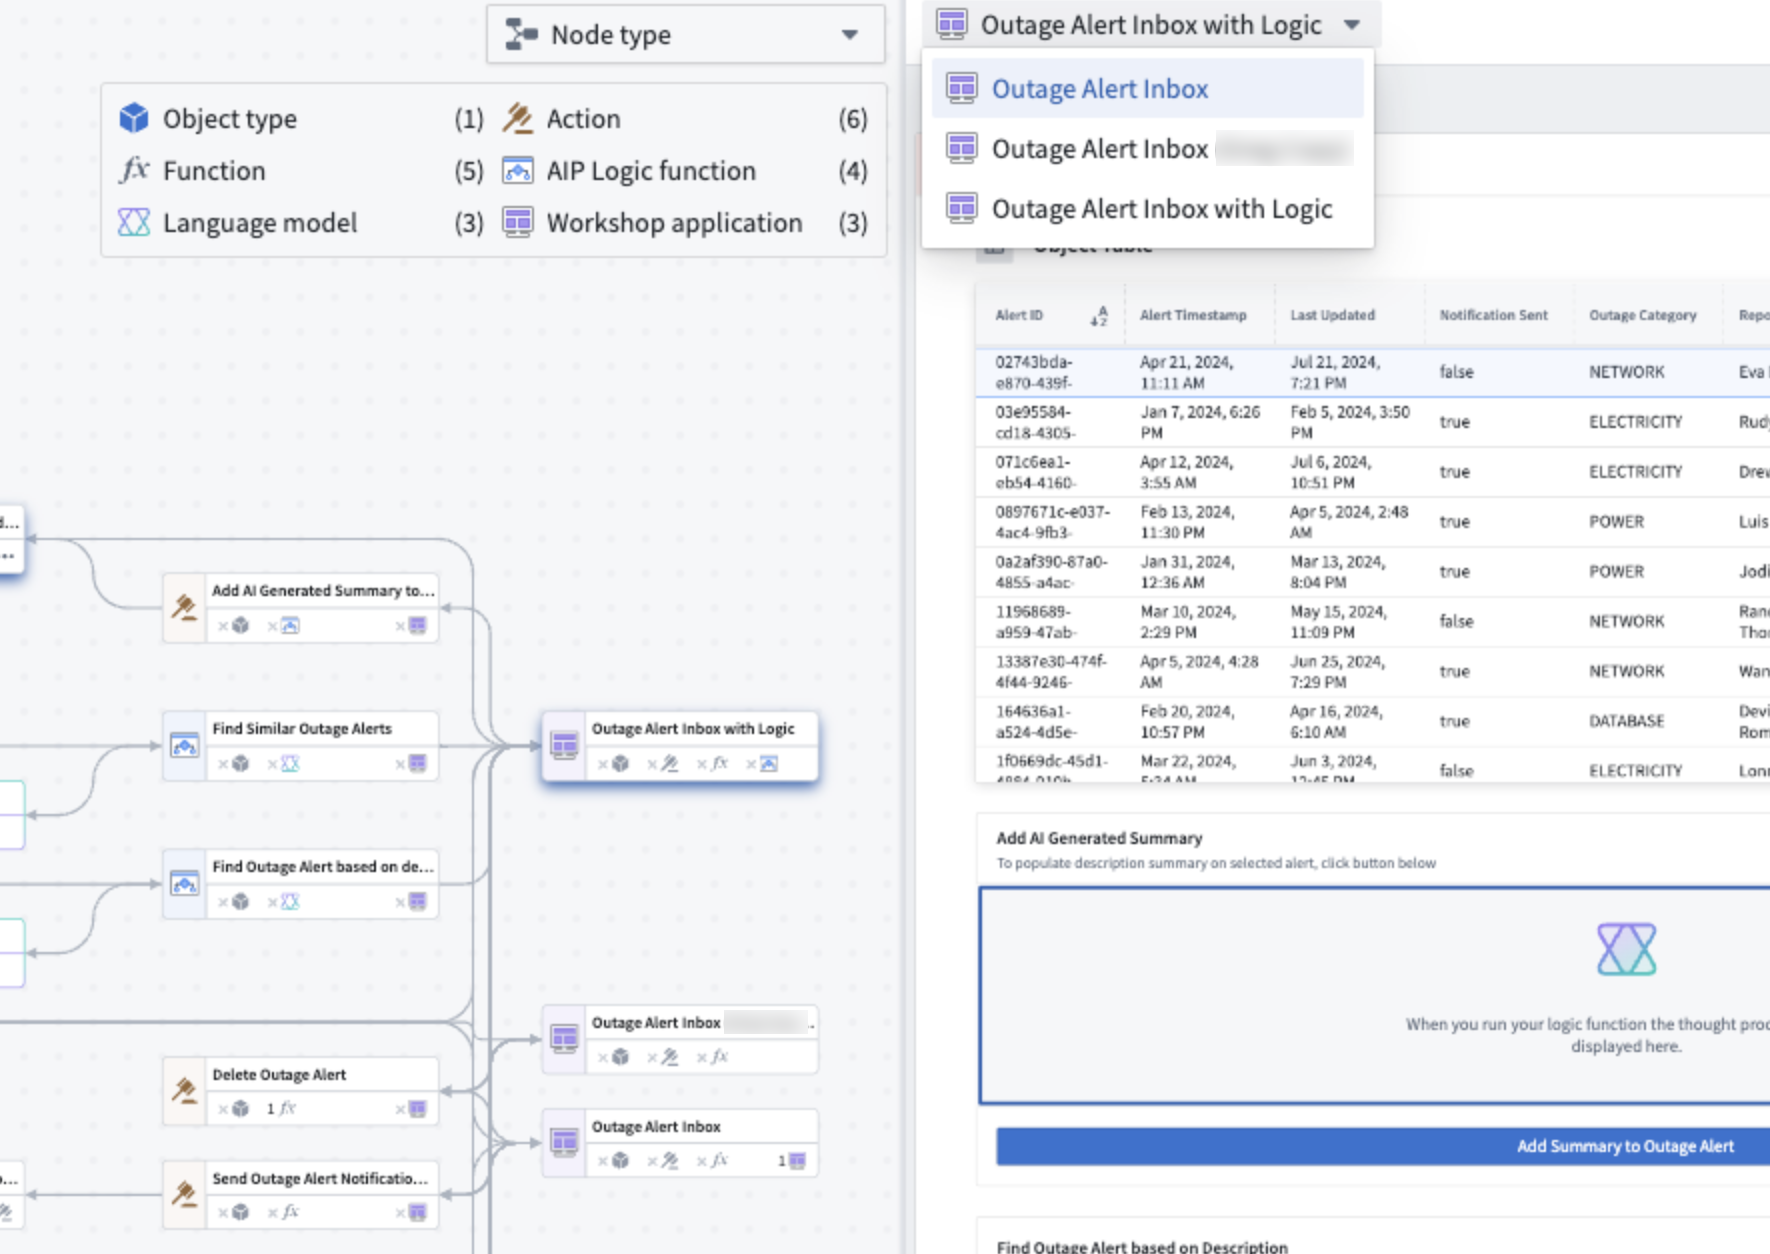
To reopen the Workshop panel, select any Workshop application on the graph and press I, or double-click on the node.
Bottom panel
The bottom panel displays function upgrade, model usage, and submission criteria upgrade panels even when no nodes are selected. For instructions, see Perform refactors and understand your workflows.
When you select a trained model node that has a live deployment on the selected branch, the bottom panel also displays the live deployment panels.
Weekly usage metrics
You can view weekly usage metrics for Workshop applications by selecting Workshop nodes on the graph and navigating to the Weekly Usage bottom panel. This panel displays the total views or unique users for all selected Workshop modules. The metrics are visualized using dynamic clustered bar charts, where each Workshop module is represented week by week.
Color legend options
Workflow Lineage provides a color legend for managing security and viewing application metadata. Use the toggle button to show or hide the legend.
Examples of color legends are below:
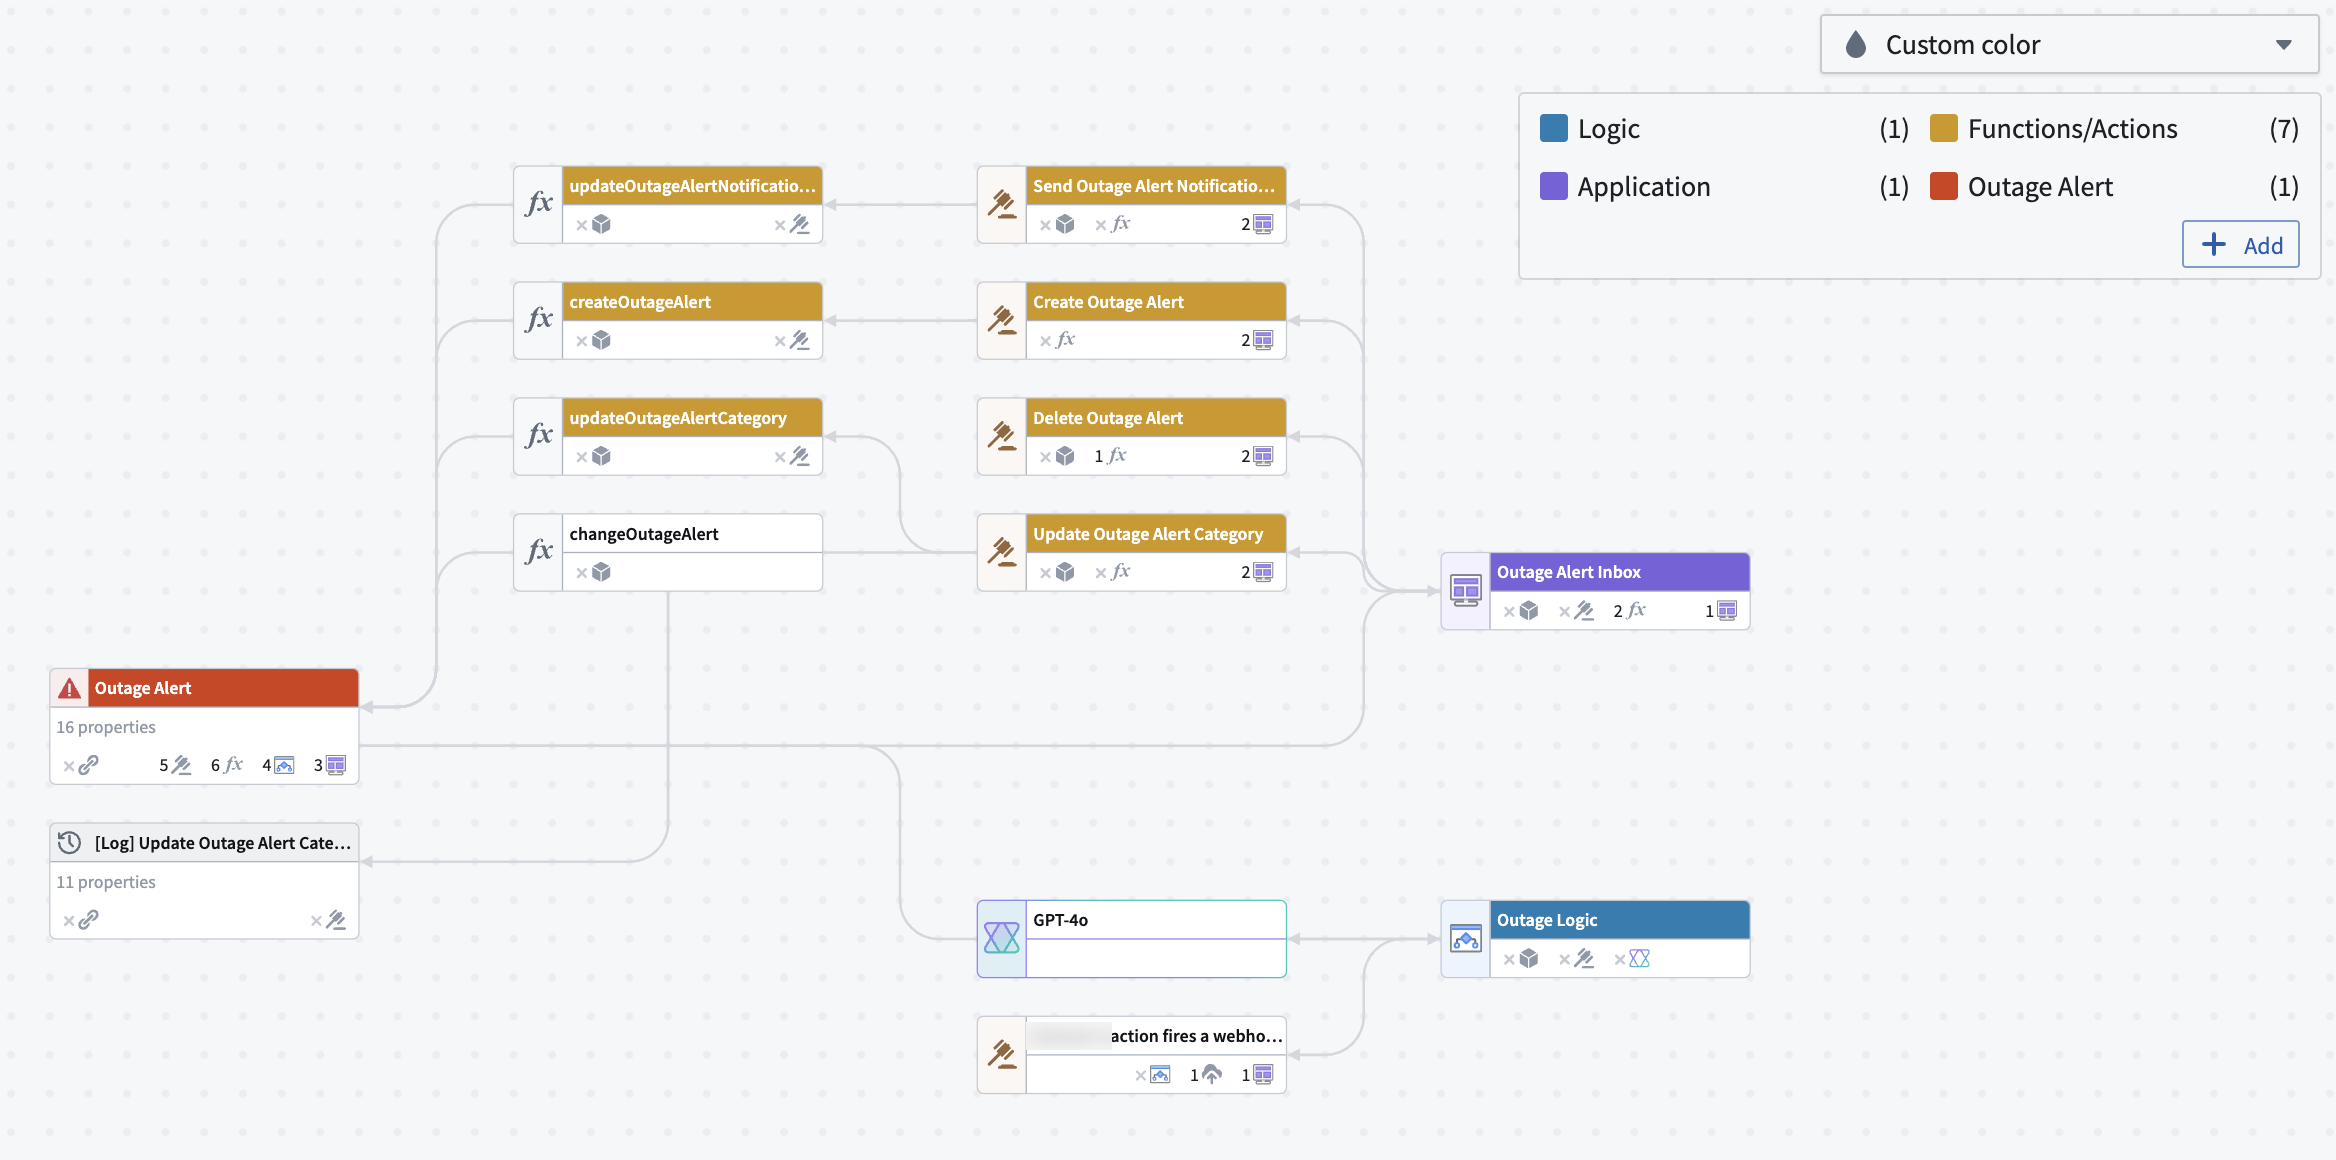
General
- Node type: Shows the type of resource that each node represents on your graph.
- Custom color: Adds colors into the legend by right-clicking nodes to create a new color group, selecting an existing one, or dragging colors from the legend onto nodes.
Permissions
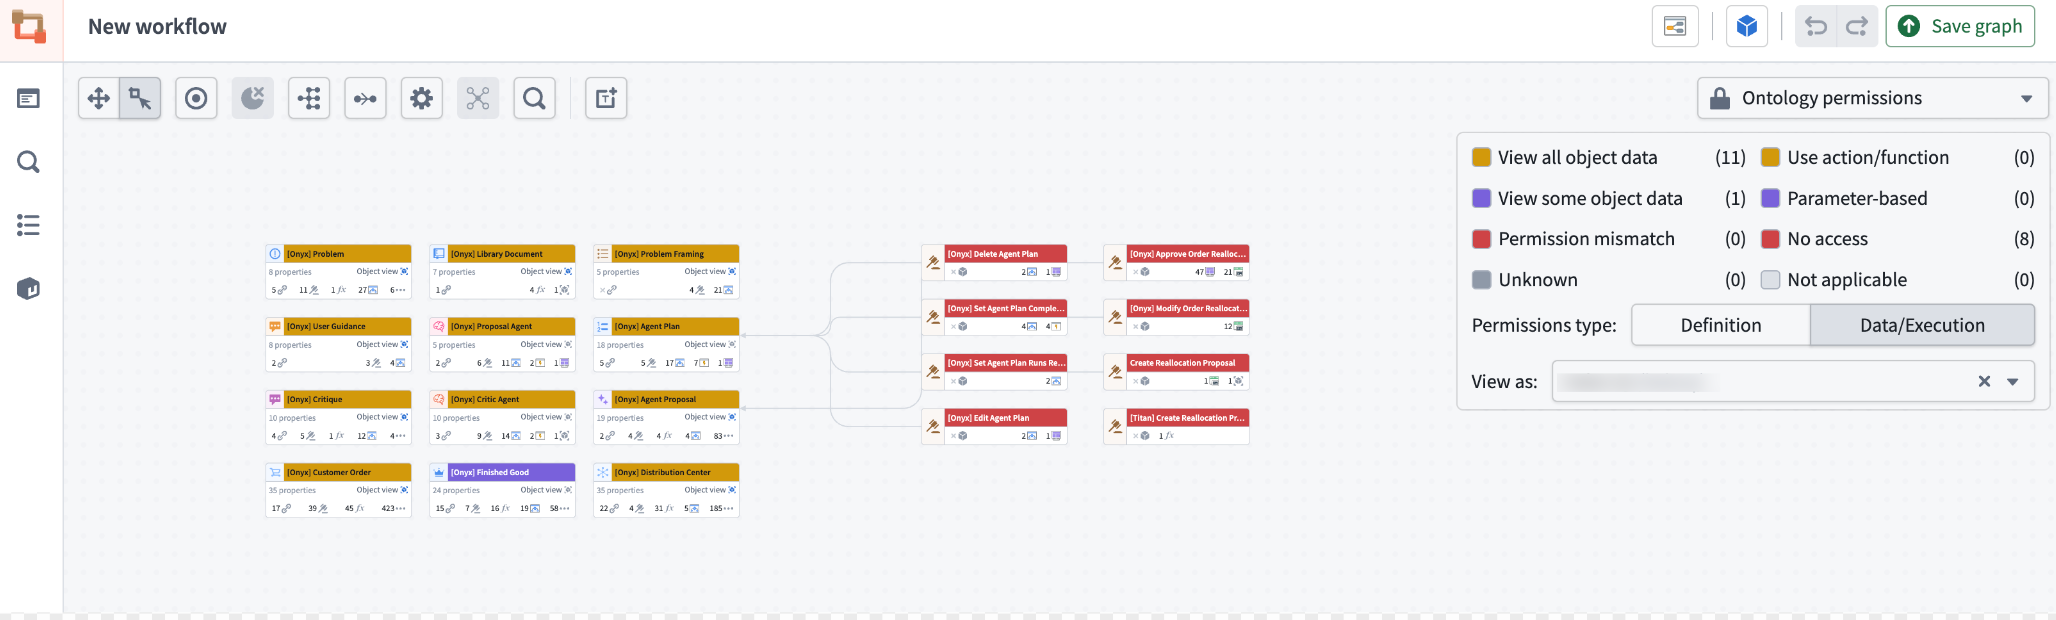
- Ontology permissions: Shows whether the specified user can view or edit entity definitions, and whether they can view object data or execute actions. Review the managing security documentation for debugging action submission permissions.
- Resource permissions: Shows a breakdown for the selected user: whether they are an owner, viewer, editor, discoverer, or have no access to the resource itself. Review the managing security documentation.
Health
- Failure rate: Applies color to action, function, and AIP Logic nodes based on the proportion of runs that failed over a selected time window. Review the failure rate color mode documentation for more information.
- Monitoring status: Applies color to nodes based on the highest severity of any firing monitor targeting that resource. Review the monitoring status in Workflow Lineage documentation for more information.
Usage
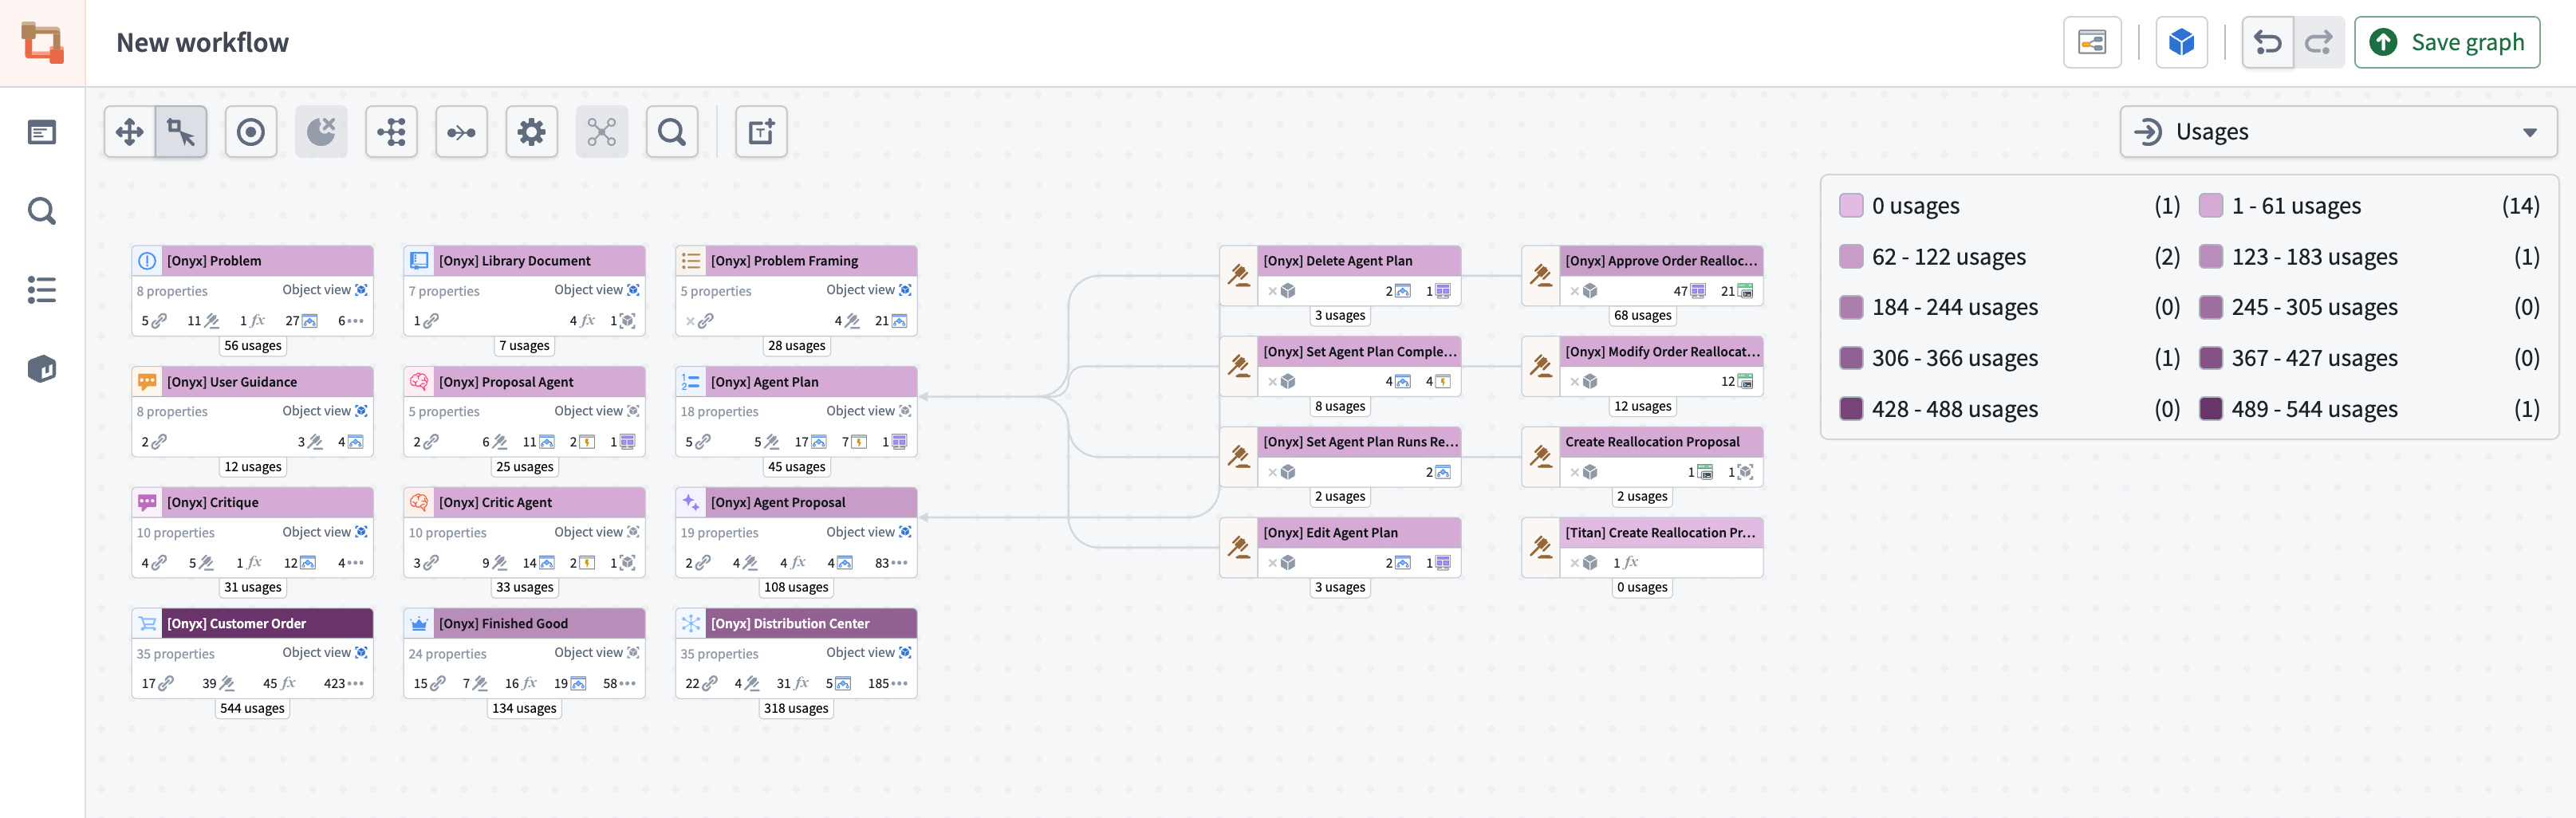
- Usages: Applies color to Workshop applications based on how many views that application had over the past four weeks, in both view and edit mode.
- Failure rate: Applies color to resources based on their failure rate.
- Out of date functions: Review the action-backed function upgrades section.
- Application views: Applies color to Workshop applications based on how many views that application had over the past four weeks, in both view and edit mode.
- Model usage: Review the AIP usage metrics section.
- Object Storage indexing status: Applies color to object type nodes based on Object Storage v2 indexing status, with color intensity indicating how recently the indexing event occurred. Each object type node displays a timestamp showing when the most recent indexing event took place.
- Ontology status: Applies color to nodes based on
Active,Experimental,Deprecated,Example, andPromotedstatuses. - Action rule: Applies color to nodes based on whether it runs a function, creates, modifies, or deletes objects, or does a combination of any of the above.
- Automation expiration: Applies color to automation nodes based on their expiration date.
- Last modified: Applies color to nodes based on their last modified date.
- Last reindexed: Applies color to object nodes based on when they were last reindexed in Object Storage v2. Categories distinguish objects reindexed within the past day, week, month, or year from objects that failed reindexing or have not been indexed. The exact reindex date appears beneath each node.
Monitoring
- Monitoring status: Applies color to nodes based on the maximum severity of their firing monitors. Nodes are marked as healthy if all monitors are passing. The visualization also highlights which nodes are eligible for monitoring but do not have monitoring configured.
Organization
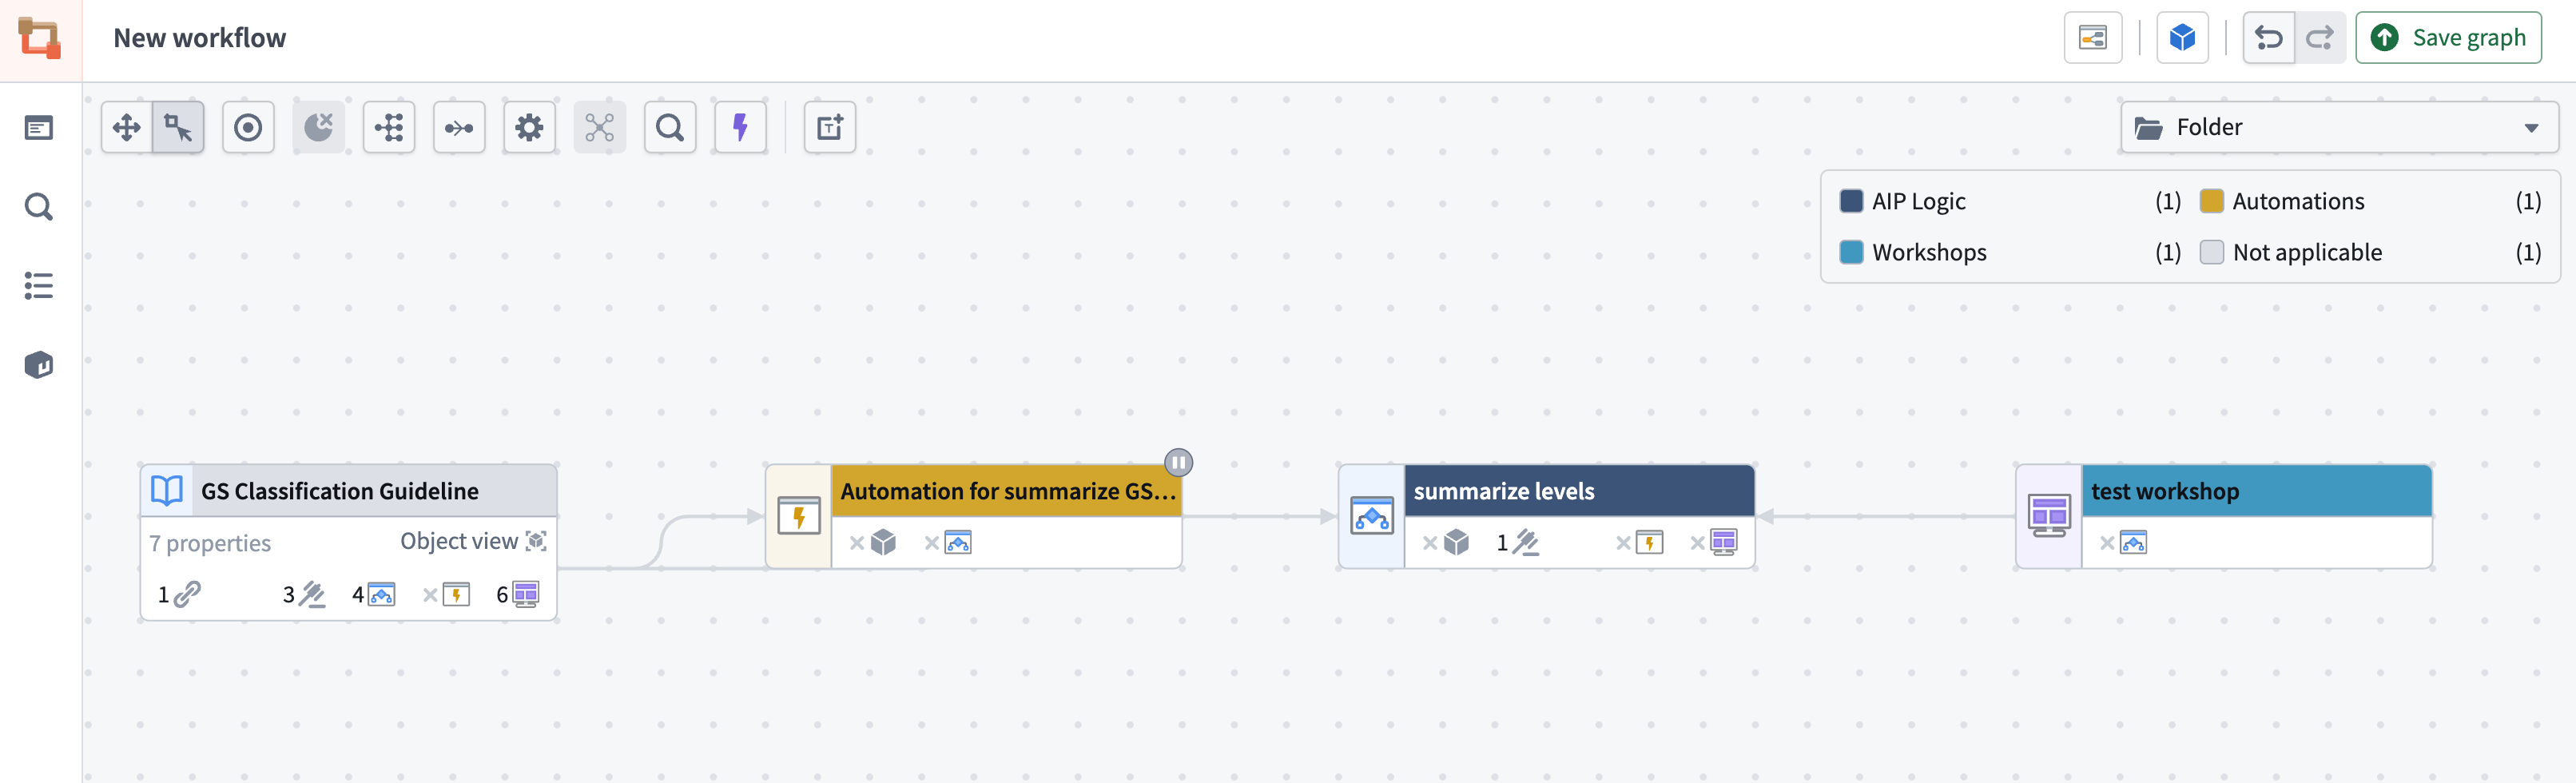
- Folder: Applies color to nodes based on the folder each node lives in.
- Project: Applies color to nodes based on the project each node lives in.
- Portfolio: Applies color to nodes based on the portfolio each node lives in.
- Functions repository: Applies color to function nodes based on the functions repository each node lives in.
Text nodes
Use text nodes to document or call attention to details in your graph. Text nodes support Markdown syntax ↗ and custom colors. Layout options do not affect text nodes, and text nodes are not attached to other nodes. Because text nodes render in the background, you can use them to organize graph nodes into sections without obscuring them.

- Select Text in the top-left of the graph.
- Double-click the text node, then add Markdown text. Workflow Lineage saves changes as you type.
- To exit edit mode, use
Cmd+Enter(macOS),Ctrl+Enter(Windows), orEscape. You can also select outside the text node. If you want to discard your changes and revert to the previous version, use the discard option available while editing.
To color a text node, right-click and select Color nodes. Choose a color or add a new color.
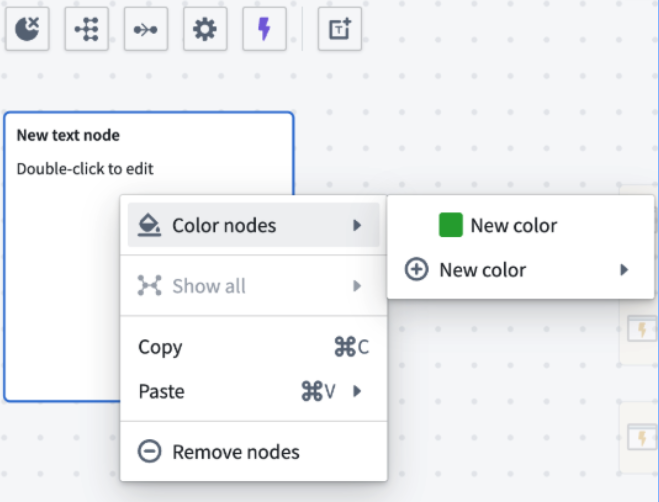
You can also resize text nodes using the three lines in the bottom right corner. If the length of your text is greater than the length of the text node, the node will automatically become scrollable.

Learn more about understanding workflows in Workflow Lineage.
Presentation mode
Use presentation mode to create and organize visual snapshots, or frames, of your graph.
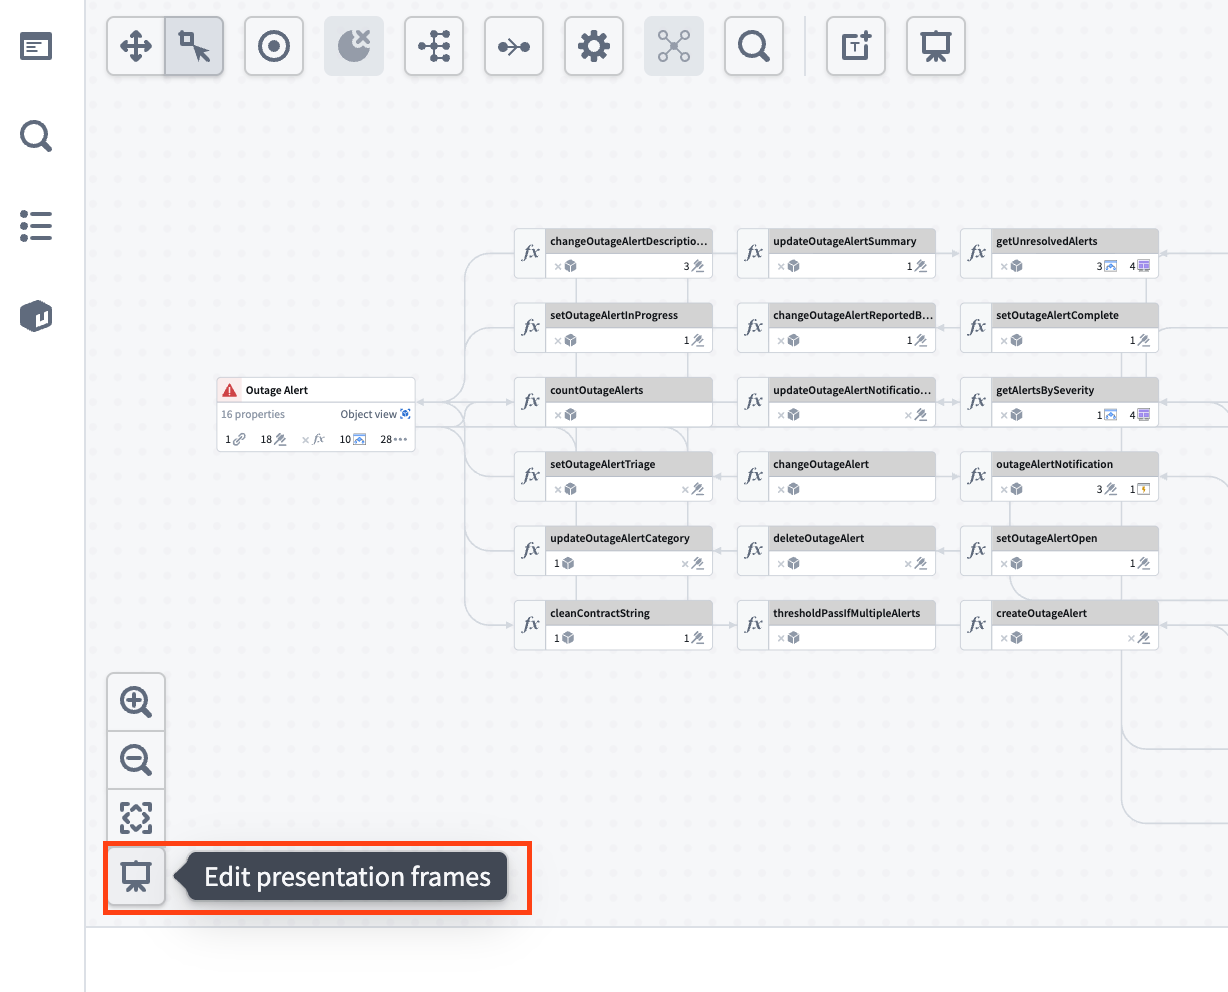
You must save your graph before you can use the presentation tool.
To create a frame, adjust your graph to capture the desired configuration. This can include the arrangement of nodes, node colors, color mode, and zoom level. Once you are satisfied with the current view, select Save state as new frame.
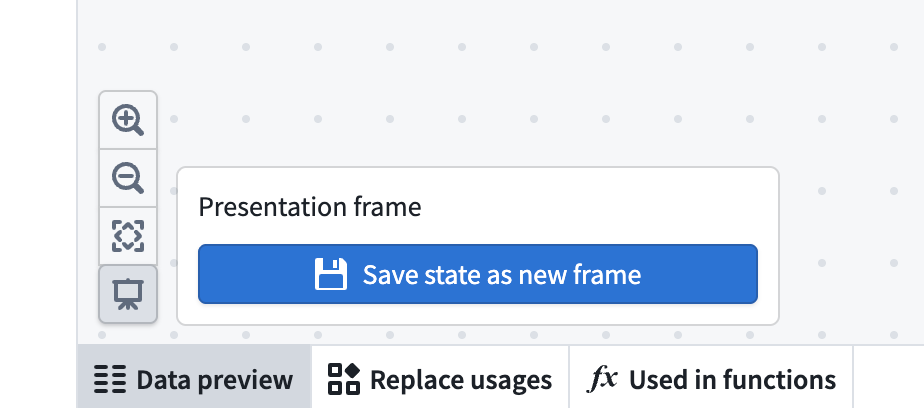
Workflow Lineage gives each frame a default name, such as Frame (1) or Frame (2), based on the number of frames in your presentation. To rename a frame, select the pencil icon next to the frame name and enter a title.
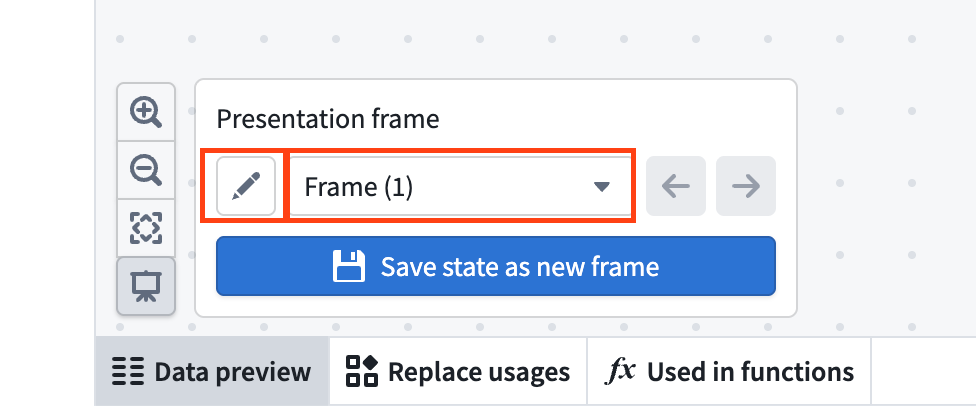
You can reorder frames by dragging them into your preferred sequence.
Reordering frames is not available when working on a branch.
You cannot edit the contents of an existing frame. To update a frame, adjust the graph, save the state as a new frame, and delete the old frame. To delete a frame, open the frame dropdown, hover over the frame, then select the red trash icon.
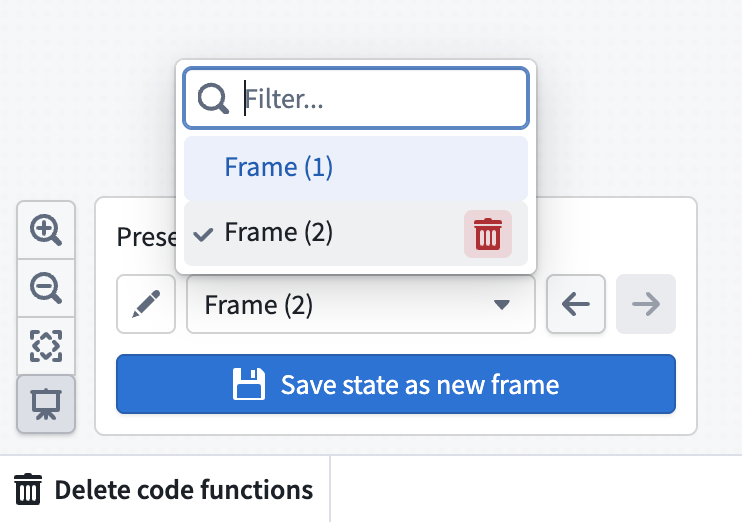
Presentation mode captures only the graph interface. Saved frames do not include the Workshop side panel or the bottom and left side panels. Use , and . to move backward and forward through your presentation frames.
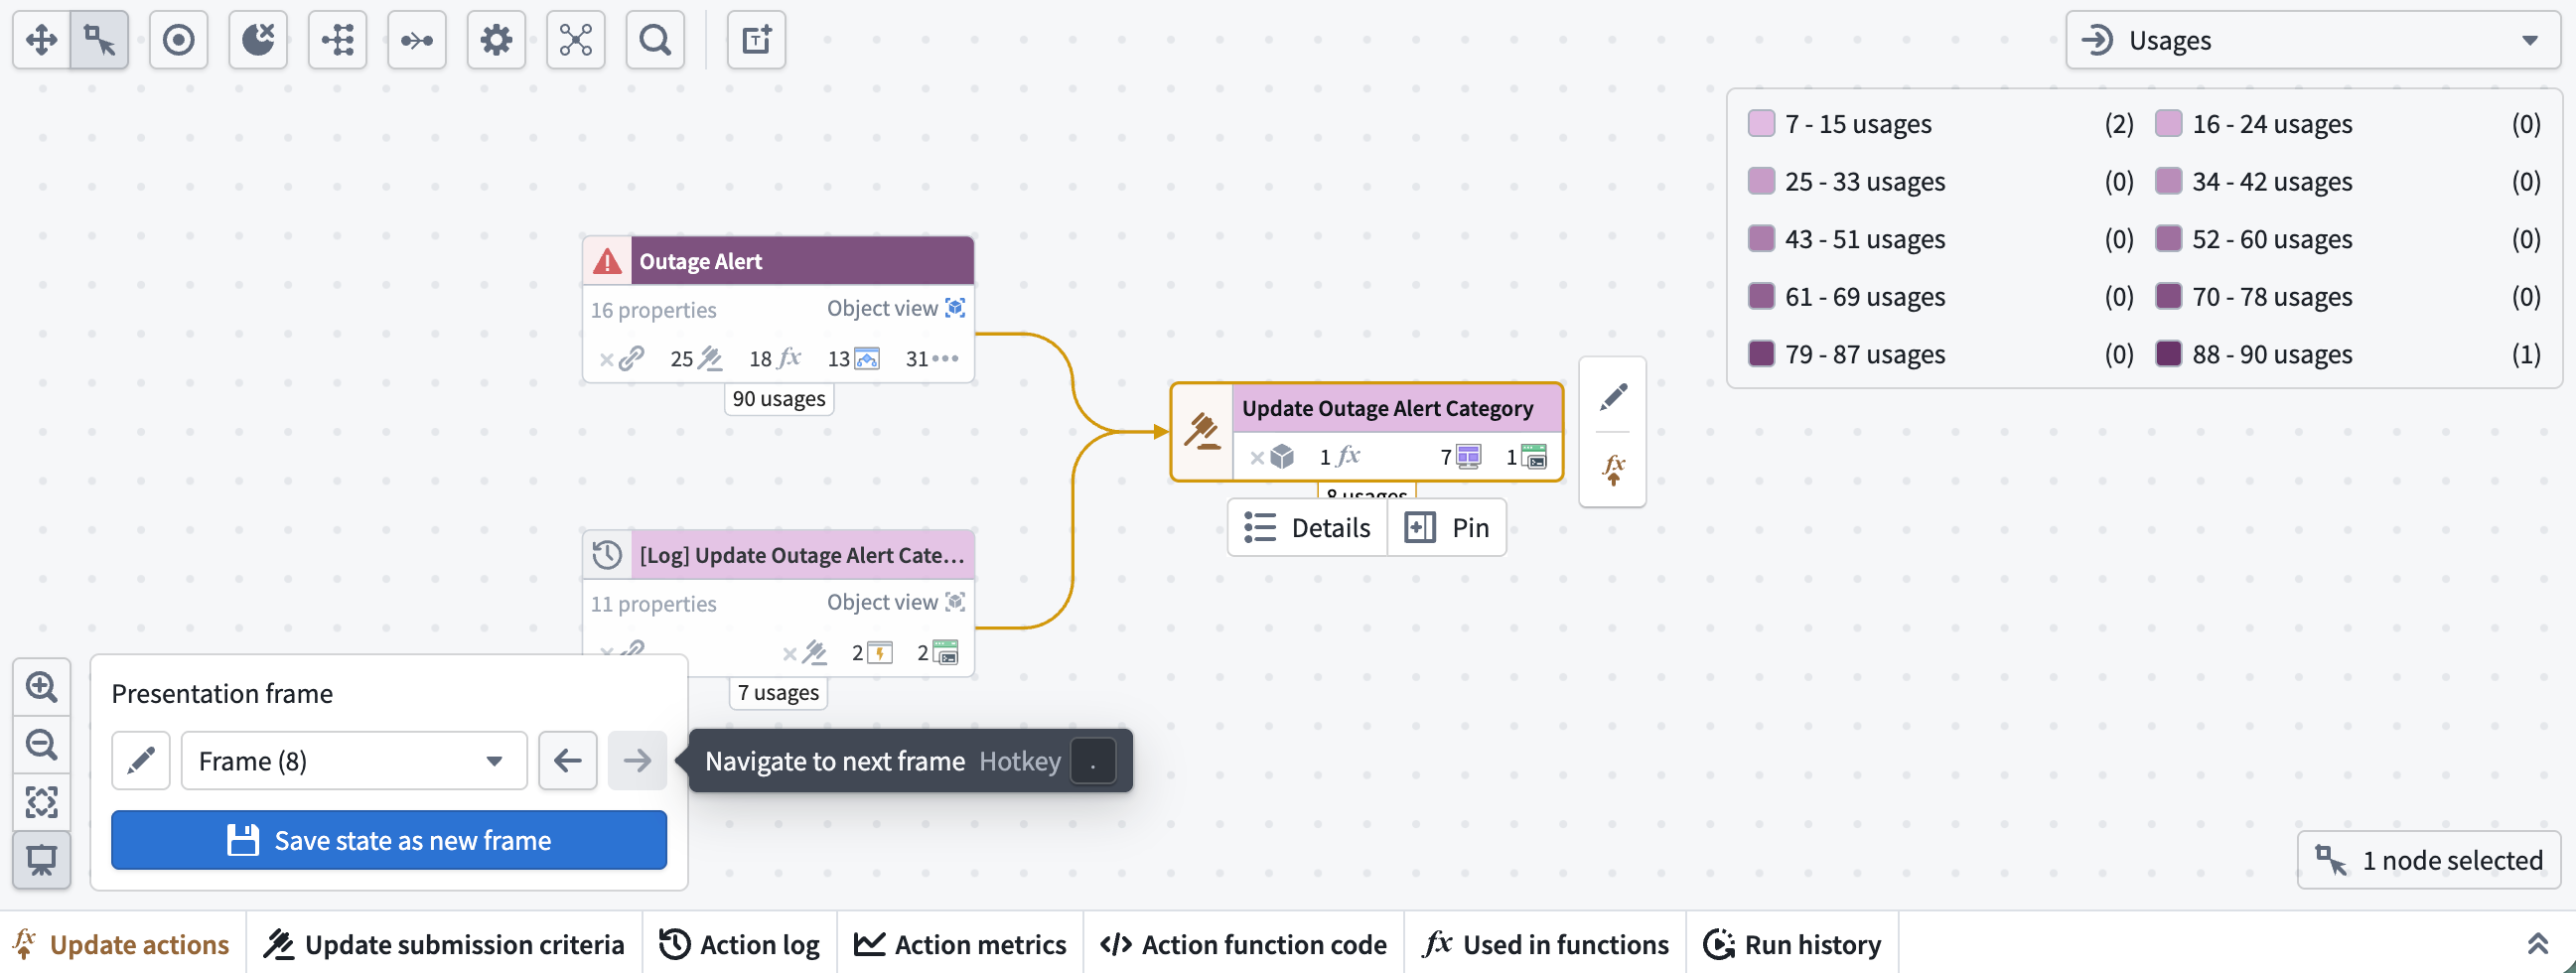
Consider using text nodes in your presentation frames to guide viewers through each step of your workflow with custom notes or explanations.