- Capabilities
- Getting started
- Architecture center
- Platform updates
AIP usage metrics and observability
To start using Workflow Lineage (previously known as Workflow Builder), open a Workshop application or functions repository and use the keyboard shortcut Cmd+I (macOS) or Ctrl+I (Windows) to view the relevant Workflow Lineage graph depicting the objects, actions, and functions that back the application.
AIP usage metrics
The following sections will help you understand the various AIP usage metrics viewable in Workflow Lineage.
Model usage coloring
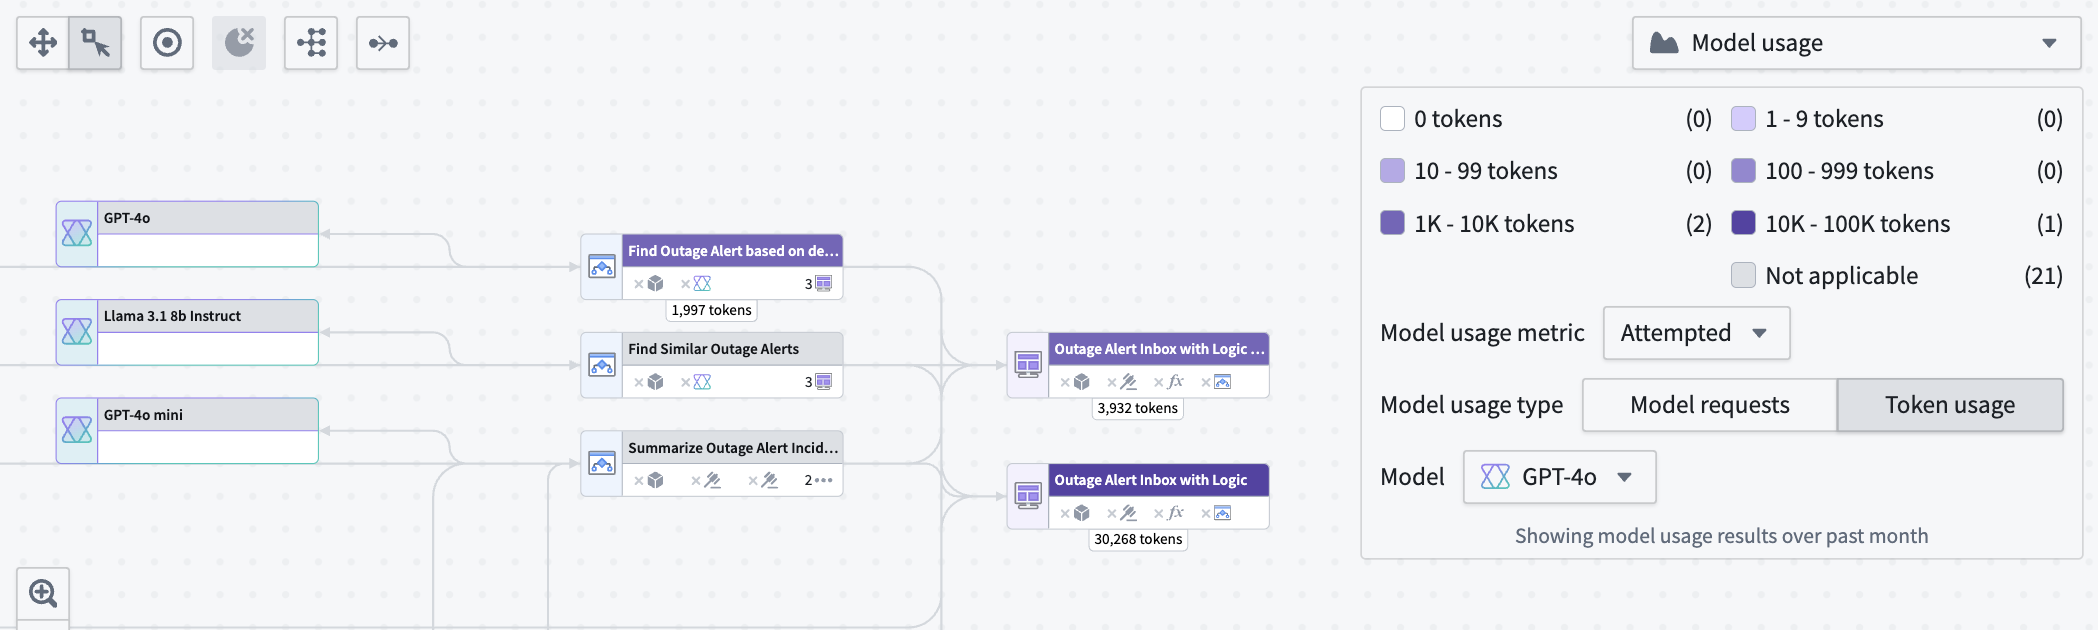
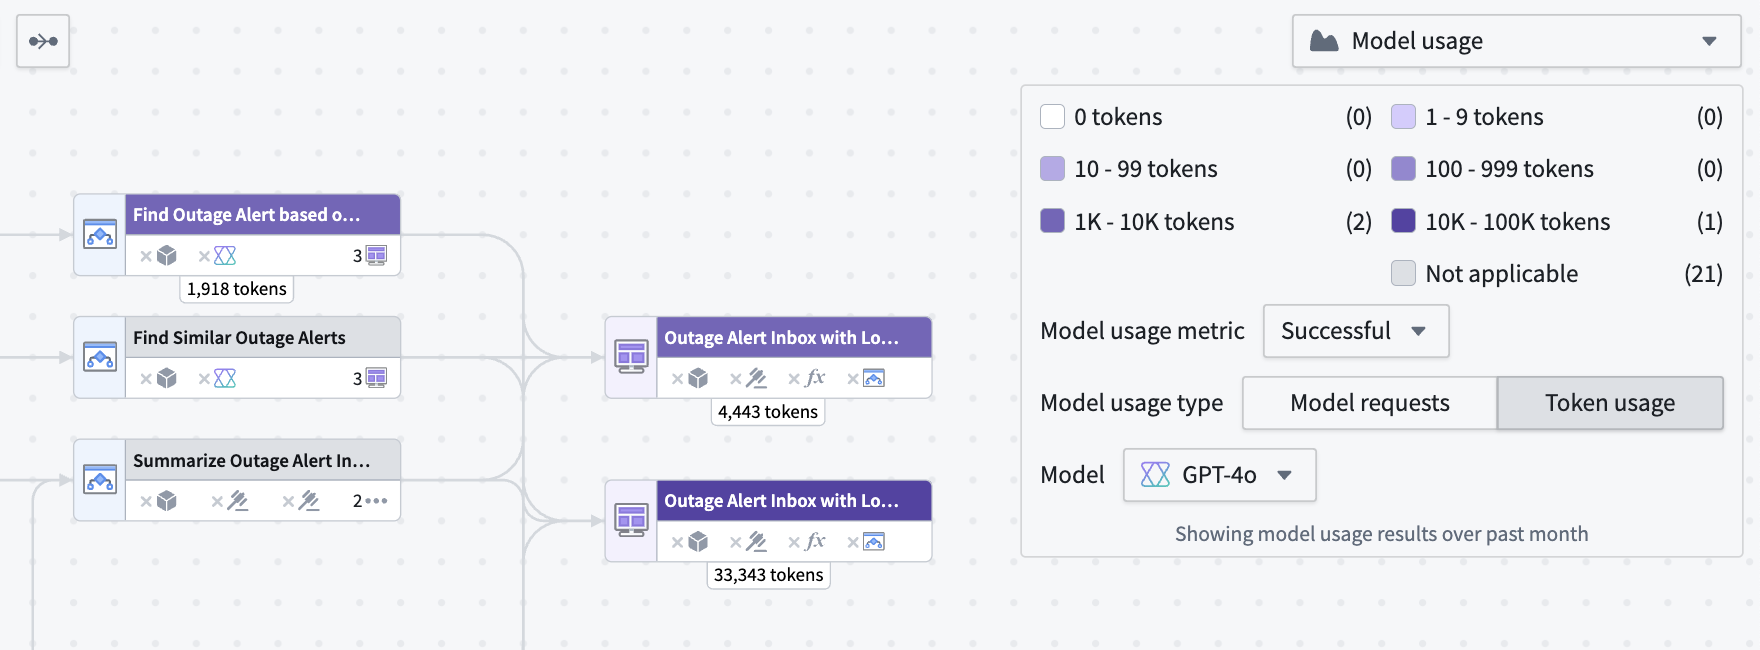
Workflow Lineage allows you to view model metrics for model requests and token usage. There are three types of model usage metrics:
- Successful: Total successful model requests or tokens used in attempts made by the specified model.
- Attempted: Total attempts made by the model, including successful and rate-limited attempts.
- Rate-limited: Total rate-limited attempts made.
Under Model usage, specify whether you want to view Model requests or Token usage metrics.
Model requests shows the total number of specified requests on model nodes in your Workflow Lineage.

Token usage shows the number of tokens used for Workshop applications, Automations, or third-party OSDK applications. Token counts on Logic nodes are the token counts used in the Logic application debugger.
Model usage charts
You can view the token usage or model requests over time for Workshop applications, Automations, and third-party applications (Ontology SDK applications) in a line chart by selecting the nodes and opening the Model usage charts panel at the bottom.
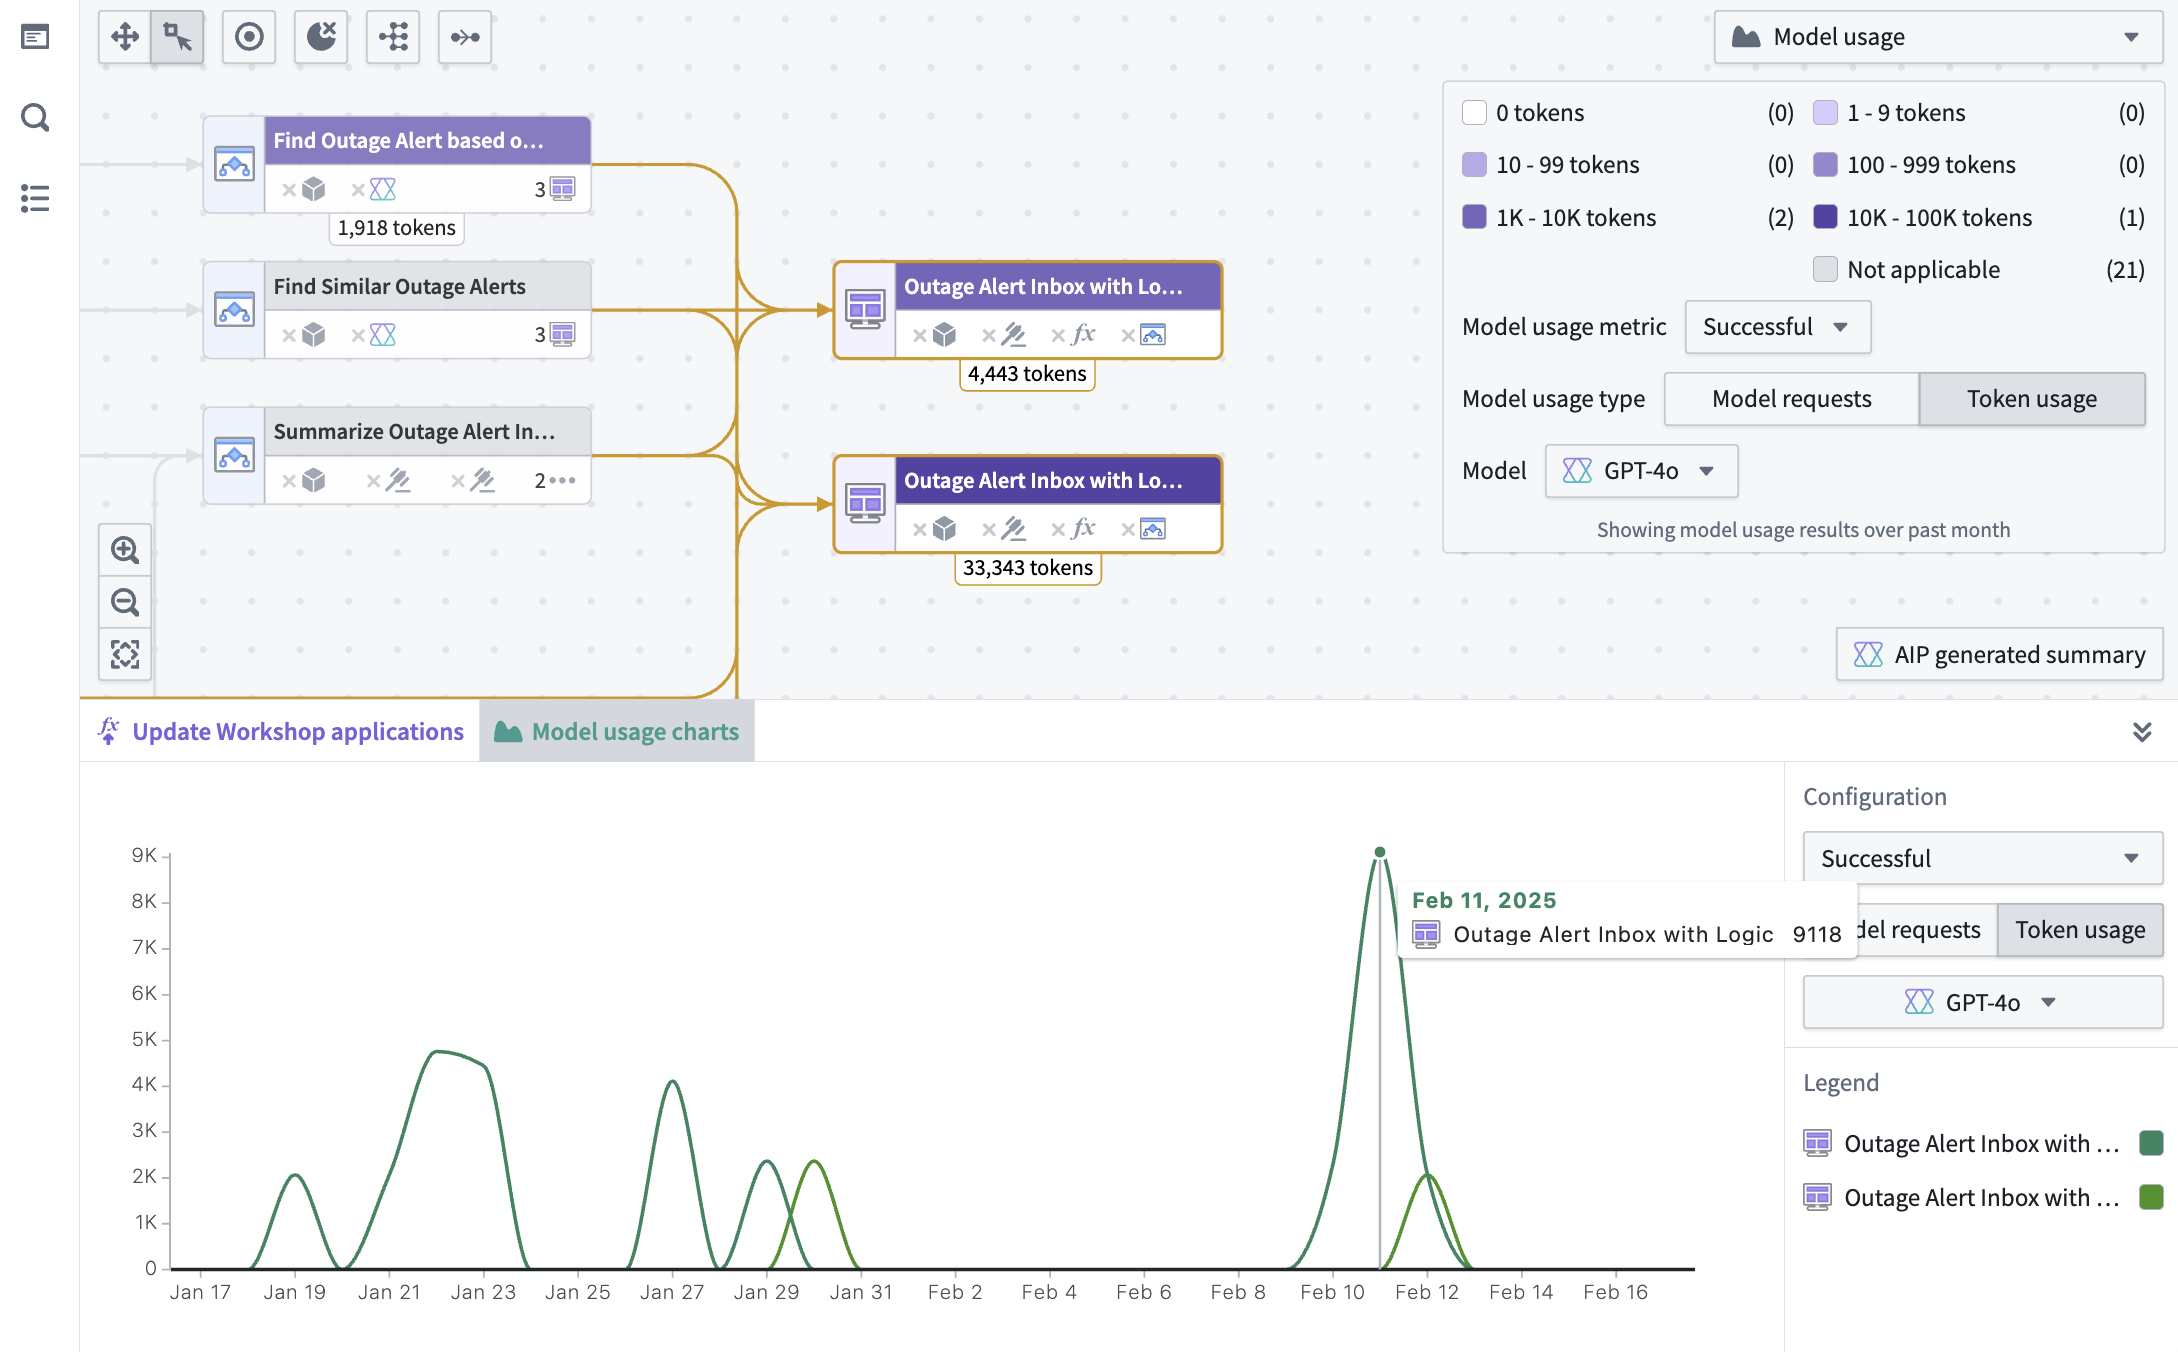
To view the specific value for a particular resource, hover over the graph itself. The same filters that are used in the color legend explained above also appear in the charts panel.
Function metrics
Select a Logic function node, then open Function metrics at the bottom of the screen to view:
- Executions: Successful and failed execution counts over time.
- P95 duration: The rolling 95th percentile of execution duration, weighted toward recent executions.
Workshop weekly usage metrics
Select Workshop nodes on the graph, then open Weekly views in the bottom panel to view total or unique views for the selected Workshop modules.
The panel displays each Workshop module by week in a clustered bar chart for the past four weeks.
Ontology and AIP observability
Workflow Lineage provides observability features to help you monitor and debug your AIP workflows. You can track execution history, visualize distributed traces, access detailed logs, and analyze performance metrics for your functions, actions, language models, and automations.