- Capabilities
- Getting started
- Architecture center
- Platform updates
Free-form Analysis
The Free-form Analysis widget enables users to independently investigate object data with flexibility, within the framework of the Workshop application.
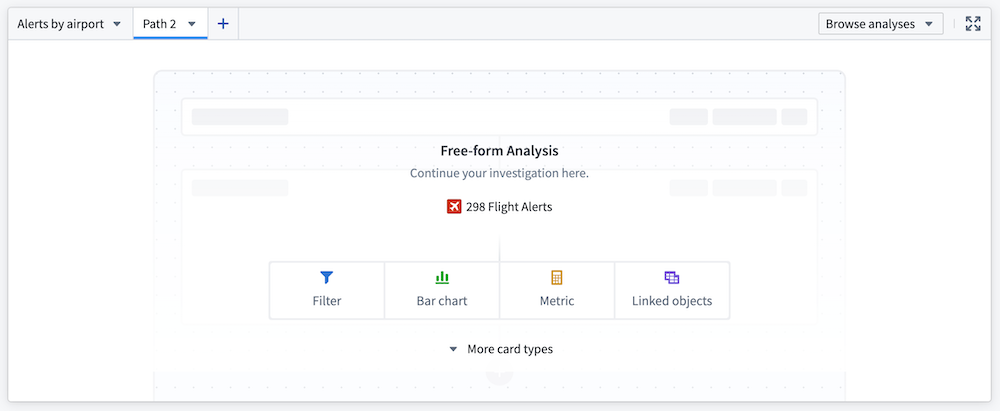
For investigating time series data specifically, see the Time Series Analysis widget, which provides specialized tools for time series visualization, derived plots, and analysis.
Available cards
Core display cards
- Metric card: Display numeric aggregations of an object set, including average, count, minimum, maximum, sum, and approximate unique count of a selected property.
- Text card: Add annotations to your analysis with a rich text editor card.
Object cards
- Filter object set: Take an input object set and return an object set based on logical conditions defined on both object properties and properties of linked objects.
- Linked objects: Expose relationships between object types and provide exploration into linked objects.
- Object selector: Select and pin a single object (for example, a particular alert within a
Flight Alertobject type).
Table cards
- Object table: Present an object set in a table, with select properties displayed as columns of a table.
- Pivot table: Display data aggregations from an object set in a table. Choose object properties to serve as row and column properties; the resulting data is organized into groups based on these object properties and aggregated according to the specified configuration.
Visualizations
- Bar chart: Create a horizontal or vertical bar plot of objects. Categories are defined by object properties, and values can be determined by object count (default) or average, maximum, minimum, or sum of a property value.
- Heat grid: Display a three-dimensional chart, illustrating two categorical dimensions and an aggregate dimension (count, average, sum, maximum, or minimum) by color.
- Line chart: Define categories based on object properties. Set values to object count (default) or average, maximum, minimum, or sum of a property value.
- Pie chart: Define categories based on object properties. Set values to object count (default) or average, maximum, minimum, sum of a property value.
- Waterfall plot: Display the running total (average, count, maximum, minimum, sum, or unique count) of one property as values (grouped by a second property) are added or subtracted.
Connect to other Palantir applications
- Open in Quiver: Perform more complex analyses in a Quiver analysis.
- Note: Selecting Open in Quiver creates a duplicate analysis; any changes in the Quiver analysis will not be reflected in the analysis path in the Workshop widget.
- Copy to Notepad: Allows users to copy cards to Notepad.
- Note: This functionality is only available for saved analyses.
Configuration options
- Input object set: The object set that serves as the base input to the analysis.
- Empty state header and description: Define how the widget is configured when there are no cards in a path.
- Enable path saving: Save and share analyses for future reference. Analyses can be saved as either Private or Public.
- Enable copy for Notepad (only available for saved analysis paths): Copy individual cards in a path to add to a Notepad. Cards can only be copied for Notepad if they are in a saved analysis path.
- Output object set: Save the output object set for reference elsewhere within the Workshop application.