- Capabilities
- Getting started
- Architecture center
- Platform updates
Function metrics
Function metrics display the near real-time usage of a function type over the last 30 days. You can access these metrics from a function type's overview page in Ontology Manager, or in Workflow Lineage by selecting the function node for a given execution. The following metrics are available:
- Success/failure metrics: Monitor the current status of your functions with success and failure counts. This enables rapid identification of issues and supports proactive troubleshooting, allowing you to address failures as soon as they occur.
- P95 duration metric: Track the 95th percentile (P95) execution duration for each function type. This metric highlights the upper range of execution times, helping you detect performance bottlenecks and optimize workflows for consistent and efficient operation.
You are also able to access run history, which provides a complete view of a given function's executions over the past seven days. Learn more about Ontology and AIP observability.
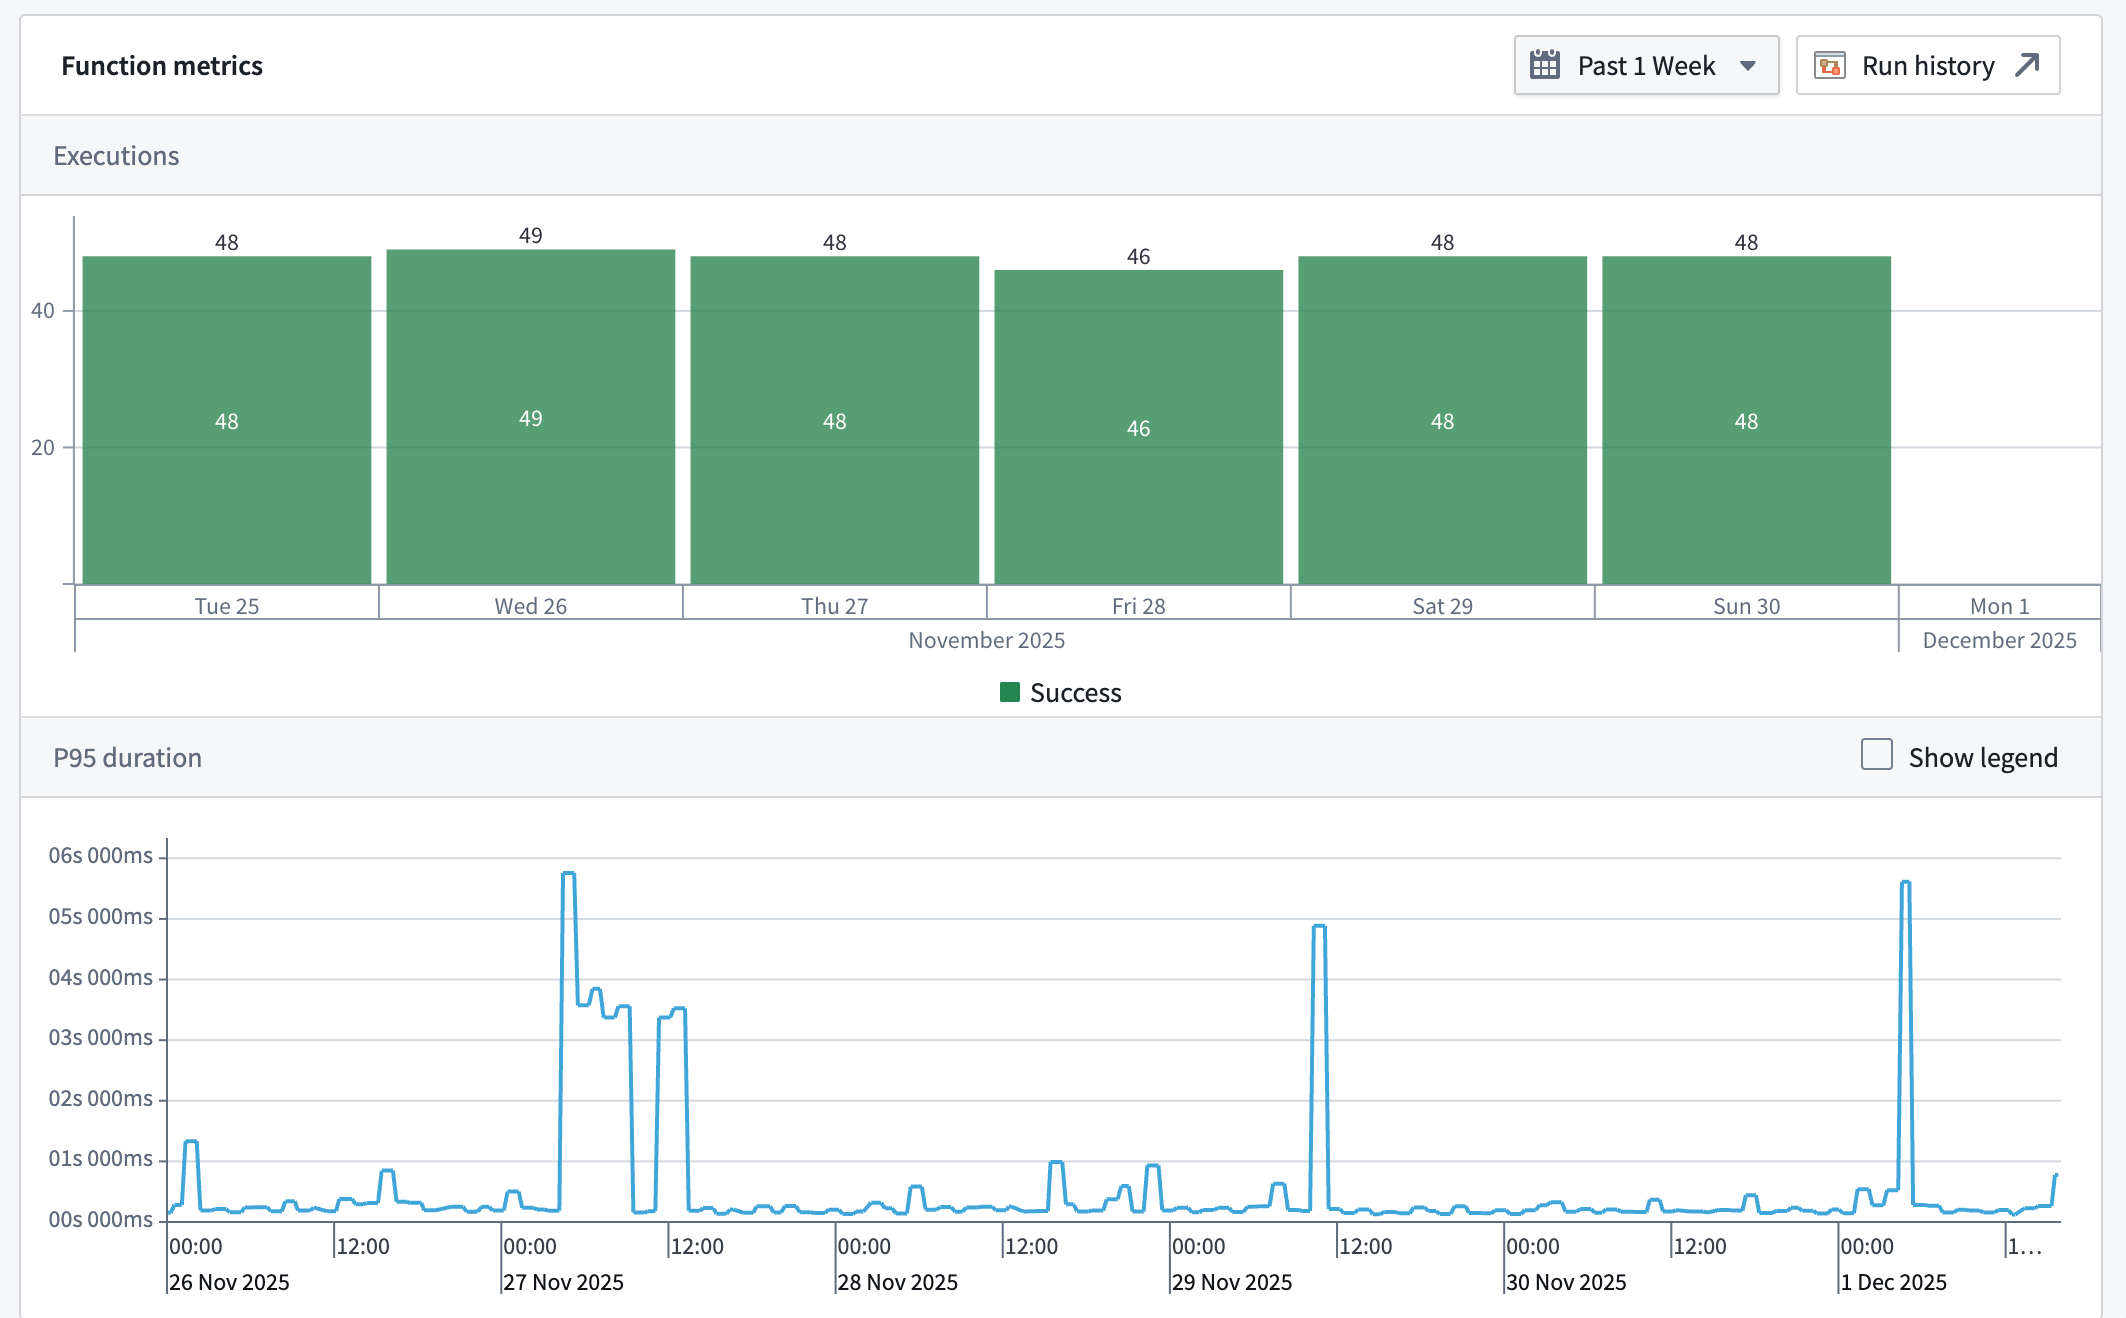
All metrics are updated in near real-time using the latest data from the Foundry Telemetry Service (FTS). This ensures you have access to the most current information for monitoring, debugging, and maintaining the health of your functions.
You can also embed function metrics directly inside an operational application using the Observability Chart widget in Workshop to monitor resource health alongside the rest of a workflow.
Function failure types
Function metrics have a variety of categories of failures that may be displayed. These categories are:
- Runtime failure: An unexpected error occurred while executing the function, often due to a bug or unhandled situation in the function's code.
- Resource limit exceeded: The function affected more than the permitted limit of object types (by default, usually 10,000).
- User facing error: An error occurred that is specifically intended to be shown to the user, often providing guidance on what went wrong or how to fix it.
- Invalid inputs error: One or more of the inputs provided to the function were not valid or did not meet the required criteria.
- Invalid output error: The function produced output that was not valid or did not conform to the expected format or rules.
- Data loading not allowed error: The function execution attempts to load data, including objects, object sets, users, or groups, but is not allowed to do so.
- Undeclared object types edited error: The function execution attempts to update, create or delete an object whose object type is not declared in the function spec.
- Structured error: The function execution encounters a structured error as defined on its spec.
- Deployment error: The function execution failed due to an error with the function's deployment.
- Consistent snapshot error: The function failed to execute due to a consistent snapshot error.
Set up monitoring alerts
You can also configure monitoring rules to receive alerts when performance degrades or failures occur. Function monitoring supports alerts for P95 function duration and the number of function failures within a time window. For configuration instructions, see Monitor functions.
Permissions
To view function metrics, you must be a viewer on the function.