Join data
In addition to transforming single datasets, Pipeline Builder allows you to bring datasets together with joins and unions.
A join combines two datasets that have at least one matching column. Depending on the type of join you configure, your join output can combine matching rows and exclude non-matching rows.
Select datasets
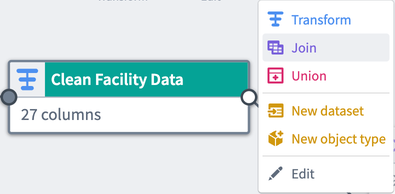
To join two datasets together, select the first dataset node in your graph and click Join.
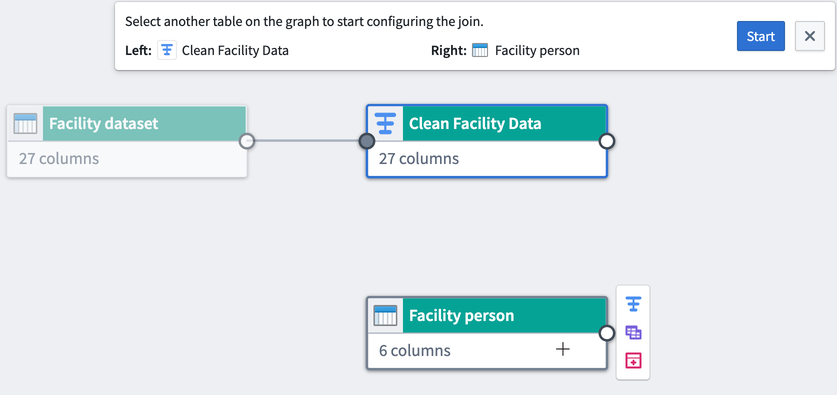
The first selected dataset is the Left side dataset. Select another dataset node to be the Right side dataset. Click Start to configure the join.
Configure a join
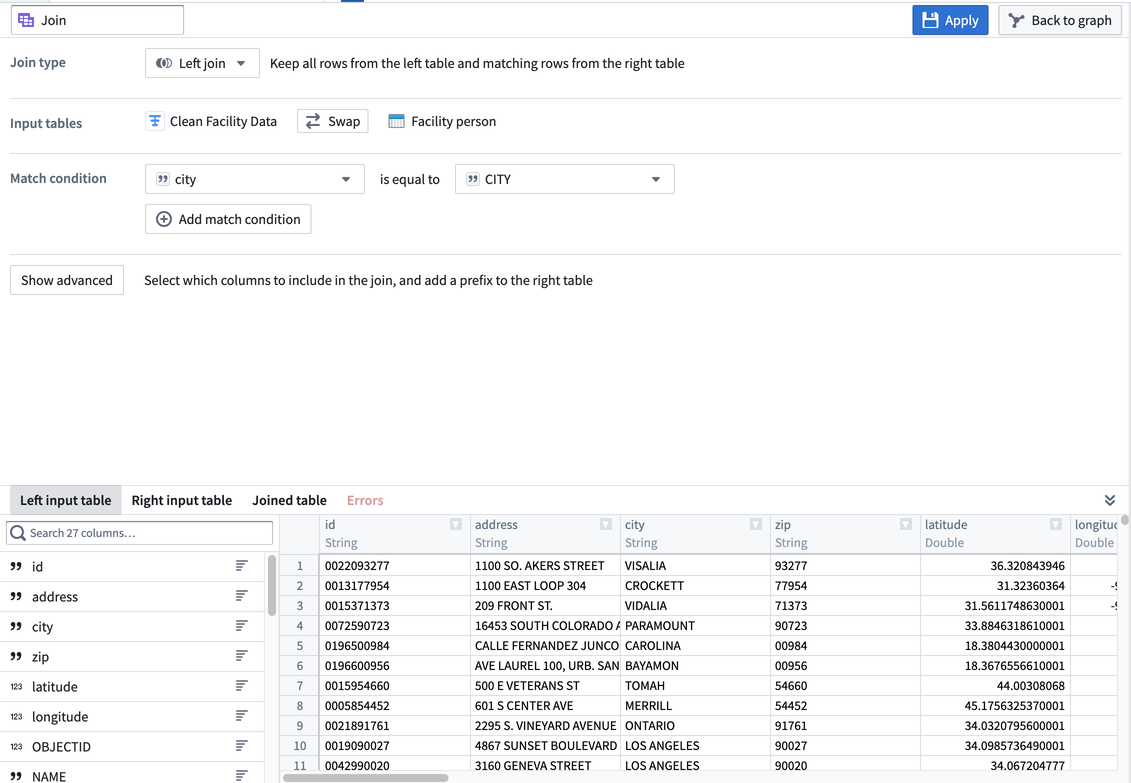
In the join form, you can edit the join type, select match conditions, and preview the output table.
- Join type: Choose whether to create a left, right, inner, or outer join.
- Left: Keep all rows from the left table and matching rows from the right table.
- Right: Keep all rows from the right table and matching rows from the left table.
- Inner: Only keep matching rows between both tables.
- Outer: Keep all rows from both tables, with
nullfilled in columns for non-matching rows.
- Match condition: Select a column from the left dataset to mark it as equal to a column from the right dataset. For example, the
citycolumn in the leftClean Facility Datadataset is equal to theCITYcolumn in the rightFacility Persondataset. - Preview: View preview data from both the right and left input datasets. After applying a join, view preview data from the output table. If any errors occur while applying a join, view them in the Errors tab.
All data in the above and following examples was randomly generated and is non-representational.
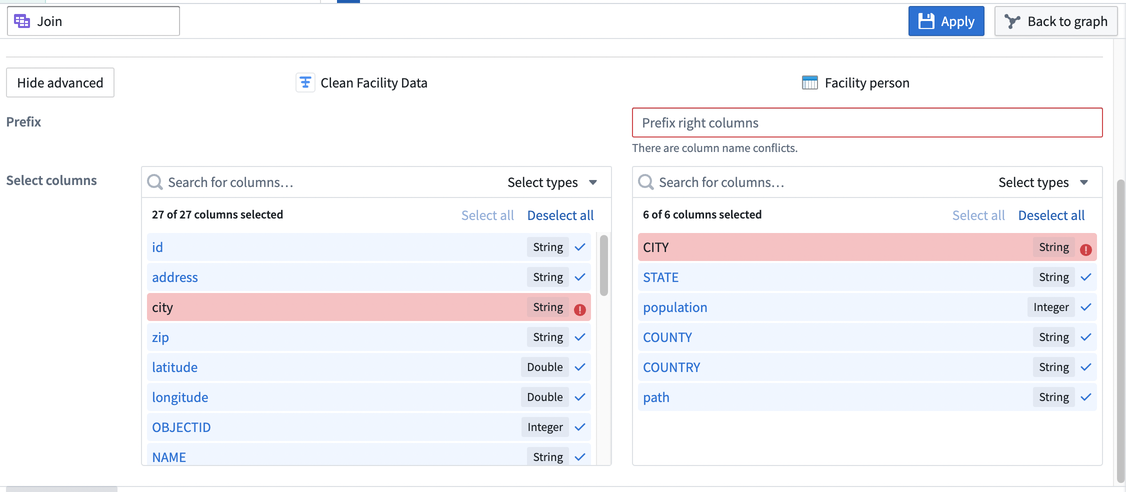
You can decide to include specific columns in the join and add a prefix to the right table. Select Show advanced to expand the prefix and column fields, enter a prefix for the right table, and select the columns to include in the join. In the example below, we are keeping all columns from the left dataset and only including the STATE and population columns from the right dataset.
Apply a join
Once you finish configuring your join, click Apply to add the join to your workflow. You will see the join node connected to the two joined datasets in your graph. We named our new join Join person data, and it is a direct output of the original Clean Facility Data and Facility person datasets.
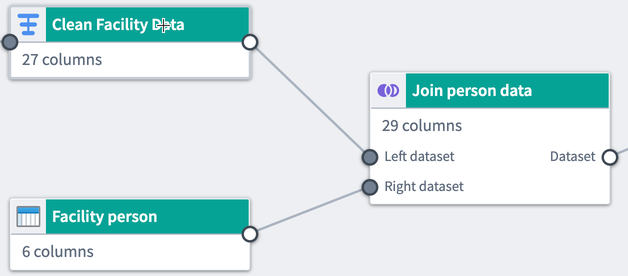
Rename or edit the join by clicking the join node and selecting Edit.
Drag the white or gray circles on nodes to change connections and remove links on the graph.