- Capabilities
- Getting started
- Architecture center
- Platform updates
Navigation
This page describes Pipeline Builder's interface, navigational controls, and available tools.
Users can access three different views in Pipeline Builder from the top toolbar: Edit, Proposals, and History.
Edit
The Edit view is where you can start building your pipeline workflow. It is separated into four sections: the top toolbar, details sidebar, graph, and preview pane.
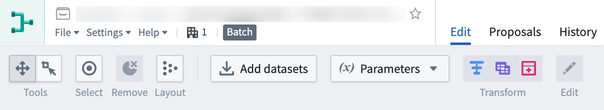
Top toolbar
The top toolbar allows you to manage your views, monitor build check status, and edit build settings.
- Undo/Redo: Undo or redo a recent action in your workflow.
- Branch dropdown: View the name of the branch in which you are currently working, or switch to another branch. You can also choose to Create new branch. Learn more about branches.
- Save: Save your progress. A filled Saved state appears when your changes are saved to your branch.
Changes to a pipeline branch are not auto-saved. To properly save changes to your pipeline branch, you must manually save your changes before navigating away from the graph tab.
-
Propose: Once your changes are saved, select Propose to request a merge into the main branch. Merges from the main branch are not supported.
-
Deploy: After the pipeline passes validation checks, select Deploy to build your pipeline outputs.
-
Build settings: Change the compute profile of your build.
- Default: The default auto scaling profile which uses the least amount of executor cores and memory.
- Medium: A slow scale up and quick scale down compute.
- Large: A slow scale up and quick scale down compute. Builds with larger profiles may complete faster but incur a higher compute cost.
-
Builds and checks status: View the status of build syncs and check passes and failures.
-
Share: Open the details sidebar to access sharing options for your pipeline.

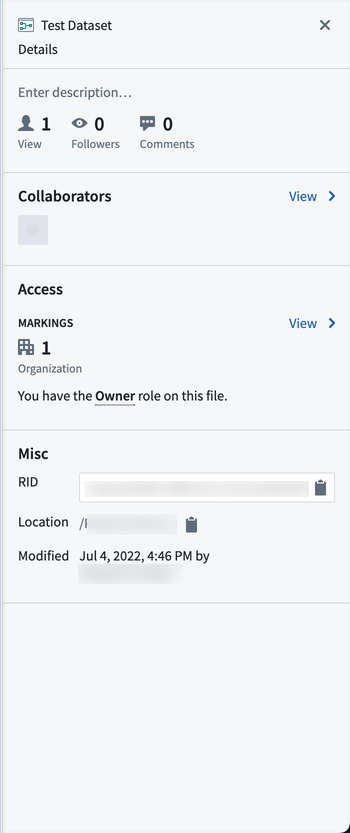
Details sidebar
The details sidebar allows you to view metadata, access requirements, and roles for your pipeline. Click on the icon in the upper right corner to expand and collapse the sidebar.
-
Description: Write or edit a description of your pipeline.
-
Views: The total number of times your pipeline was viewed in the last 30 days.
-
Followers: The total number of users following your pipeline workflow progress. Click on this option to follow the pipeline you are currently viewing.
-
Comments: The total number of comments made on your pipeline workflow. Click on this option to post a comment.
-
Collaborators: The users collaborating on the pipeline. Click View to see when users were added as workflow collaborators.
-
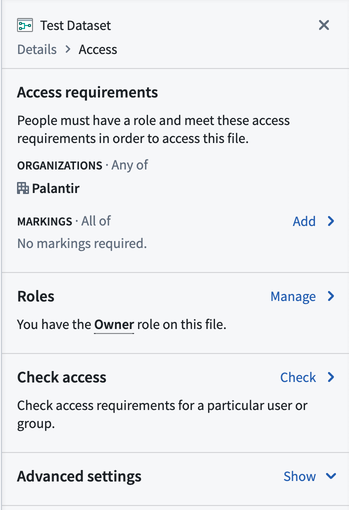
Access: Shows the organization(s) in which the pipeline belongs and the role you have on the pipeline file. Click View to view and manage access settings.
-
Access requirements: Displays the organization and Markings requirements needed to access the pipeline.
- Organizations: The organization(s) to which a user must belong to access the pipeline.
- Markings: The Markings to which a user must have access to access the pipeline.
- Add: Opens a pane to search for and add Markings requirements to the pipeline workflow.
-
Roles: Shows the role you have on the pipeline.
- Manage: Opens a pane to manage roles and share the pipeline workflow.
- Link sharing: Toggle to turn on link sharing and grant roles to users who access the pipeline via a shareable link.
- Add a user or group: Search for a user or group to grant them access roles on the pipeline workflow.
- Manage: Opens a pane to manage roles and share the pipeline workflow.
-
Check access: Check access requirements for a particular user or group.
- Check: Opens a pane to search for and check access for a user or group.
- Check access: Use the search field to find a user or group.
- Select a user or group: Check whether users meet access requirements, and view their assigned role on the pipeline workflow.
- Select a user or group: Check whether users meet access requirements, and view their assigned role on the pipeline workflow.
- Check access: Use the search field to find a user or group.
- Check: Opens a pane to search for and check access for a user or group.
-
-
Misc: Shows additional metadata for the pipeline.
- Location: The location of the pipeline in the Foundry file structure.
- Modified: The date and time the pipeline was last modified.
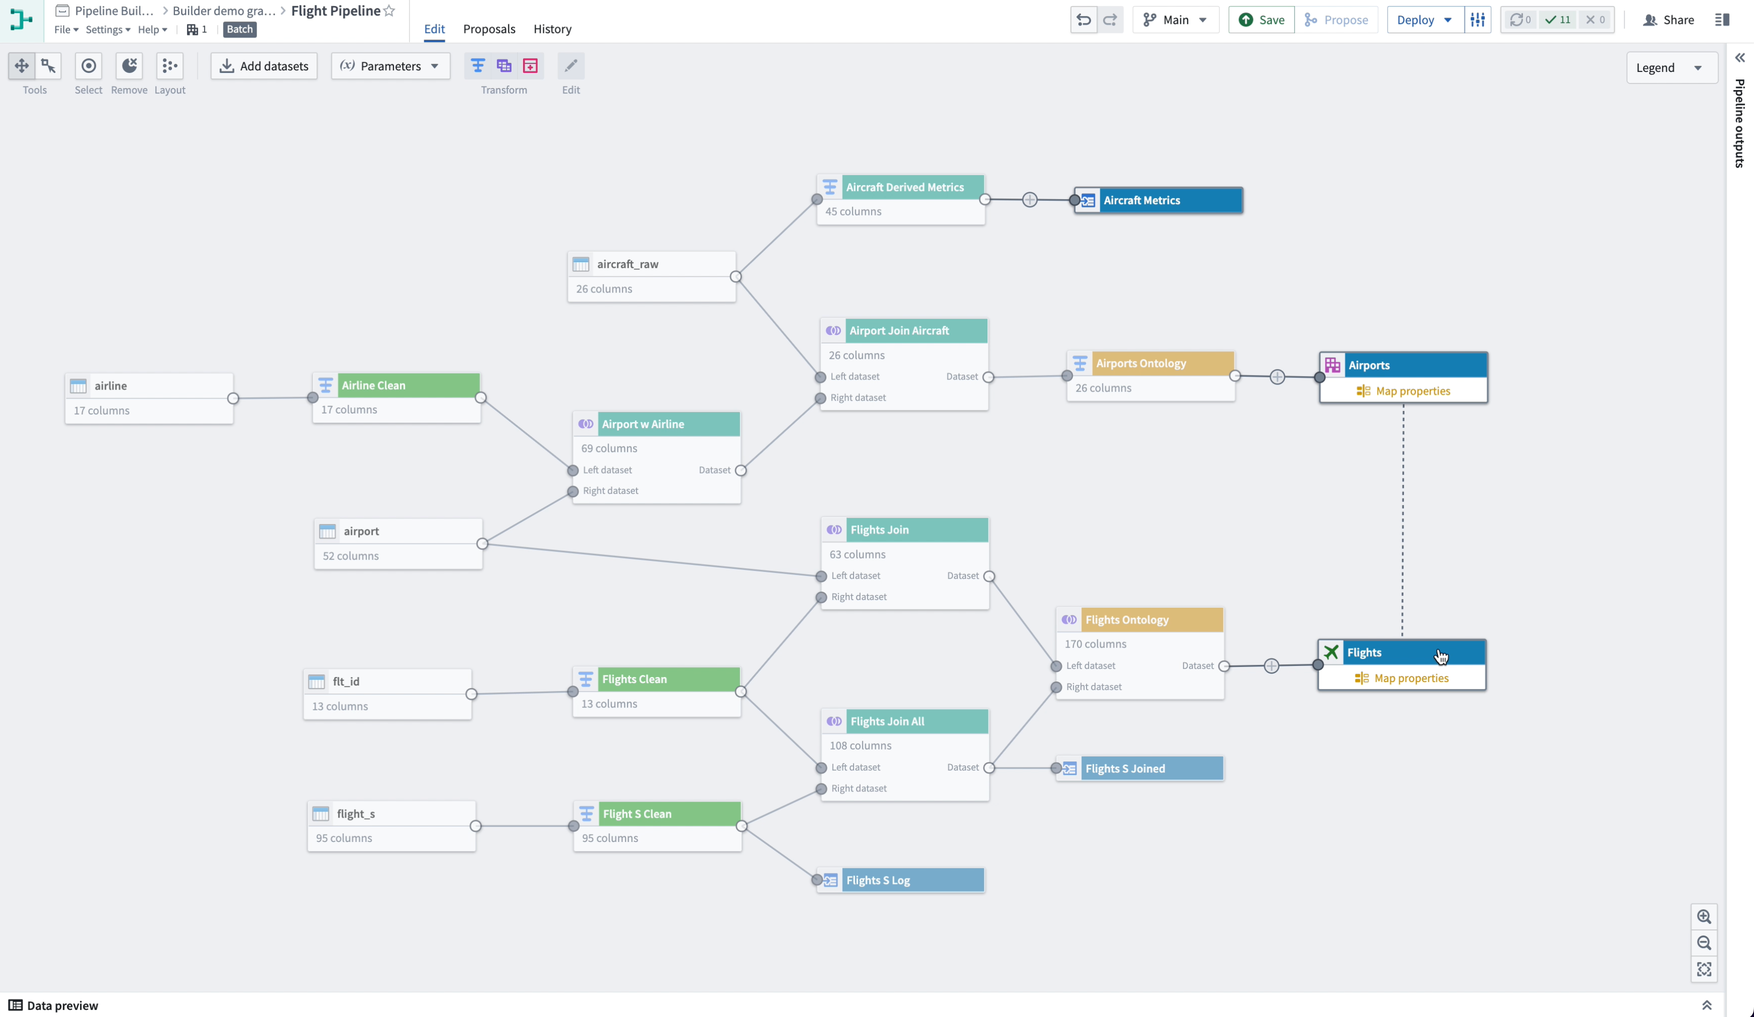
Graph
The graph is where users add data, create parameters, and describe transforms. It is the primary view of the Pipeline Builder app.
-
Panning Mode: Allows click and drag navigation around the graph.
-
Drag Select Mode: Click and drag across the graph to select multiple nodes. To quickly switch to this mode from panning mode, hold down
shiftwhile clicking and dragging across nodes. -
Select: Select all nodes in the graph.
-
Remove: Removes selected nodes in the graph from the pipeline.
-
Layout: Evenly disperse and organize the nodes in your graph.
-
Add datasets: Open a window to search for and add datasets to your graph.
-
Parameters: Configure and add reusable transform parameters.
- Add parameter: Name a new parameter and assign its value.
-
Transform: Select dataset nodes in your graph to transform, join, or union. Selecting a dataset on the graph also opens a pop-up menu allowing you to add or edit a transform.
-
Edit: Select a transform node in your graph to edit transform settings.

-
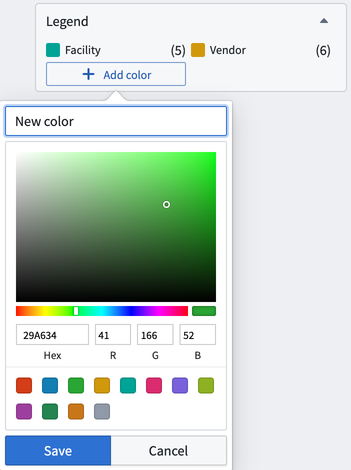
Legend: Show color indicators applied to datasets and transforms.
- Add color: Select a new color from the color picker to assign to nodes in your graph.
- Add color: Select a new color from the color picker to assign to nodes in your graph.
-
Outputs sidebar: In the sidebar, view build requirements of your pipeline datasets, edit schemas, and add outputs. Use the "expand" symbol on the far right side of the Builder graph to expand the outputs sidebar.
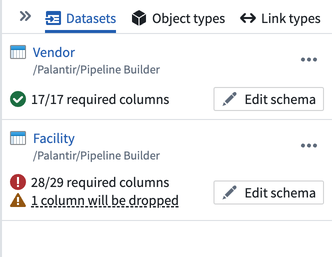
- Datasets: Show the dataset outputs described in your pipeline, health verifications, and any schema errors.
- Edit schema: Identify schema errors, remove or add columns, and use input schema to resolve errors.
- Delete dataset output: Remove the selected dataset output from your pipeline.
- Add output: Create a new dataset output for your pipeline build.
- Object types: Show the object type outputs that guide your pipeline integration.
- Add output: Open a window to create a new object type output, generate an object type from a dataset schema, or add an existing object type.
- Link types: Show the link type outputs that guide your pipeline integration.
- Add output: Open a pane to create an object link from two object types.
- Datasets: Show the dataset outputs described in your pipeline, health verifications, and any schema errors.
-
Zoom settings: Choose to zoom in, zoom out, or zoom to fit your graph.
-
Copying Nodes: You can copy and paste nodes between Pipeline Builder deployments and within the same resource using
Cmd + CandCmd + Von MacOS orCtrl + CandCtrl + Von Windows. This can be used to duplicate parts of the pipeline or pipelines as a whole.
Preview panel
The preview panel allows you to view a sample set of data from a single selected node. Select the icon in the lower left of the graph to expand or contract the preview panel.
- Name: Show the name for the selected node. You can edit the node name in this field.
- Search: Search for column names within the data.
You can also access the full dataset preview page by right-clicking on a dataset node and clicking Open.
Proposals
In the Proposal view, you can see any open, merged, or closed proposals for this pipeline. Choose a filter from the dropdown menu to see all proposals within the status category.
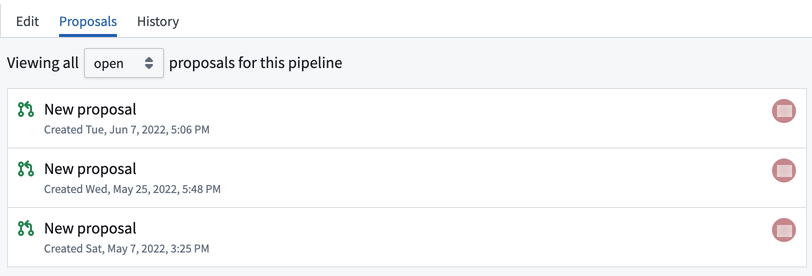
Each proposal will show a create date and time, the user who created it, and an icon denoting an open, merged, or closed status.
History
The History view allows you to see recent activity in any branch of your pipeline workflow. Select a branch from the dropdown to view its history.
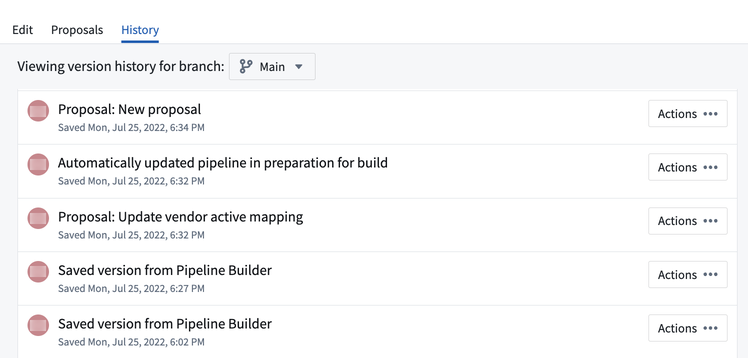
Click Actions to create a new branch, view details, or view changes made from each saved version.
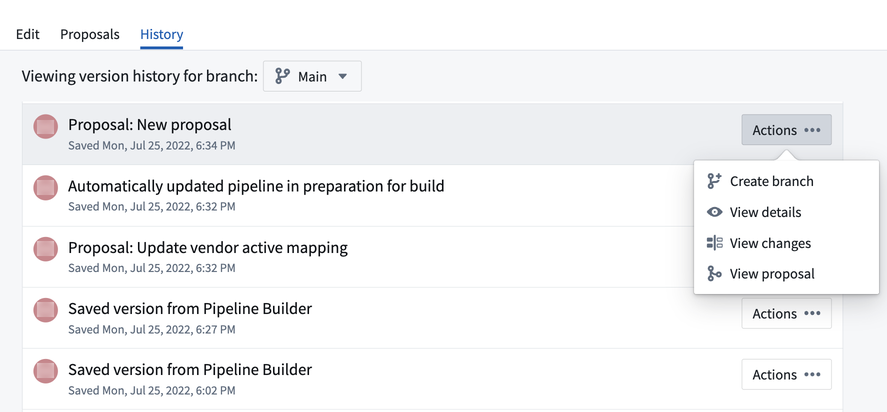
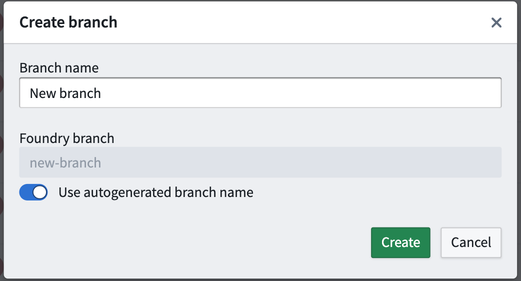
Create branch
This option allows to you to start a new branch based off the selected branch.
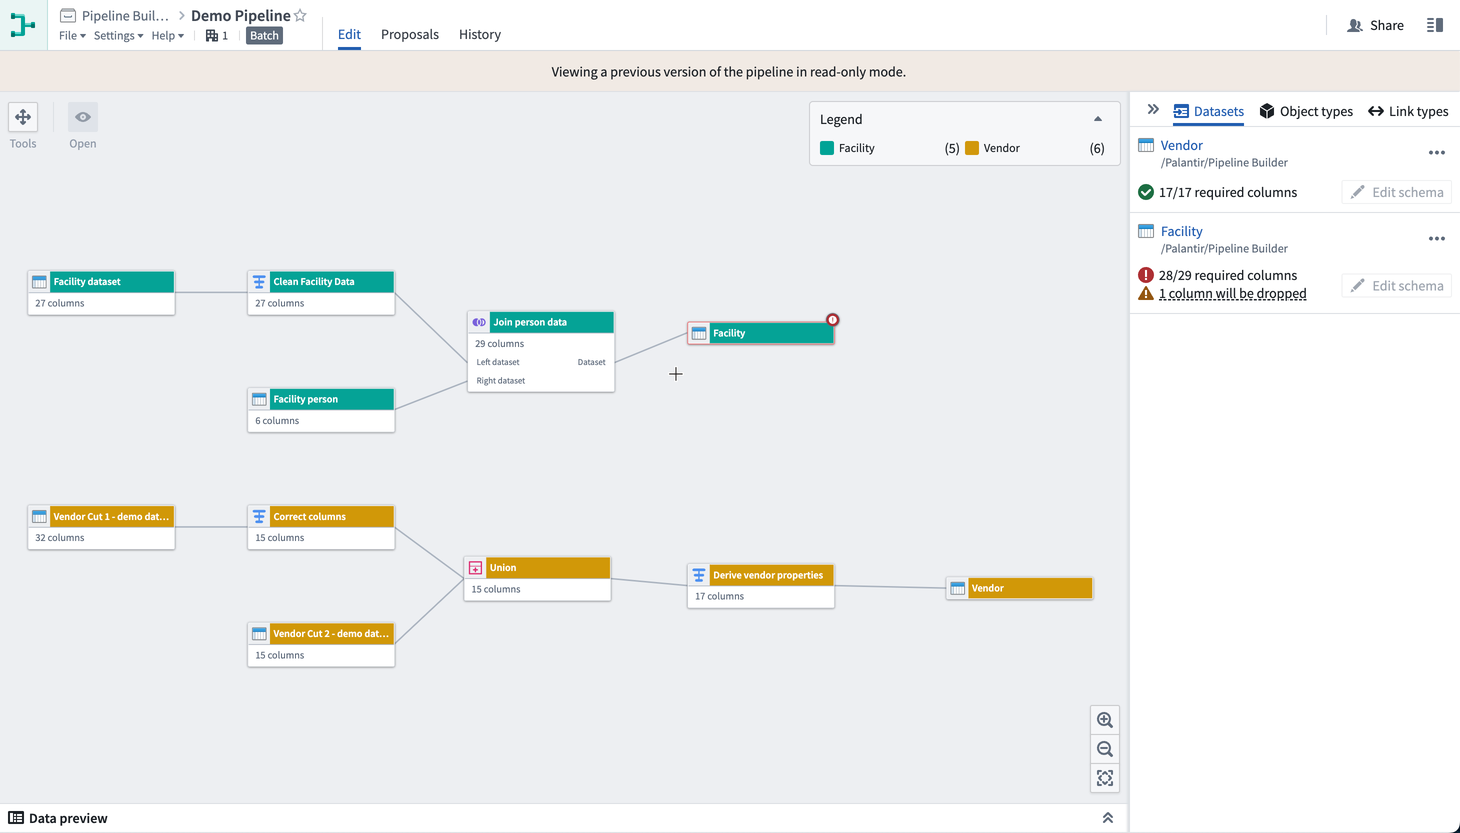
View details
The View details option opens a read-only version of the graph that shows the state of the pipeline at the time of the saved activity. This option is a useful way to track workflow development over time without risking a revert to earlier states of the pipeline.
View changes
Similar to the View details option, you can View changes to understand pipeline modifications at a given time. In this view, however, the graph shows a split view to represent the differences, or diffs, between the previous save and the applied changes.
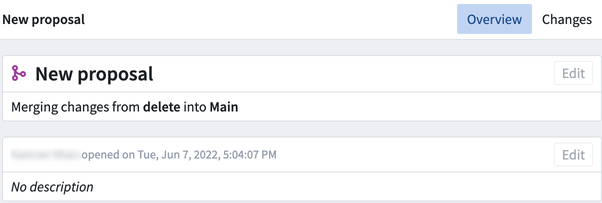
View proposal
Viewing a proposal allows builders to review and edit existing proposals.
Learn more about viewing pipeline changes.