- Capabilities
- Getting started
- Architecture center
- Platform updates
Source exploration
HyperAuto V1 is in the sunset phase of development and will be deprecated at a future date. Full support remains available. The creation of new V1 pipelines is discouraged, and users should migrate from HyperAuto V1 to V2 as detailed in the migration documentation.
Salesforce and Netsuite Sources will migrate to default Exploration in the near future and this page will be deprecated.
If you have a SDDI repository connected to your Salesforce or Netsuite source, the "raw" folder is now configured on the Source overview page. Ensure that the folder defined there matches your configuration in the corresponding SourceConfig-...-.yaml file of your SDDI repository.
Source exploration in HyperAuto V1 supports exploring external data systems within the Foundry interface before datasets are synced to Foundry. It is accessible by selecting Explore and create syncs on any HyperAuto connector in the Data Connection application.

With source exploration, you can:
- Easily find and discover raw datasets
- Search to find datasets
- Click through different categorization folders to peruse data
- Explore relations of raw datasets at source through a powerful interface
- Expand or hide related datasets
- View attributes of a dataset
- Preview a dataset, its schema and relations
- Intuitively create and configure dataset syncs
- Create and configure syncs via a point-and-click shopping cart experience
Interface Quick Start
- Lineage Graph
- Graph Tools
- Backing Pipeline Generator
- Dataset Shopping Cart and Sync Configuration
- Right Side Panel
- Dataset Preview
- Left Side Search Panel
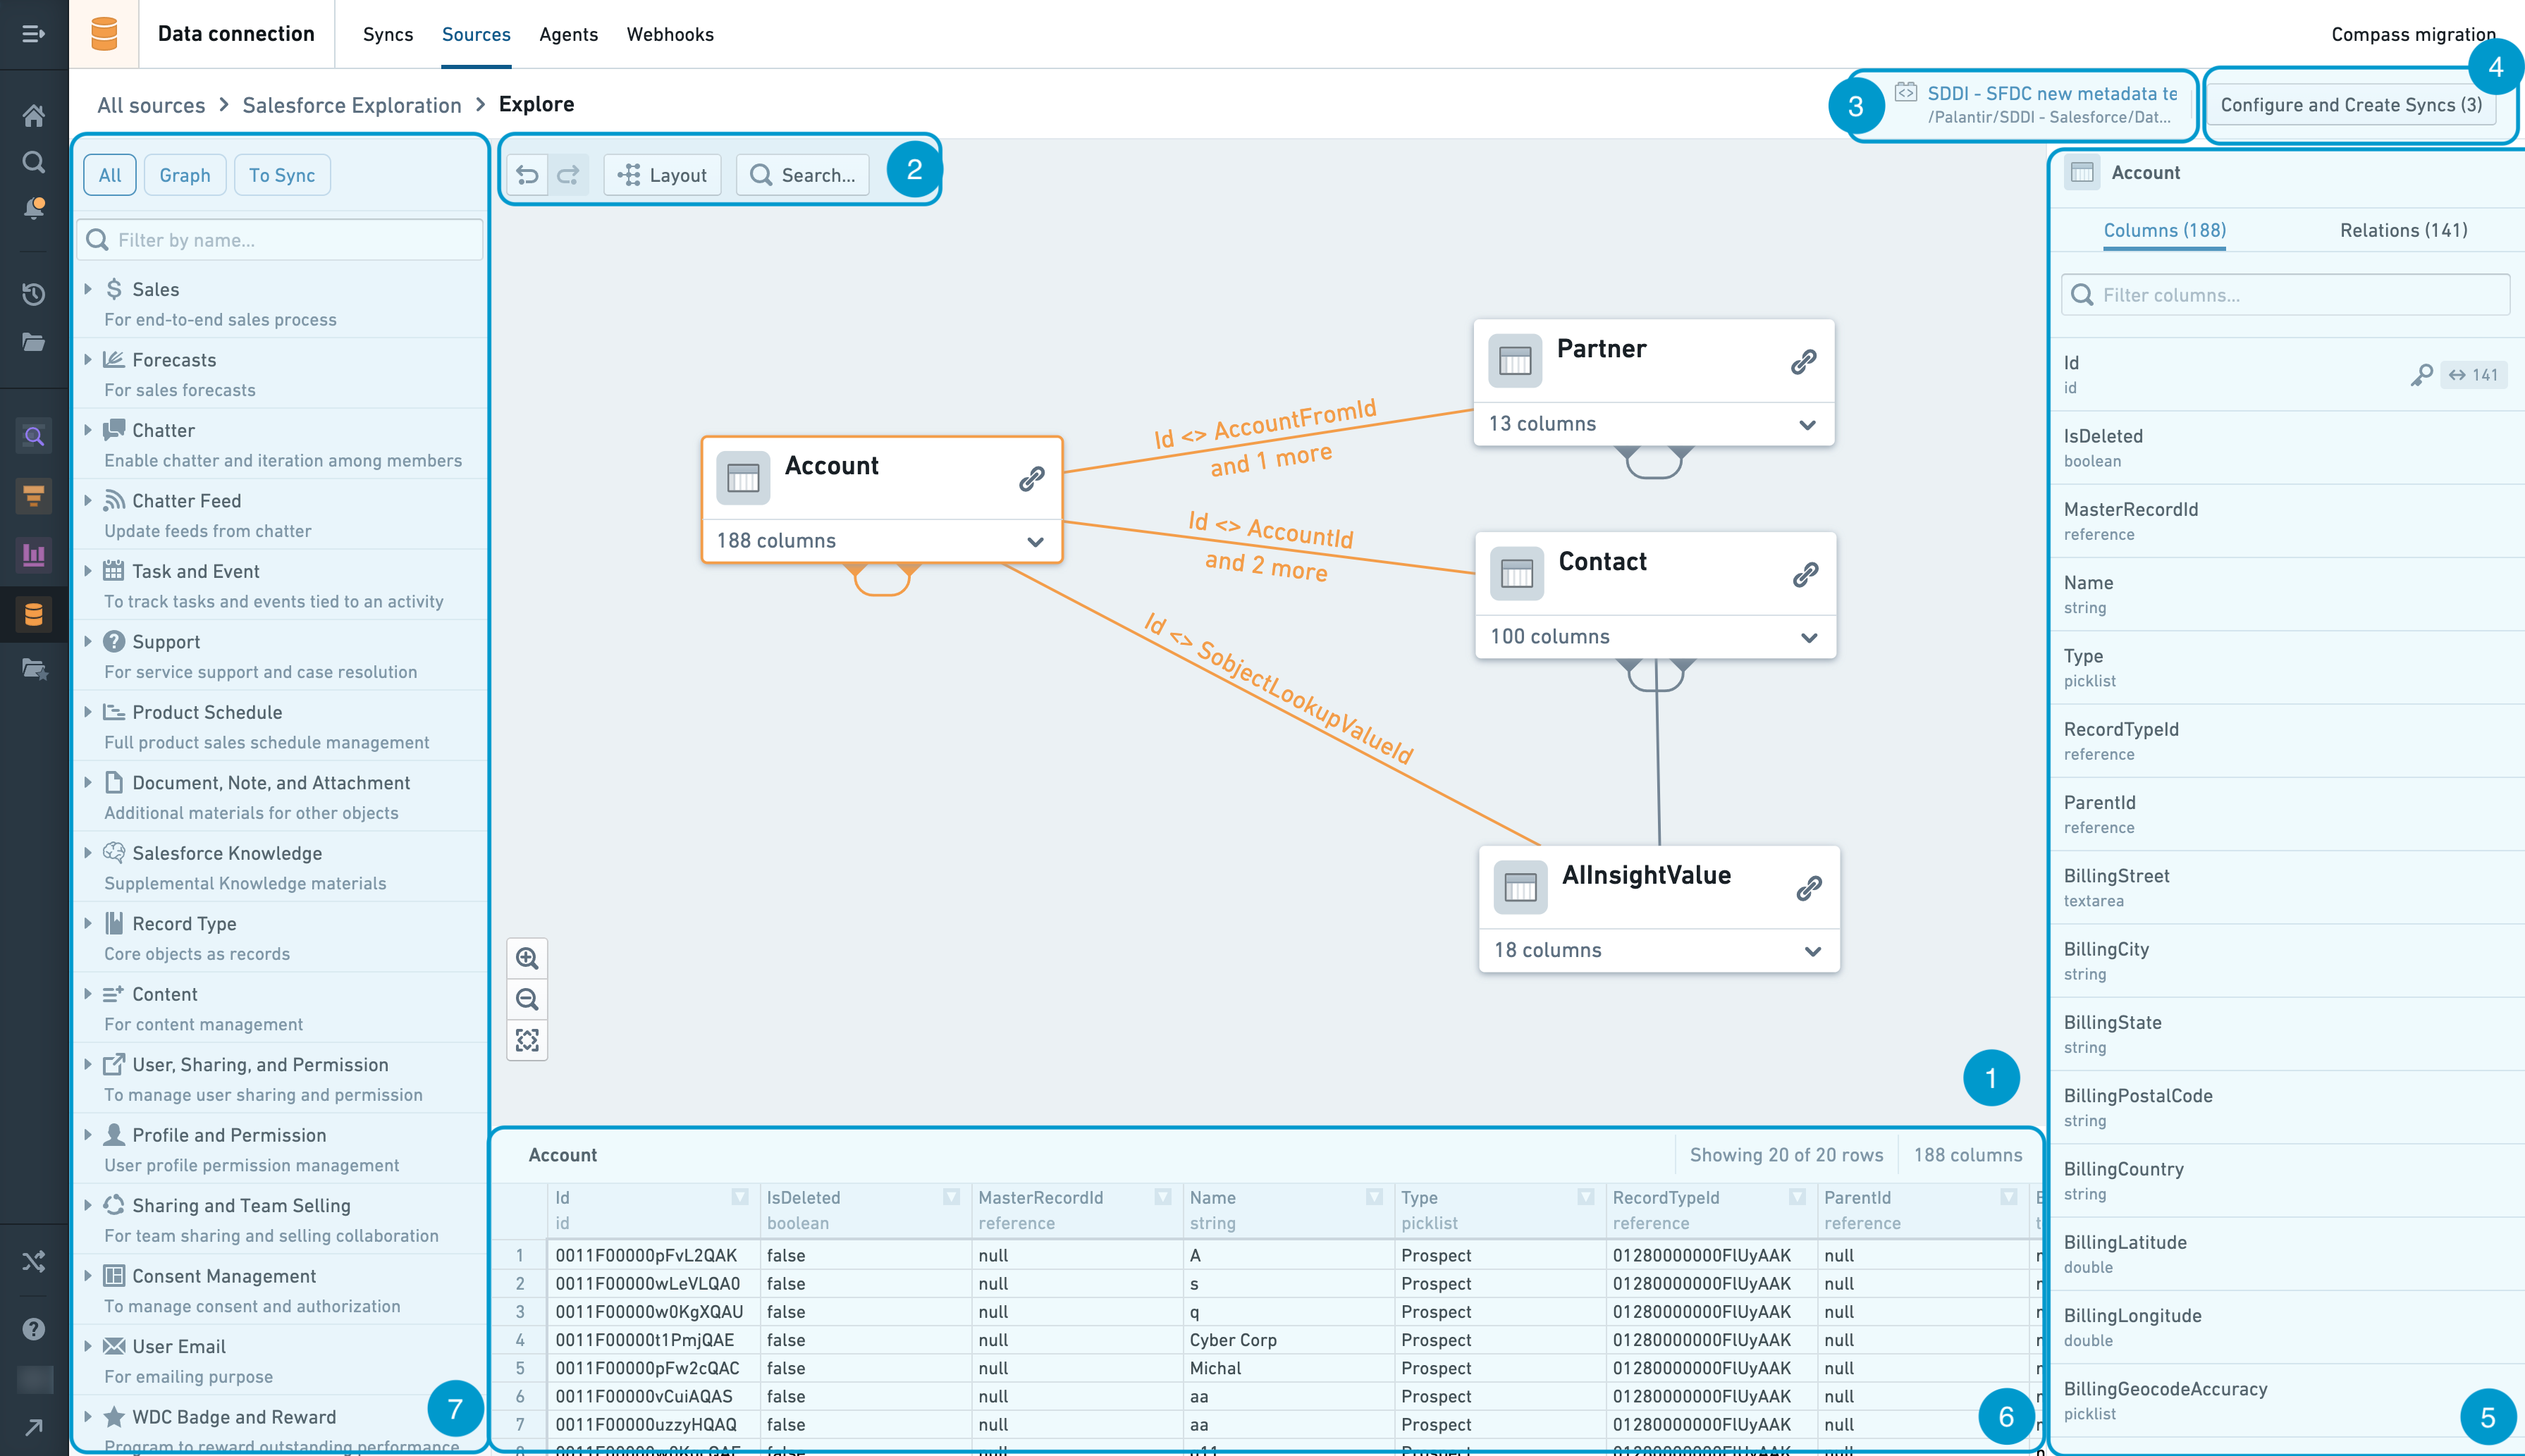
Lineage Graph
The graph is the workspace for arranging and manipulating dataset nodes as you explore the dataset relations at the source.
You can add dataset nodes to the lineage graph by using the Left Side Search Panel. Clicking on the downward arrow at the bottom right corner of each node on the graph allows you to see the list of columns available at this dataset. You can then add their related datasets by clicking on the link icon at the top right corner at each node. To hide those related datasets, click on the arrow icon at the top right corner. You can rearrange nodes manually by clicking and dragging them. You can also click the Layout button to automatically layout the nodes.
You can select a node by clicking it, or select multiple nodes with Ctrl + click (Cmd + click on Mac). Once a node or multiple nodes are selected, you can either remove the nodes or add them to Dataset Shopping Cart and Sync Configuration by right clicking on of the nodes to access the right-click menu. If a single node is selected, the Dataset Preview panel will pop up to show the dataset preview.
Graph Tools
The graph tools provides a set of graph exploration, navigation and customization capabilities:
- Undo and redo - buttons to undo or redo a graph exploration and navigation action
- Layout - Automatically layout dataset nodes in lineage graph
- Search - Search for dataset nodes by name or column
Backing pipeline generator
In source exploration, once you are done with exploration and creation of syncs, they are directed to push a configuration change to the associated automated pipeline generator. The backing pipeline generator indicates the specific pipeline generator Code Repository that is tied to the source exploration session, and thus where the pipeline configuration will land.
To change the backing pipeline generator, you can navigate to the page for your source in Data Connection application, and choose the corresponding pipeline generator upon clicking Edit Pipeline Builder settings.
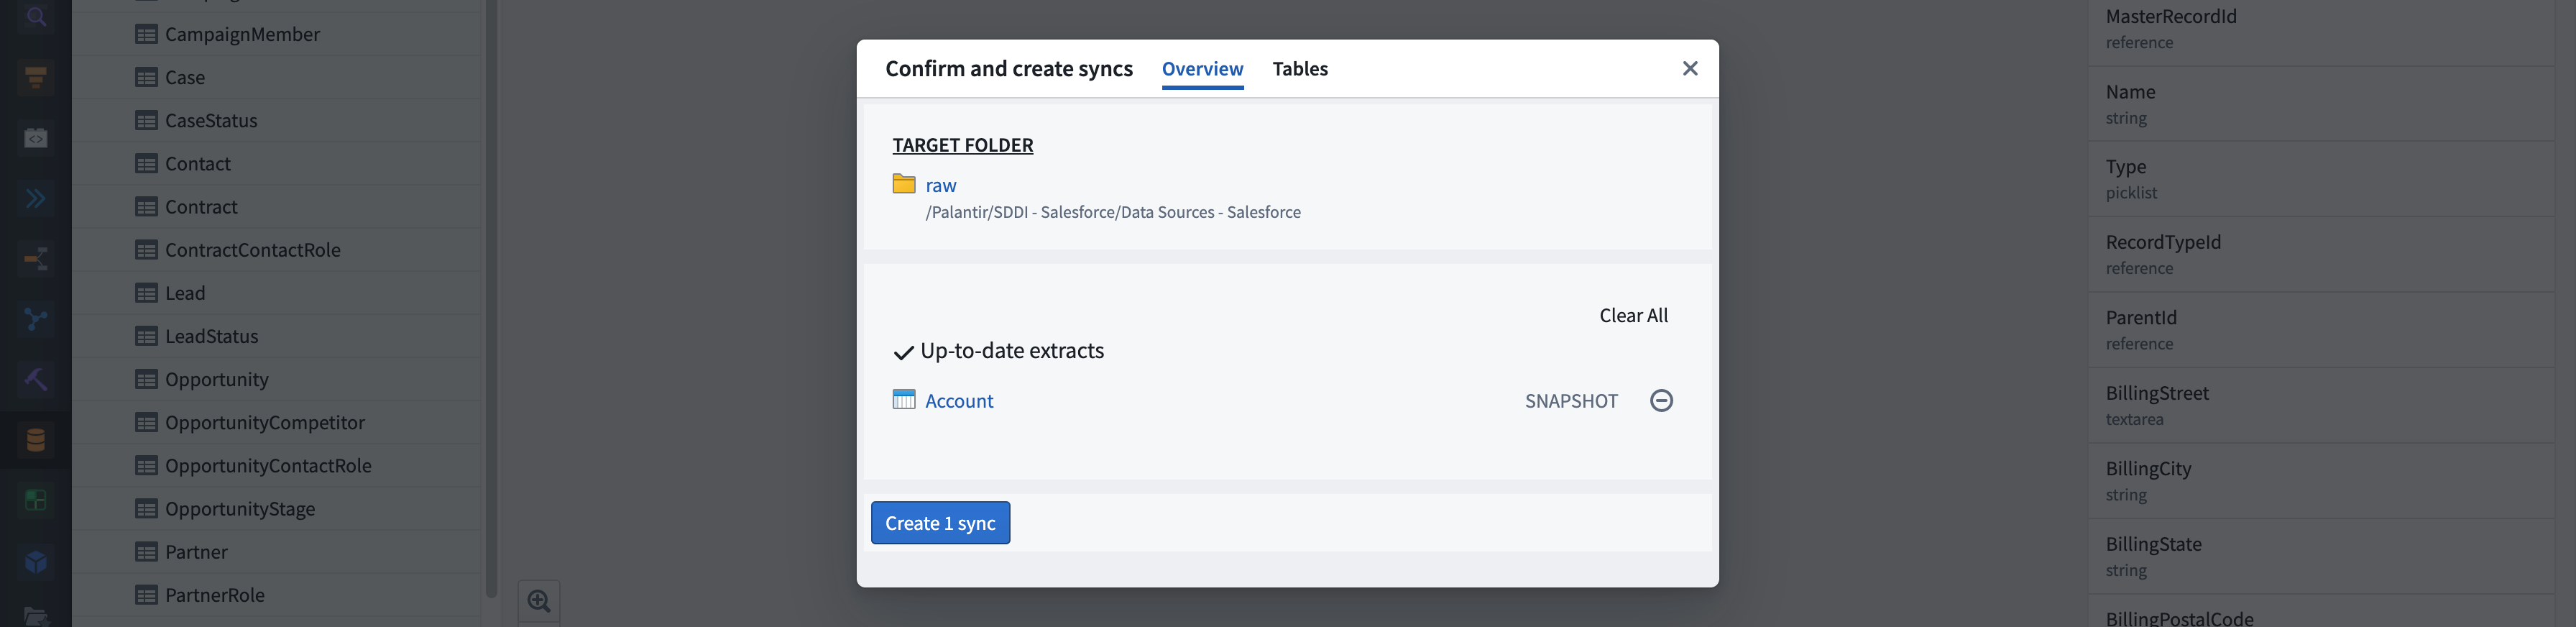
Dataset Shopping Cart and Sync Configuration
- Target Folder. A link to the folder in which syncs are created. It is defined within the automated pipeline generator and configurable in the HyperAuto application.
- Overview tab. Contains the overview information for the sync creation shopping cart
- Create extracts / Update extracts / Override datasets / Up-to-date extracts - list of extracts grouped by the operation that will be performed
Tables tab. Enables you to do further sync configurations such as transaction types along with a preview of the table.
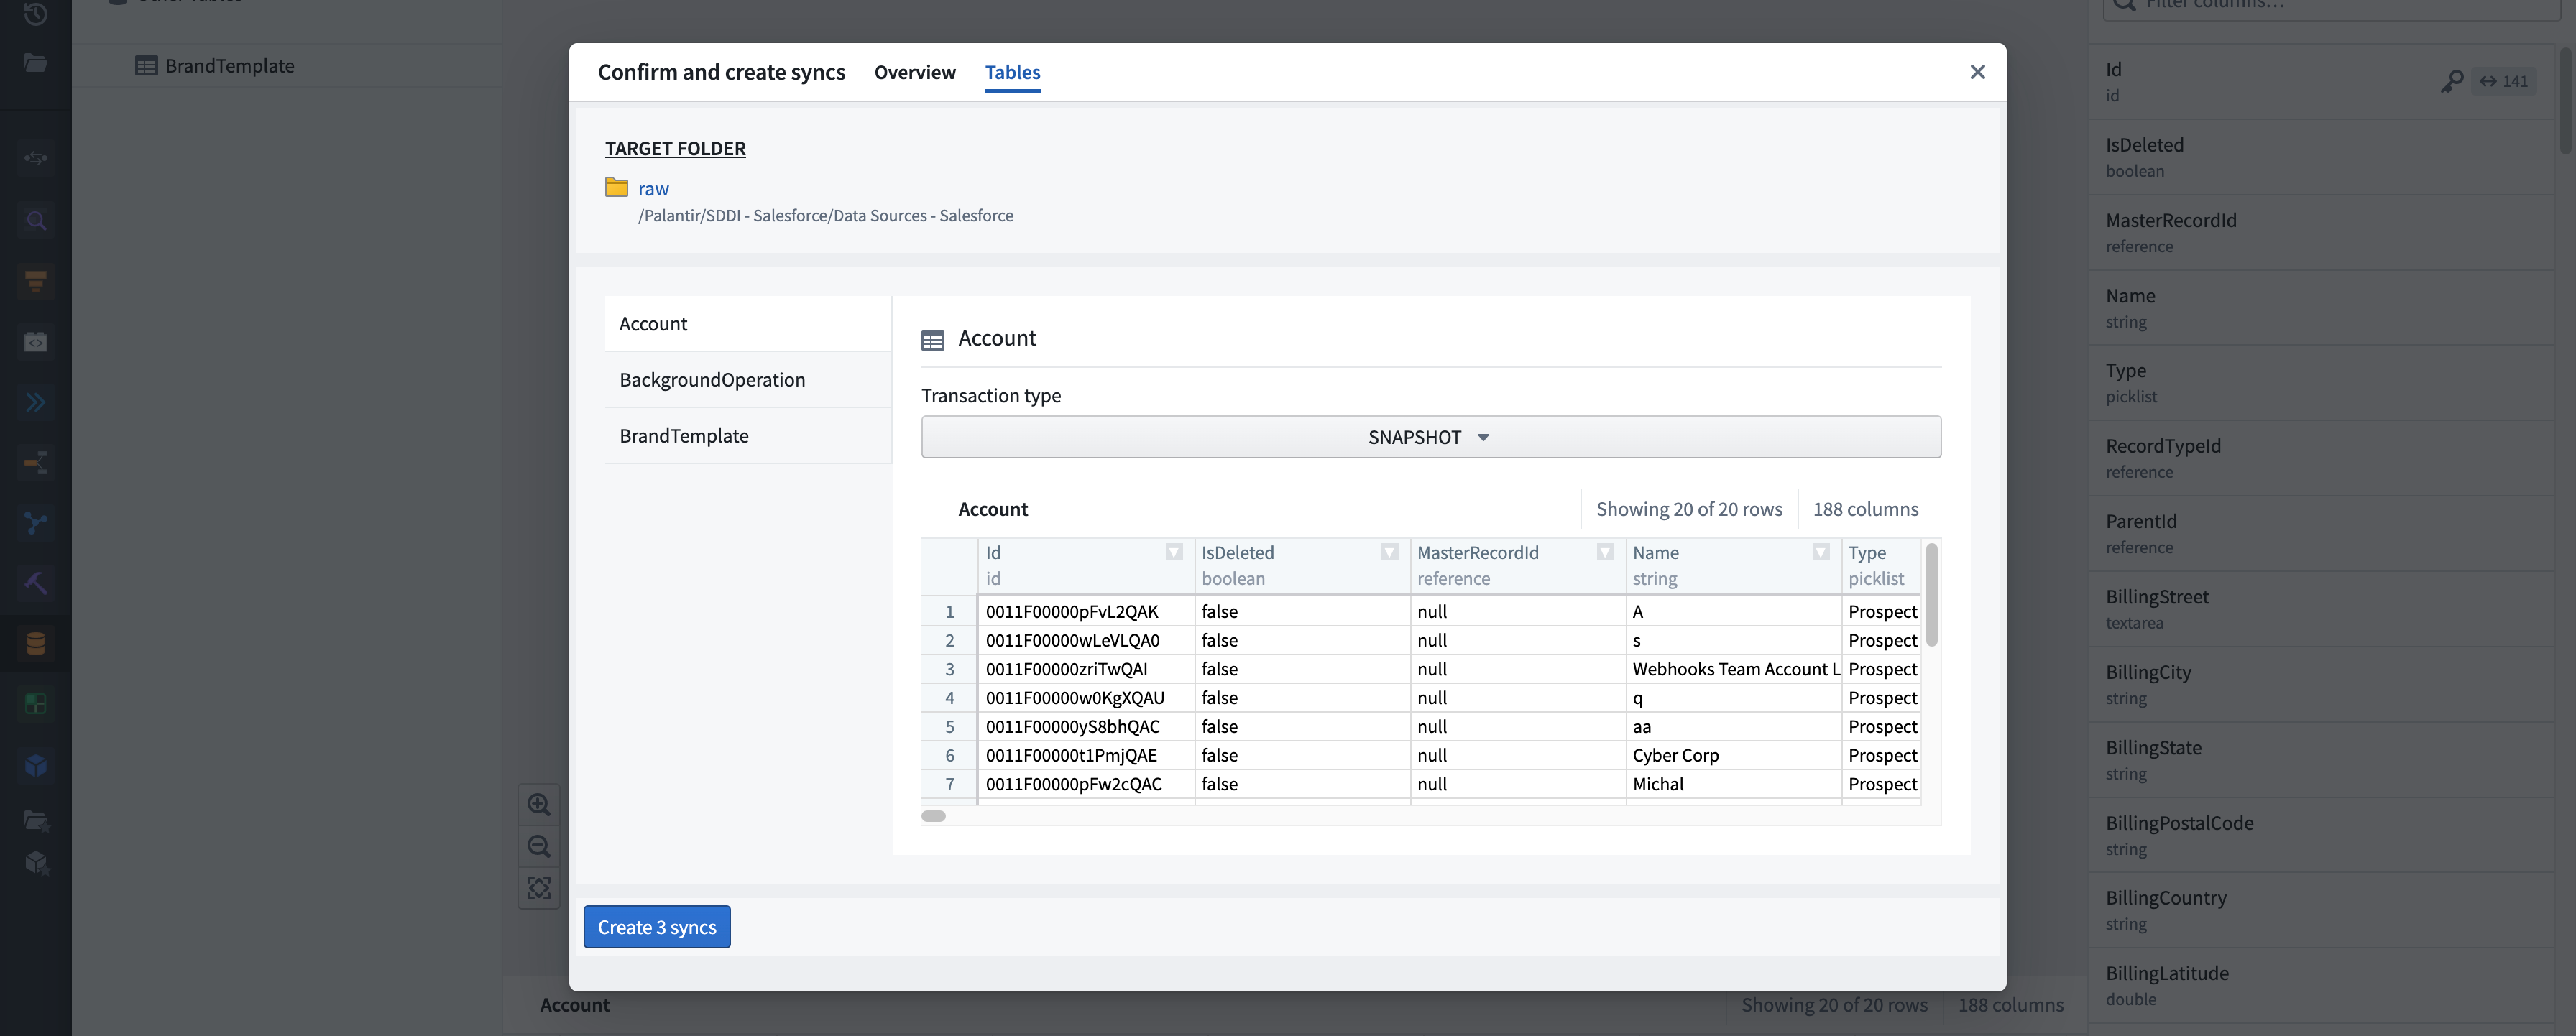
- Create Syncs and Integrate. Initiates syncing.
- Status summary. Displays the status of operations performed throughout the integration.
Right Side Panel
- Columns. Shows a full list of columns contained in the dataset. The key icon indicates which columns in the selected dataset form the primary key.
- Relations. Shows relations of related datasets within the source system.
Dataset Preview
Shows a sample of the data in the selected dataset.
Left Side Search Panel
The left sidebar serves as a navigation and search tool. Tables displayed in this panel are categorized based on the grouping logic defined for the associated source system type.
As you start typing the search term, the panel automatically performs the search to filter the list down to the related tables and categories. Once you find the suitable datasets, you can add them to the Lineage Graph and/or to the Dataset Shopping Cart by hovering over the dataset in the left side panel and clicking either the Add to shopping cart and graph or Add to graph buttons.
At the top of the panel, there are 3 different modes you can choose.
- All. Shows all tables and categories.
- Graph. Shows all tables that are on the graph and their categories.
- To Sync. Shows all tables that are in the shopping cart and their categories.