- Capabilities
- Getting started
- Architecture center
- Platform updates
Histogram
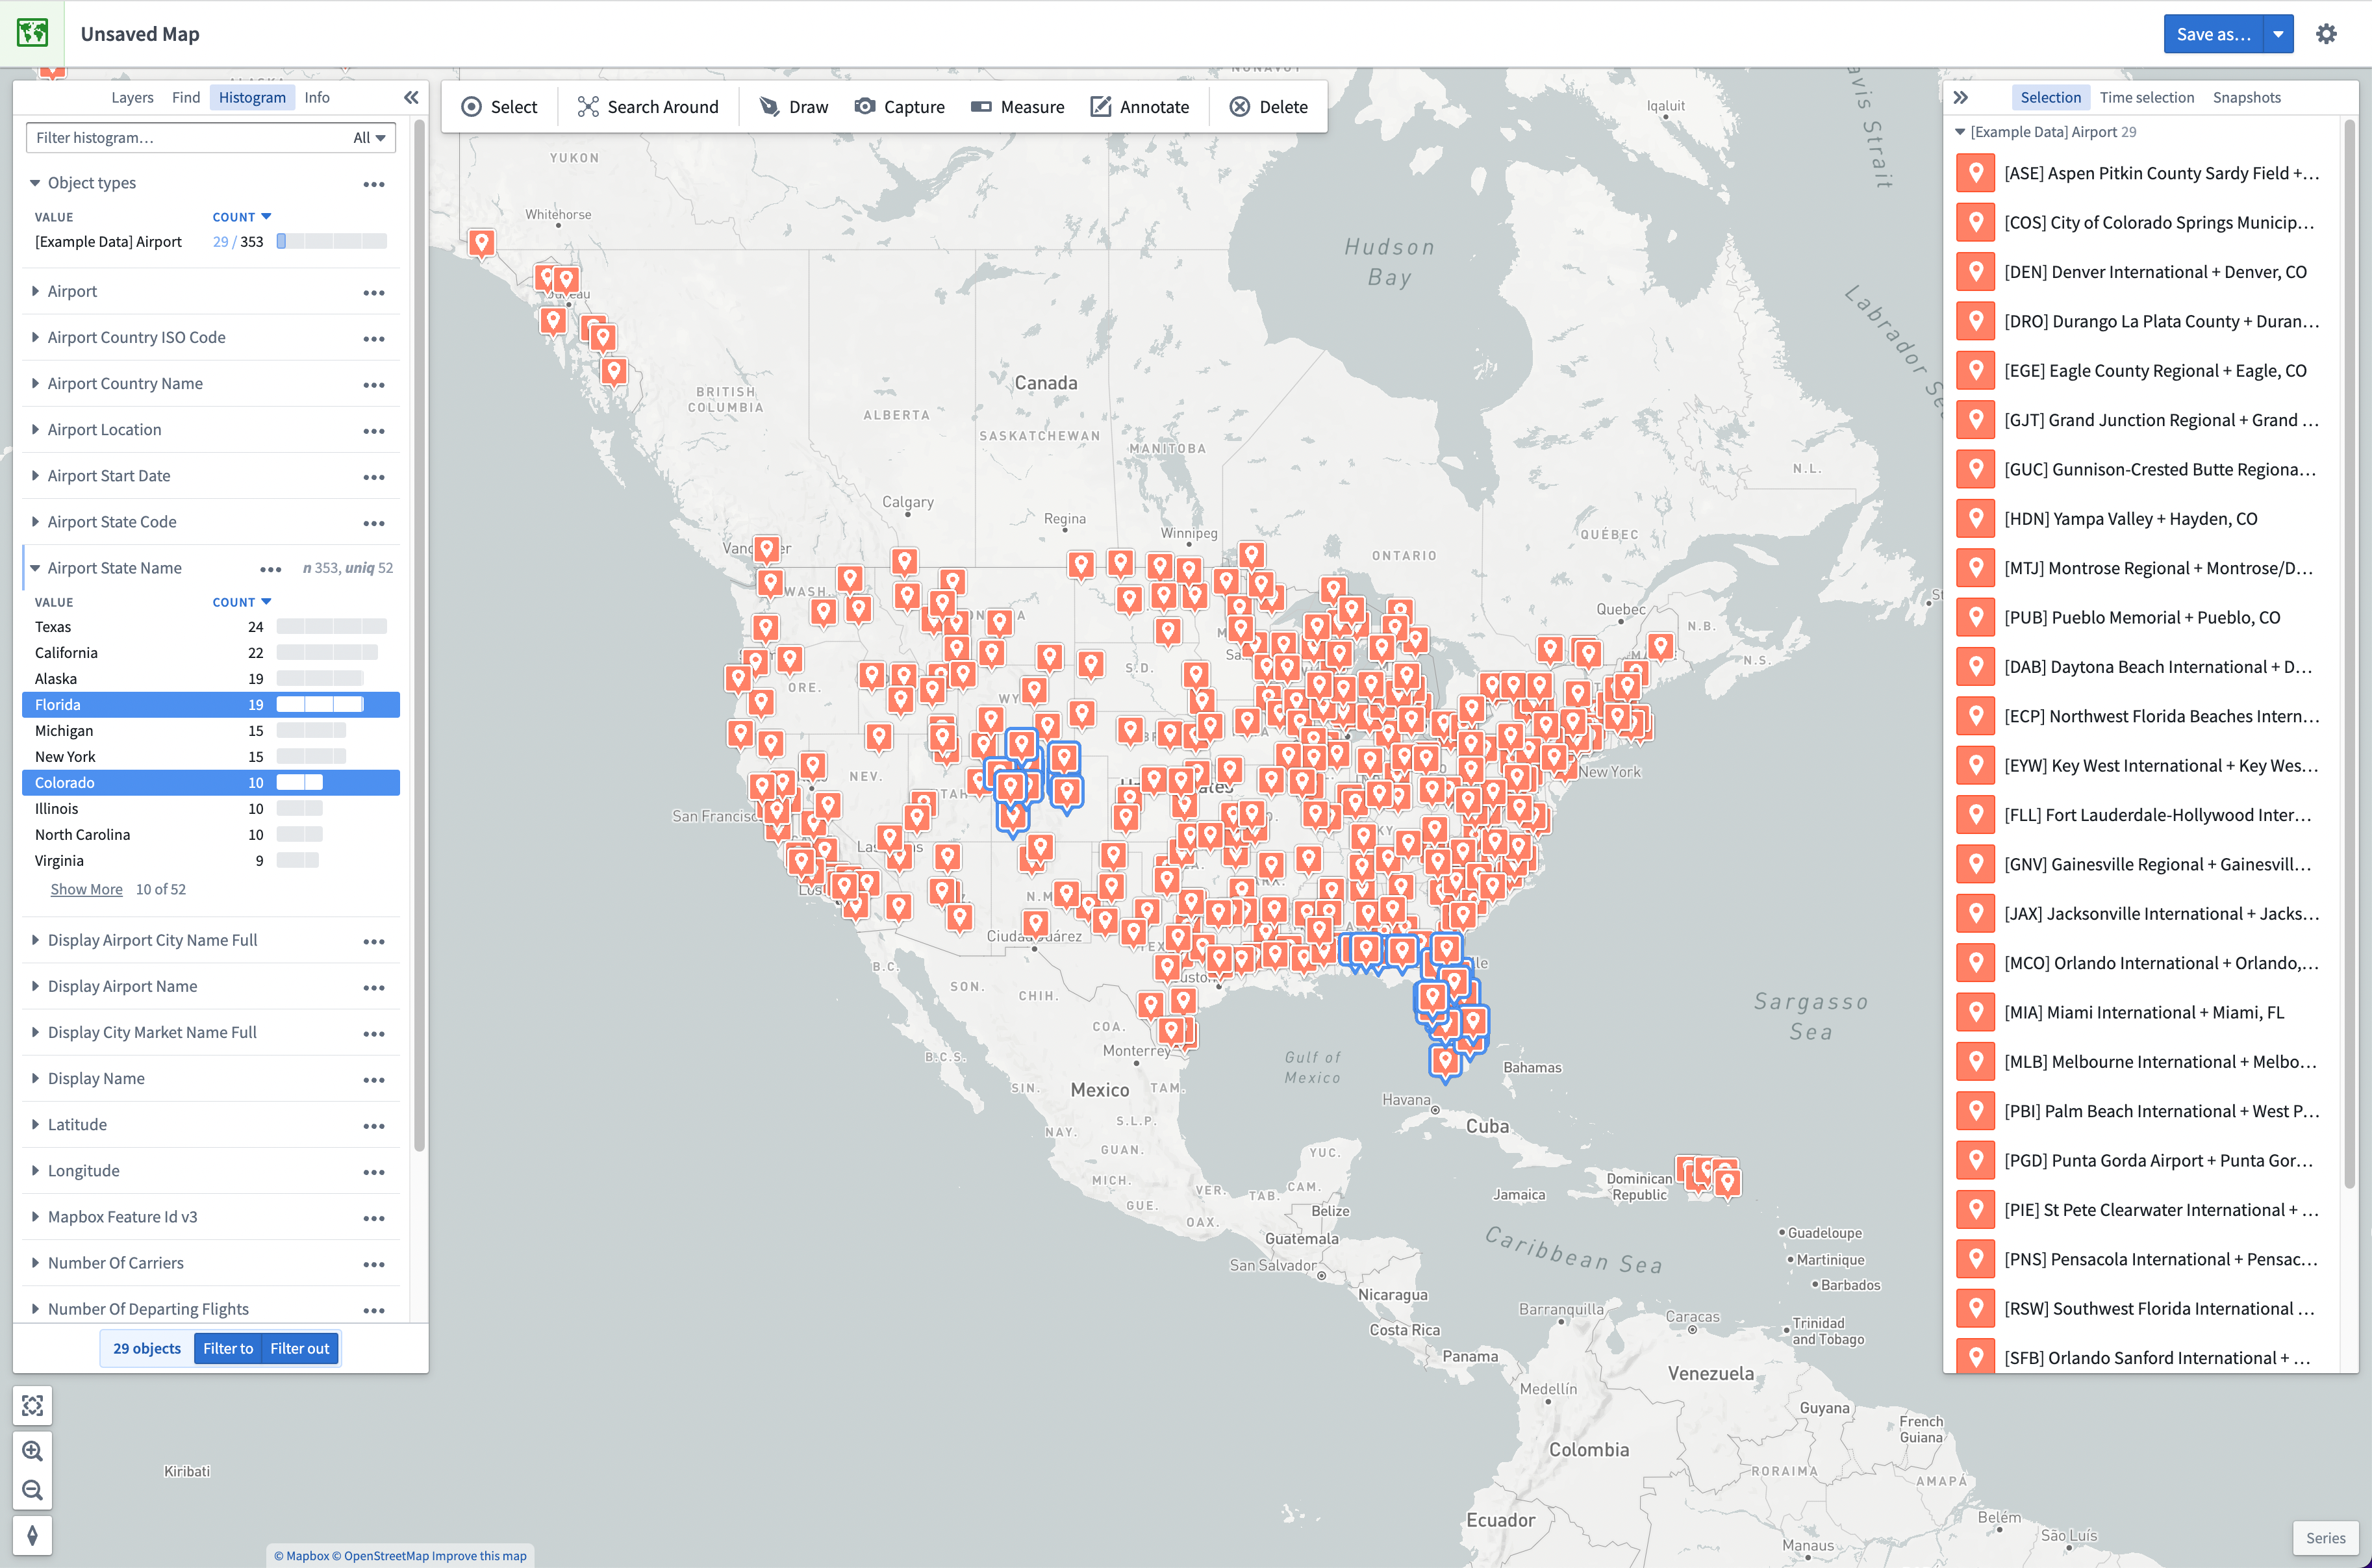
The Histogram panel allows for the selection and filtering of objects data on your map. The first section of the panel Object types shows the counts of objects by object type on your map. Below, there is one section per property type, across all object types present on your map. The filter box at the top of the panel allows you to filter results to properties with matching names.
Use the histogram
Expand a histogram section to show a row for each distinct value of the given property, limited by default to the top five sorted by the count of values. Click Show more to display the next five rows.
Click the Value heading to toggle the sort method to Value (ascending) or Value (descending). Click the Count heading to toggle the sort method to Count (descending), Count (ascending), Selected Count (descending) or Selected Count (ascending).
| Value | Count | Selected count |
|---|---|---|
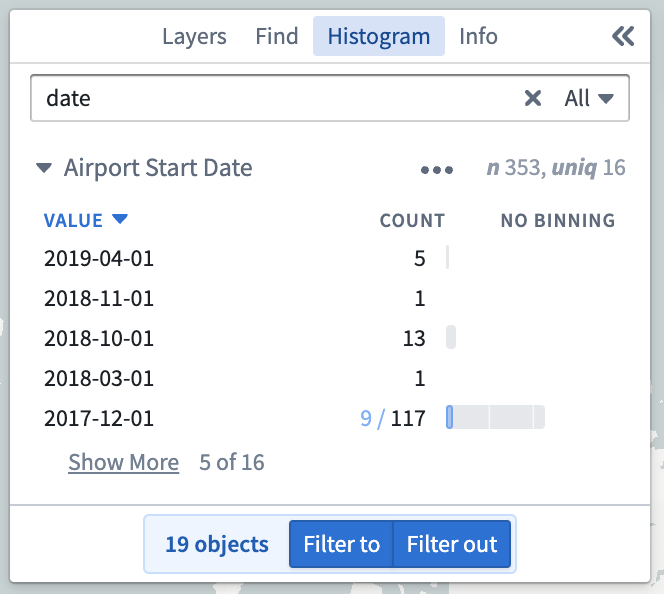 | 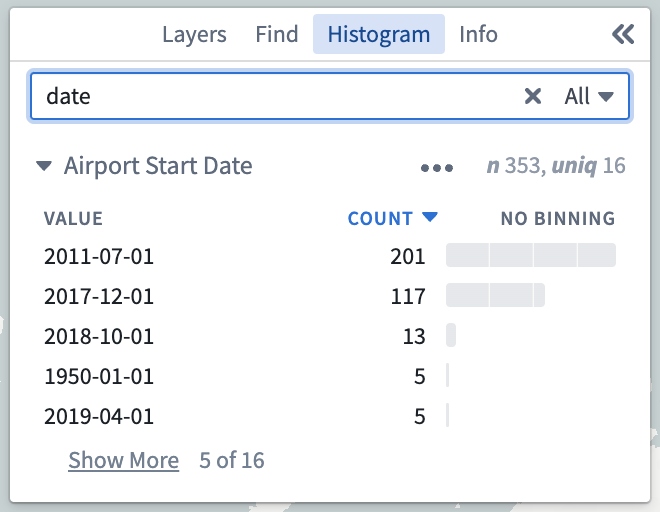 | 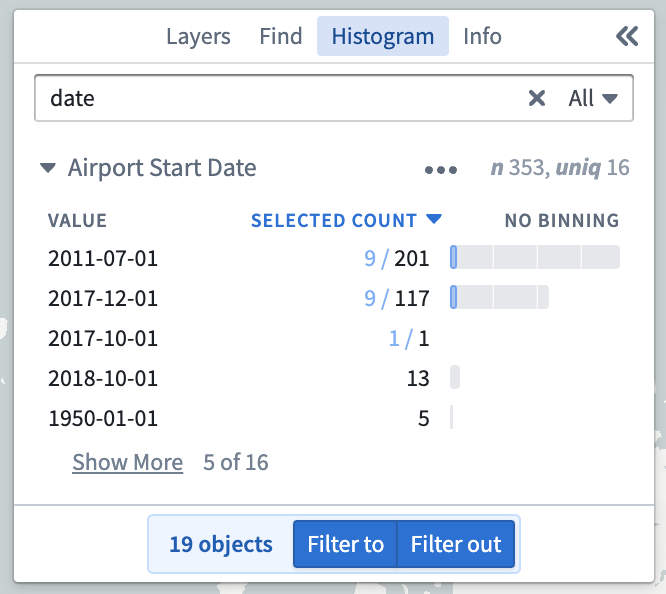 |
For date and numeric properties, an additional option to control the Binning is available.
For date properties, by clicking on this heading you can toggle the binning method between Year, Year and month, Quarter, Month, and Day. Click an example image to expand it.
| Year | Year and month | Quarter | Month | Day |
|---|---|---|---|---|
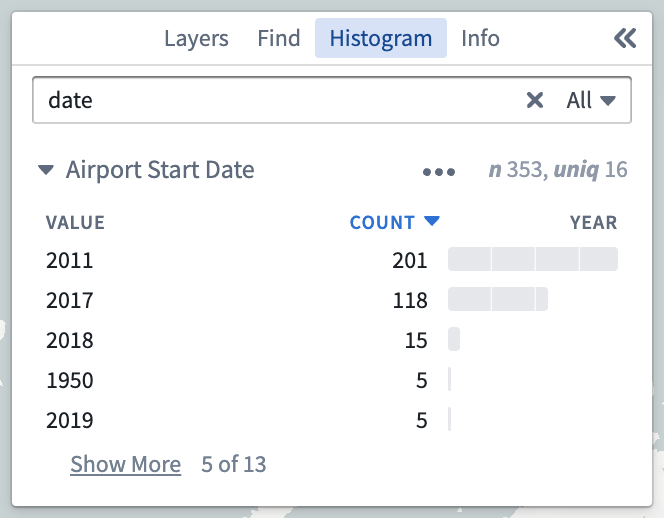 | 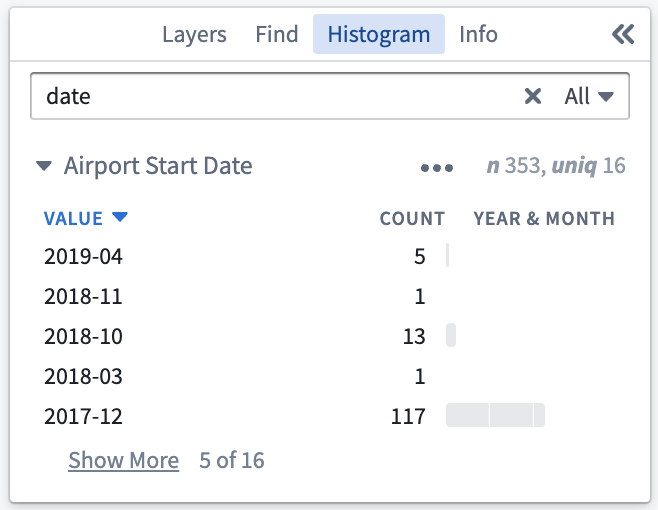 | 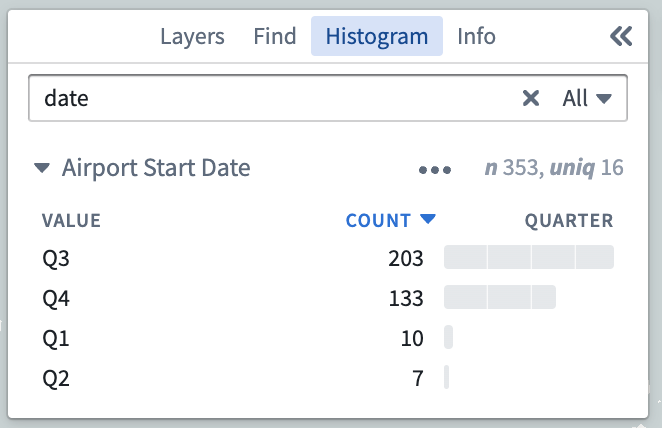 | 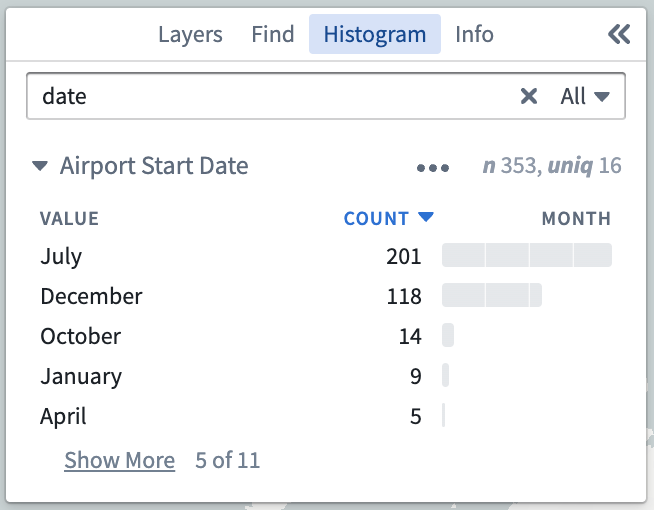 | 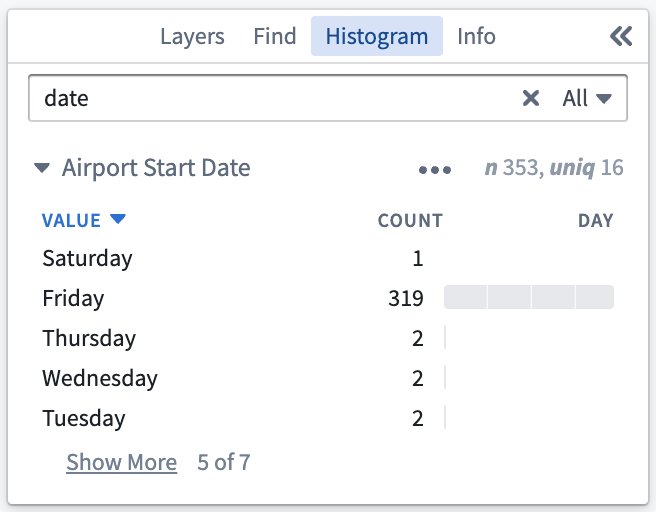 |
For numeric properties, by clicking on this heading you can toggle the binning method between No binning, Equal size which will automatically group the numeric values into equally sized bins, and Logarithmic which will group the numeric values by their order of magnitude.
| No binning | Equal size | Logarithmic |
|---|---|---|
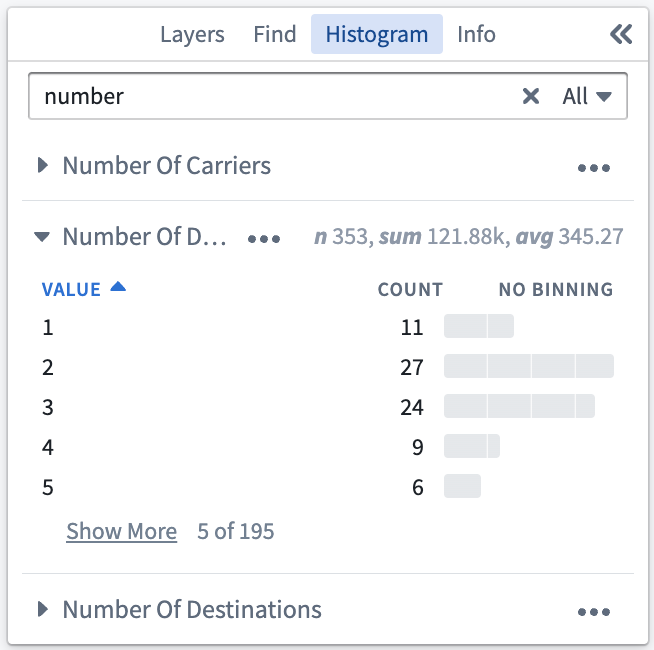 | 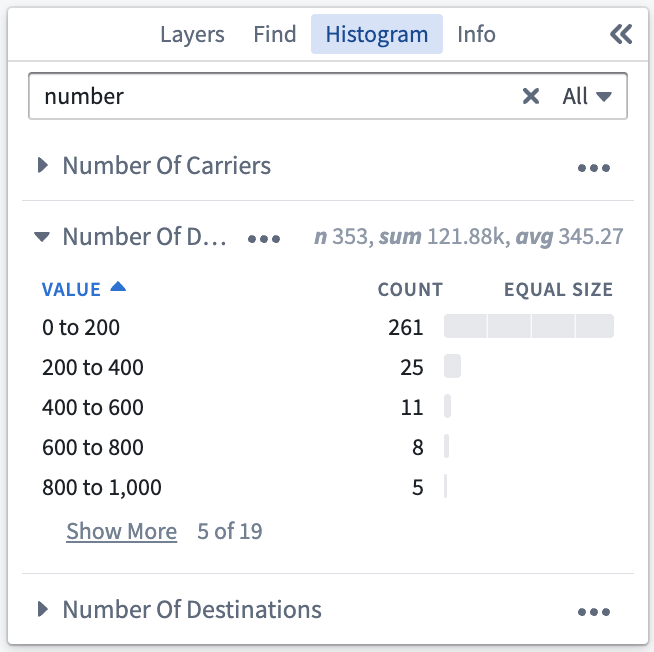 | 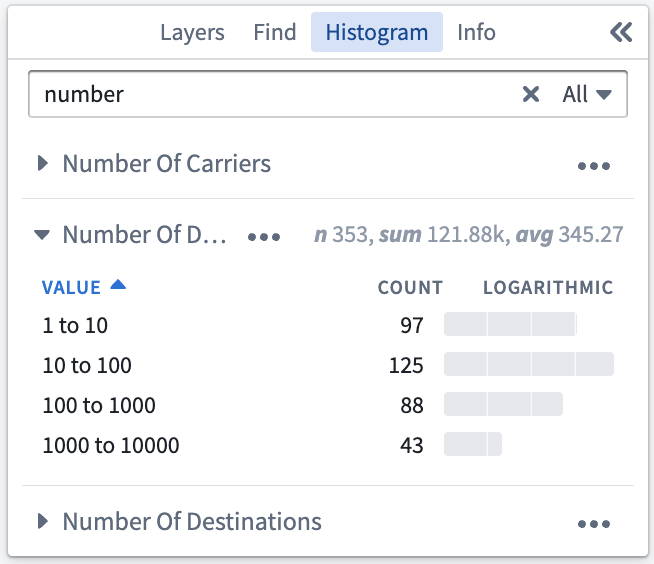 |
Selection
Clicking on a row within the Histogram panel will select all matching objects. Holding Shift while selecting a second row will select a range of rows. Holding Ctrl (Windows) or Cmd (Mac) will add the row to the existing selection. This enables you to select rows across multiple sections of the histogram.
Filtering
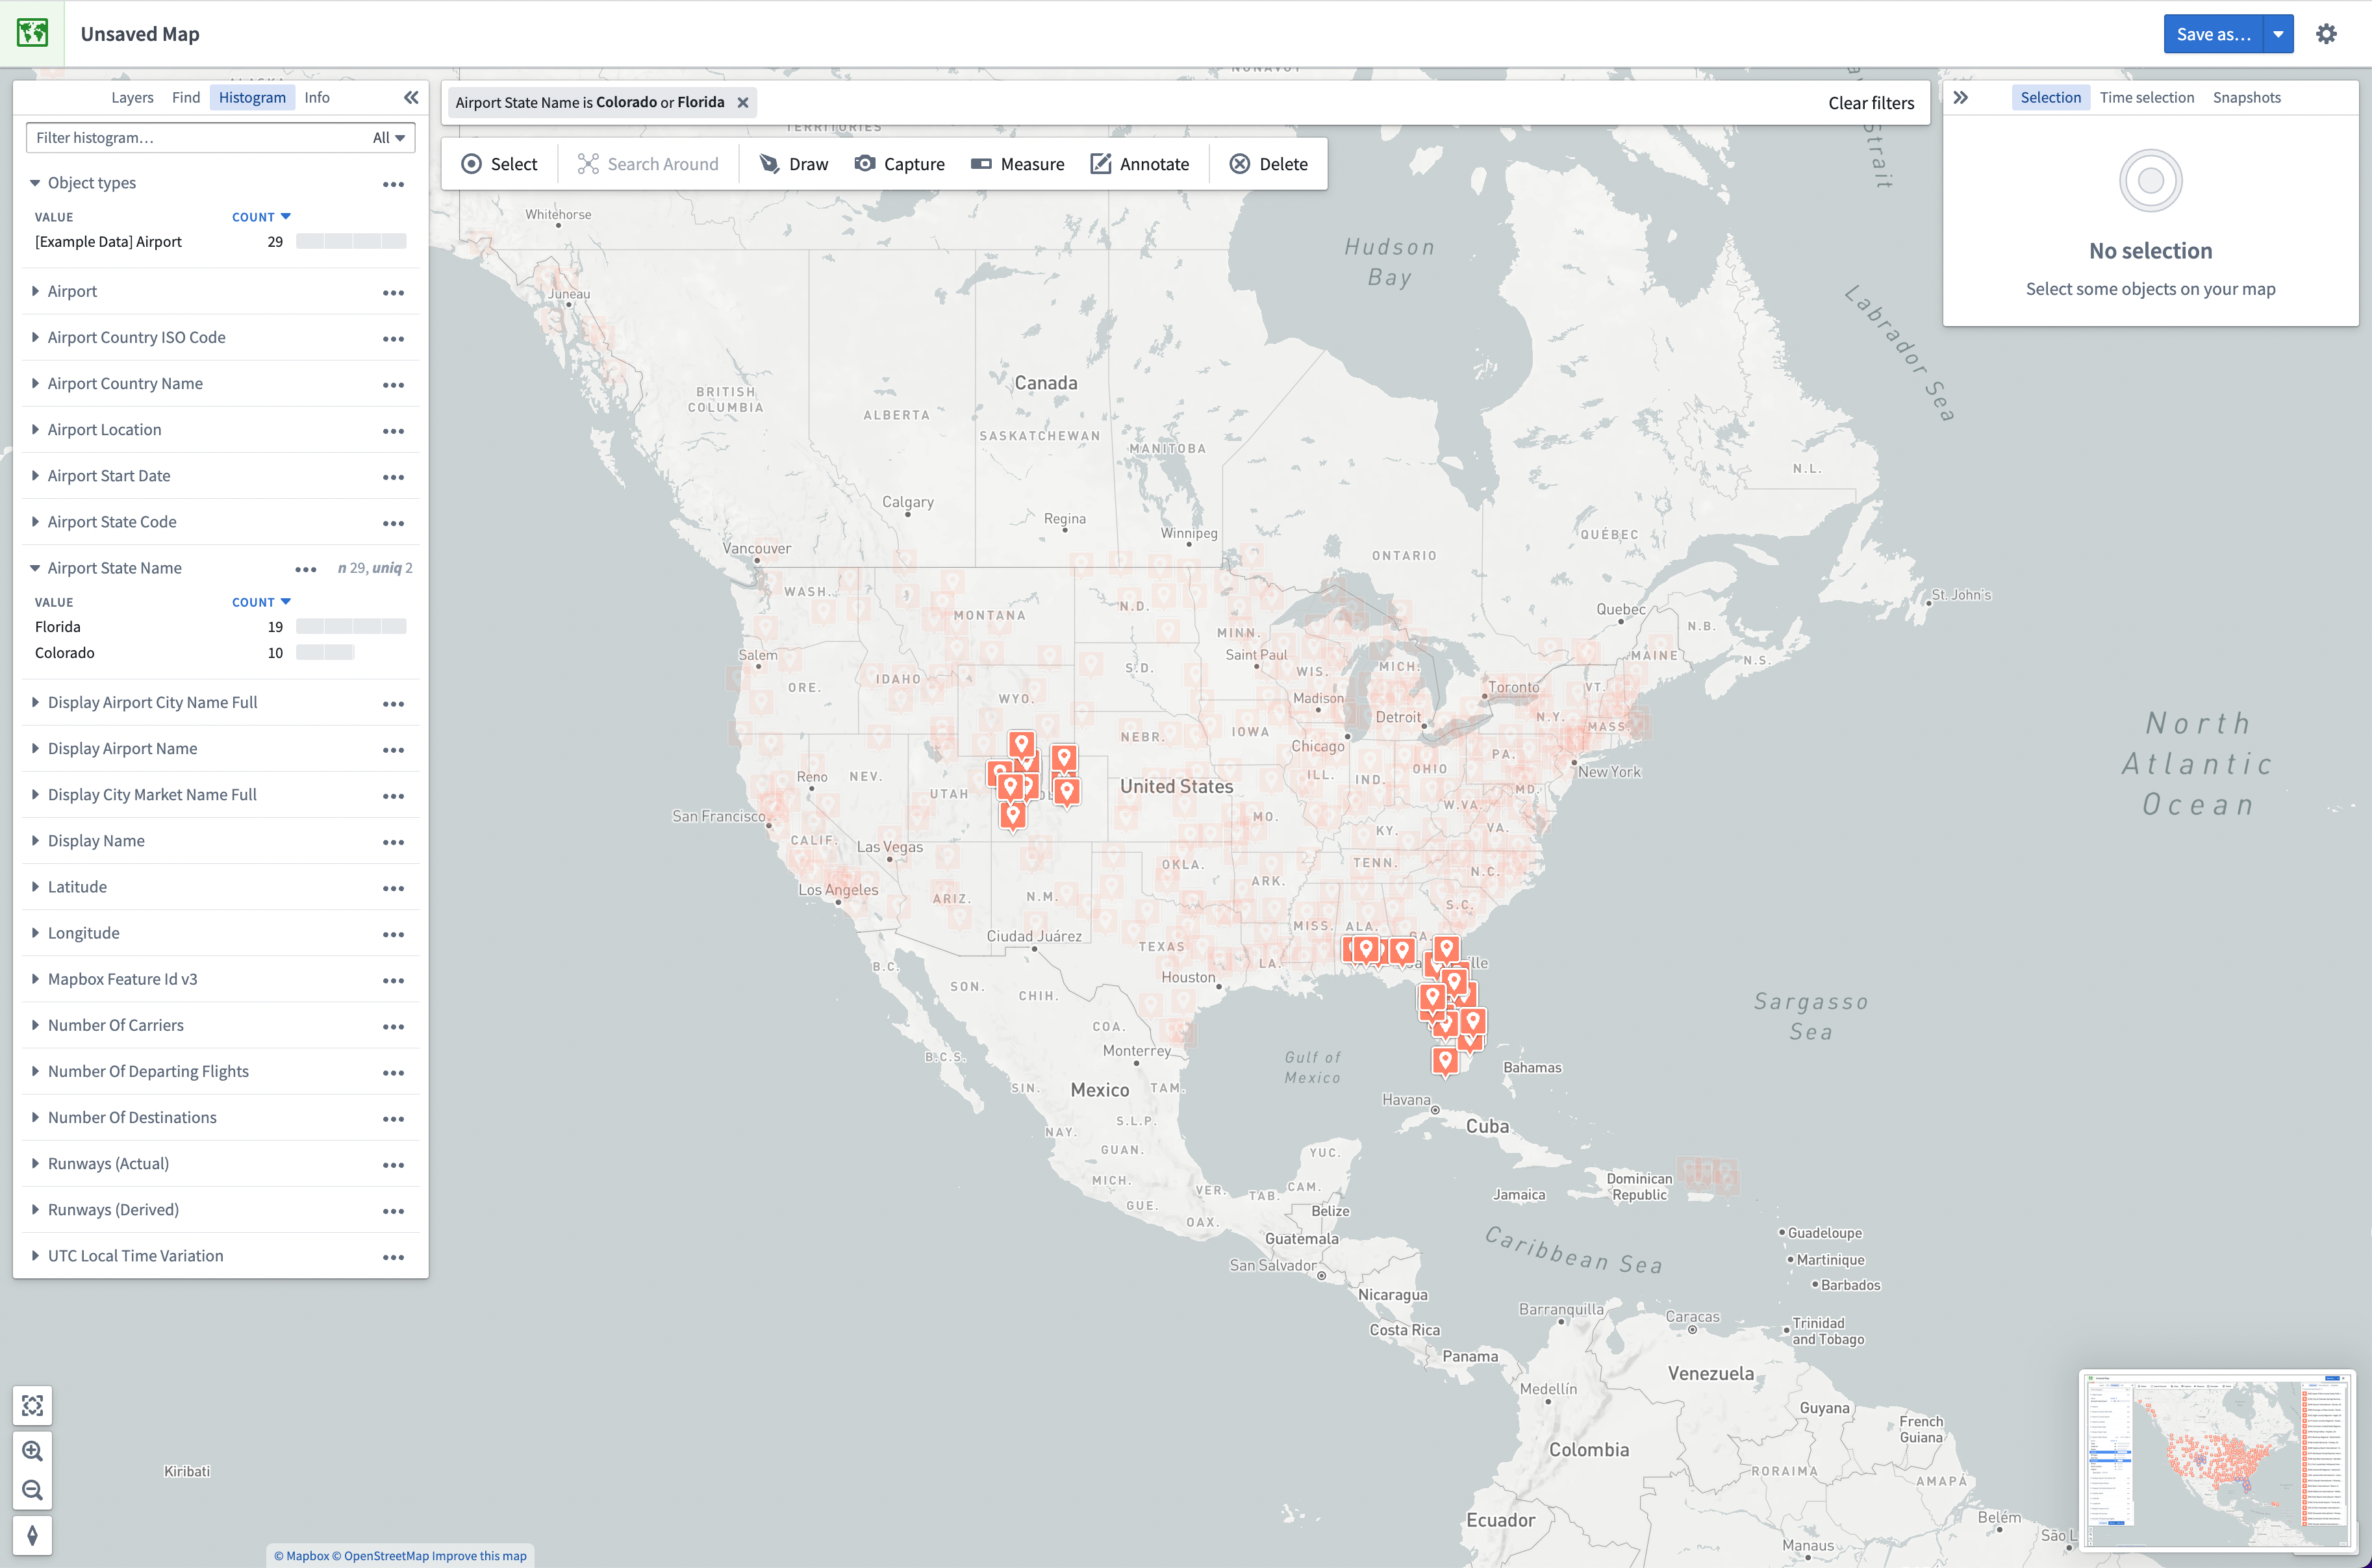
When histogram rows are selected, you can use the Filter to or Filter out buttons to create filters. Filters temporarily reduce the opacity of objects that do not match the filters. These objects will become uninteractive and will not contribute to the histogram statistics. When present, filters are visible in a bar above the main application toolbar. Filters can be removed using the x button on the filter, or by using the Clear filters button to remove all filters. Filters are not saved with your map.
Selecting Filter to will filter your map to only objects matching the selected rows.
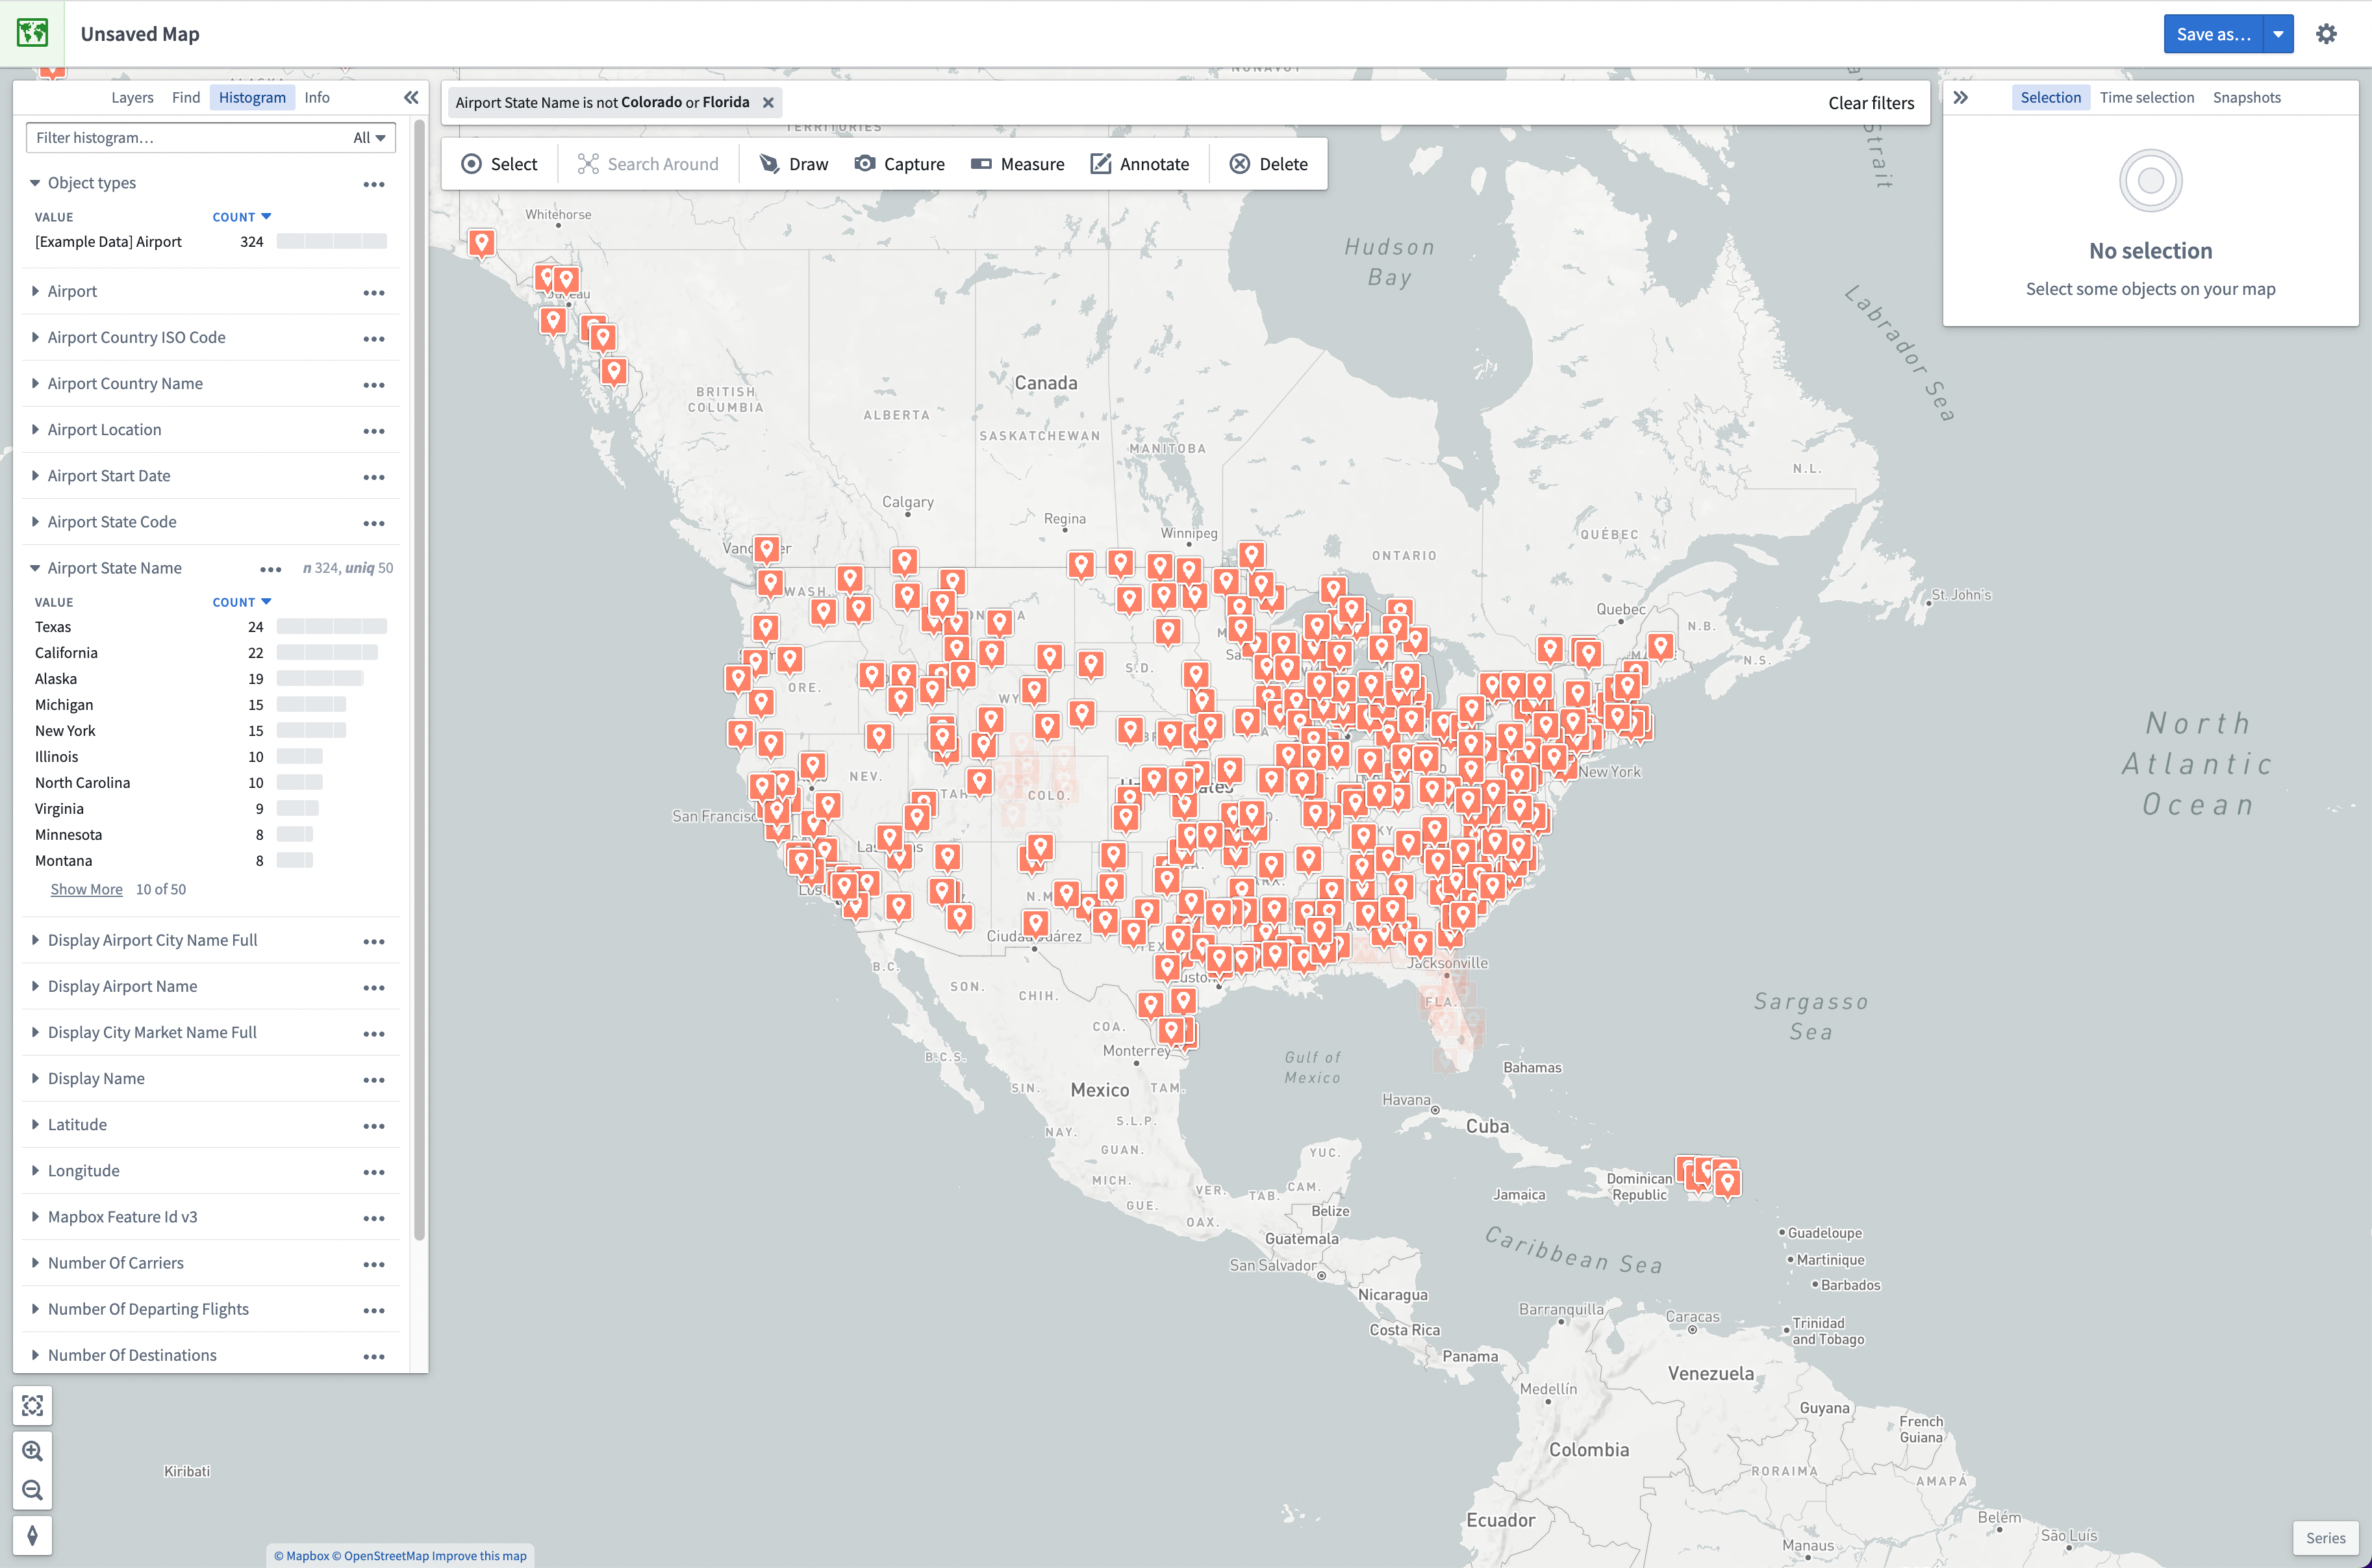
Selecting Filter out will filter your map to only objects that do not match the selected rows.
In addition to the Filter to and *Filter out buttons, you can also filter to an individual histogram row by double-clicking on it. To filter to all currently selected objects, you can use the Filter to selected objects menu item from the right click menu on your map.