- Capabilities
- Getting started
- Architecture center
- Platform updates
Events
Events are object types or timeline geometries that include temporal information about a specific point or period of time; most commonly this means an event object has timestamp properties that mark the start and end of the time period. Event objects render as icons on the map canvas as well as within the timeline panel at the bottom of the screen as timeline geometries, both of which you can style to help users better understand objects' events in relation to time.
Review the table below to learn more about the distinctions between event objects and timeline geometries.
| Feature behavior or configuration | Event object | Timeline geometry |
|---|---|---|
| Rendering configuration prerequisites | Configured in Ontology Manager, event objects contain start and end timestamp properties. | Configured in a map's Layers panel, timeline geometries require an object to have at least one timestamp property depending on the geometry's shape. Any object with at least one timestamp property can render on a map's timeline. |
| Map canvas effects | Used for opacity-based styling. | No effects. Will only add layers to a map's timeline. |
| Map timeline effects | Foundry automatically displays event objects on a map's timeline. | Foundry displays objects with timestamp properties as timeline geometries once configured in the map's Layers panel. Event objects will override default timeline styling. |
| Timeline styling options | No timeline styling options. Event objects contain a bar displaying the object's color. | Multiple timeline styling options available, such as those for shape and custom coloring. |
| Display behavior with multiple timeline layers | Event objects only show the event time periods configured in Ontology Manager. | You can configure multiple timeline geometry layers in the Layers panel of your map based on the timestamp properties on your object. |
Learn more about configuring events in the Ontology.
Event objects
Event objects are object types that include temporal information about a specific point or period of time. Most commonly this means an event object has timestamp properties that mark the start and end of the time period. Learn more about configuring events in the Ontology.
Once you add event objects to your map as a layer, you can apply custom styles, explore their linked events, and view event time periods in the timeline.
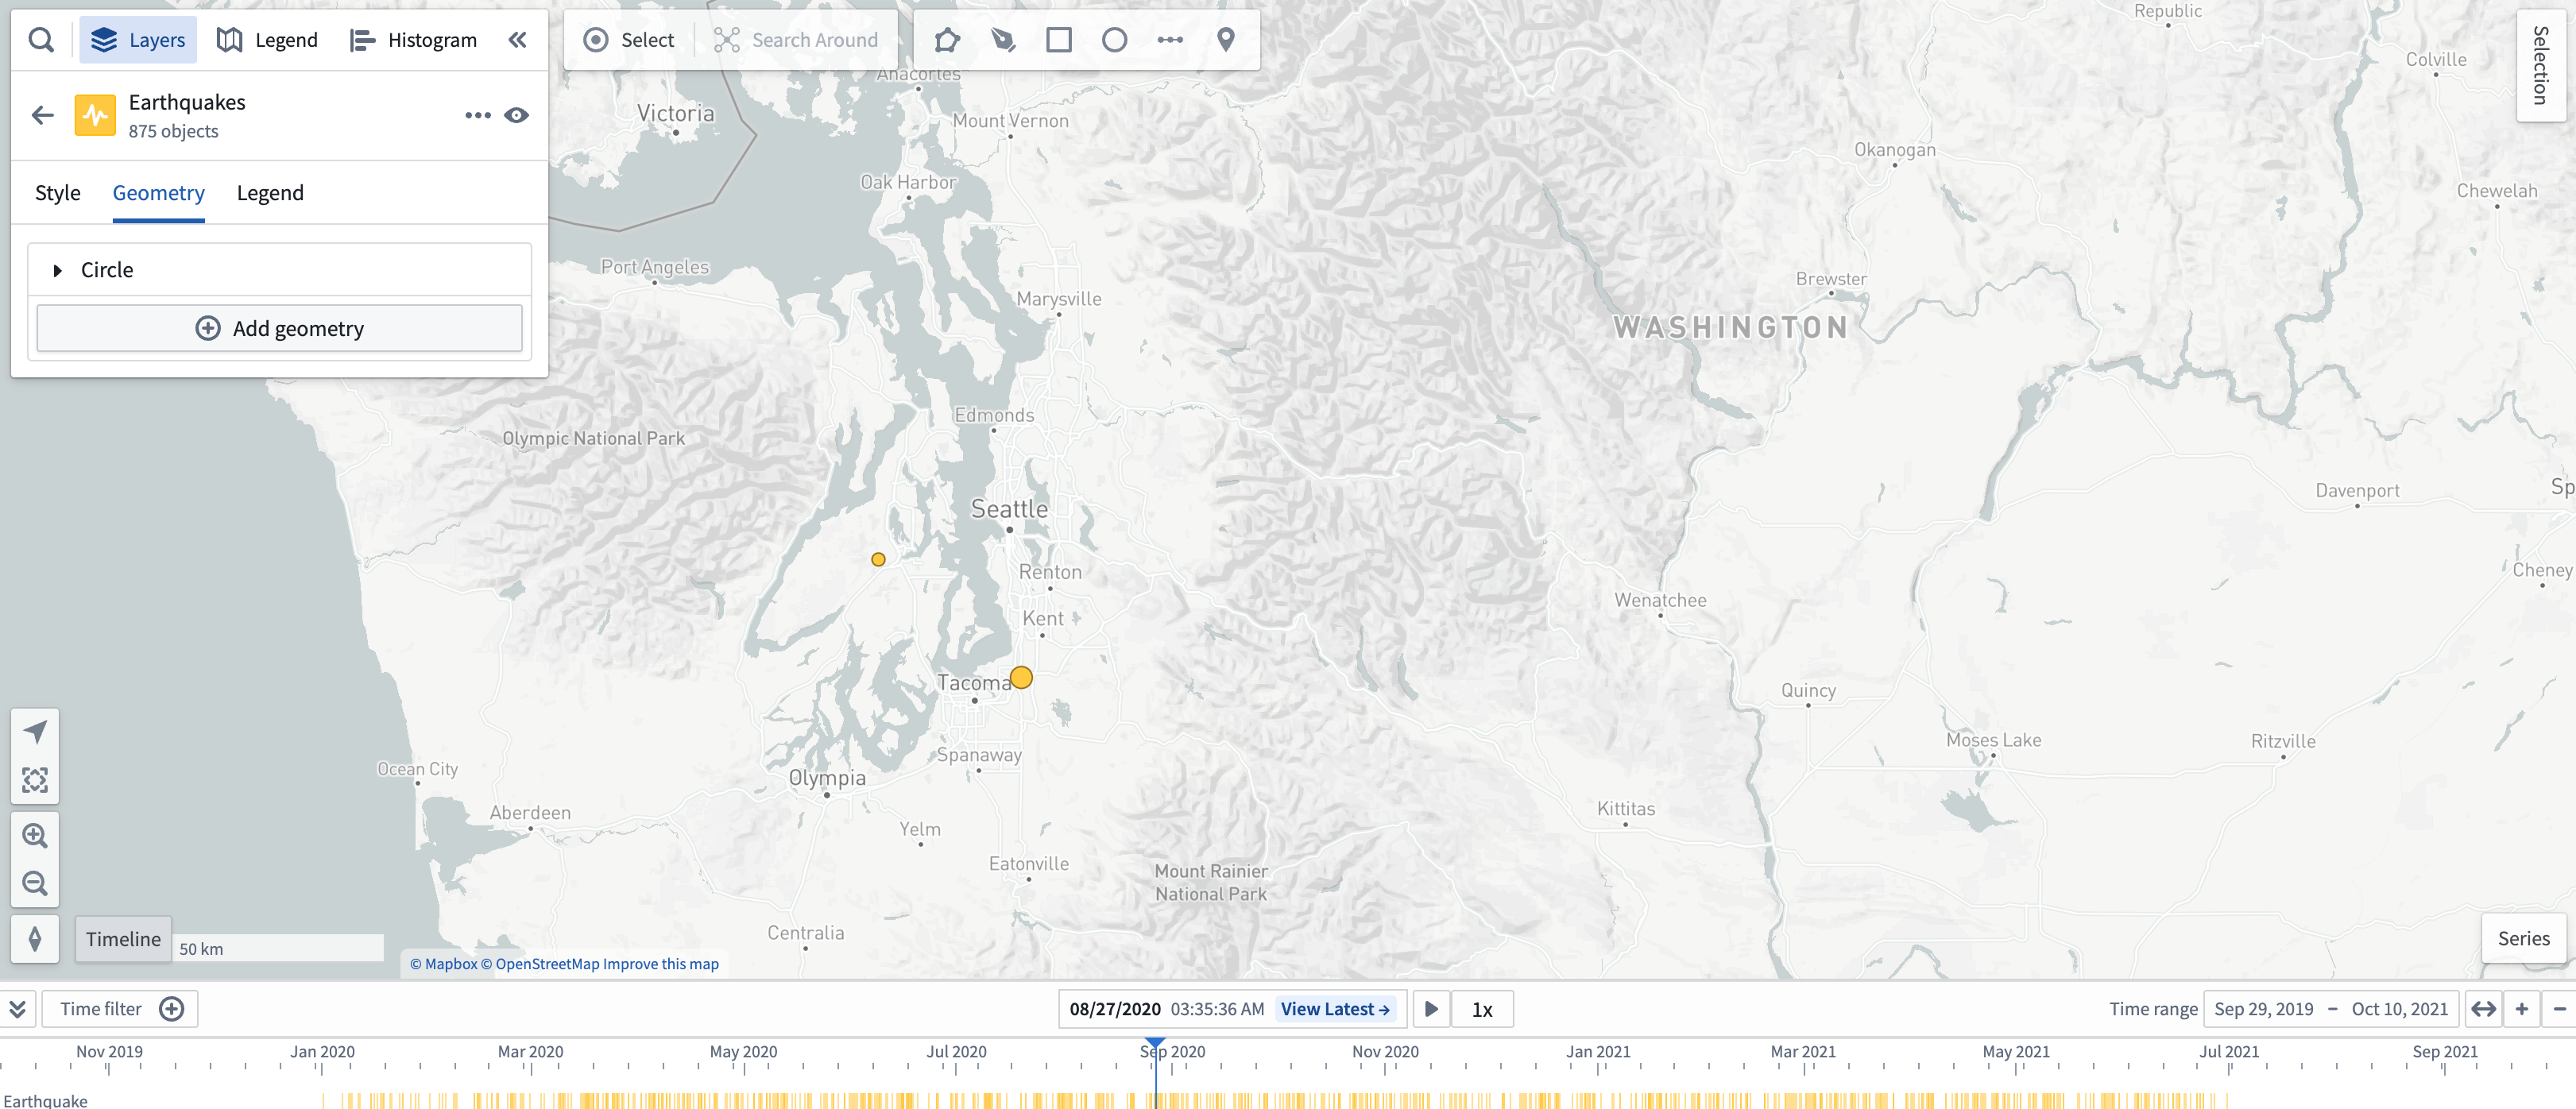
Event objects automatically populate an event layer in the timeline and can be styled by adding a timeline geometry with the same start and end time as the event object's start and end time. There are additional display options available in the Style section of the left panel:
- Shape: Uses a start and end time property to draw a bar by default. An object type's start and end time are configured in Ontology Manager's Capabilities tab.
- Color: Select Color to shade your event object's icons using a Fixed color, Function, Property, or Linked sensor.
If you add a timeline geometry in the Layers panel, it will override this event layer's appearance in the timeline. However, the event's start and end time can still be used for opacity-based styling on the map.
Use event objects for styling
You can style event objects on your map so they are only visible when the current time selection overlaps with the time period of the event. Use this to make your map responsive over time and show only the event objects that are currently relevant. Learn more about using event objects for styling.
Linked events
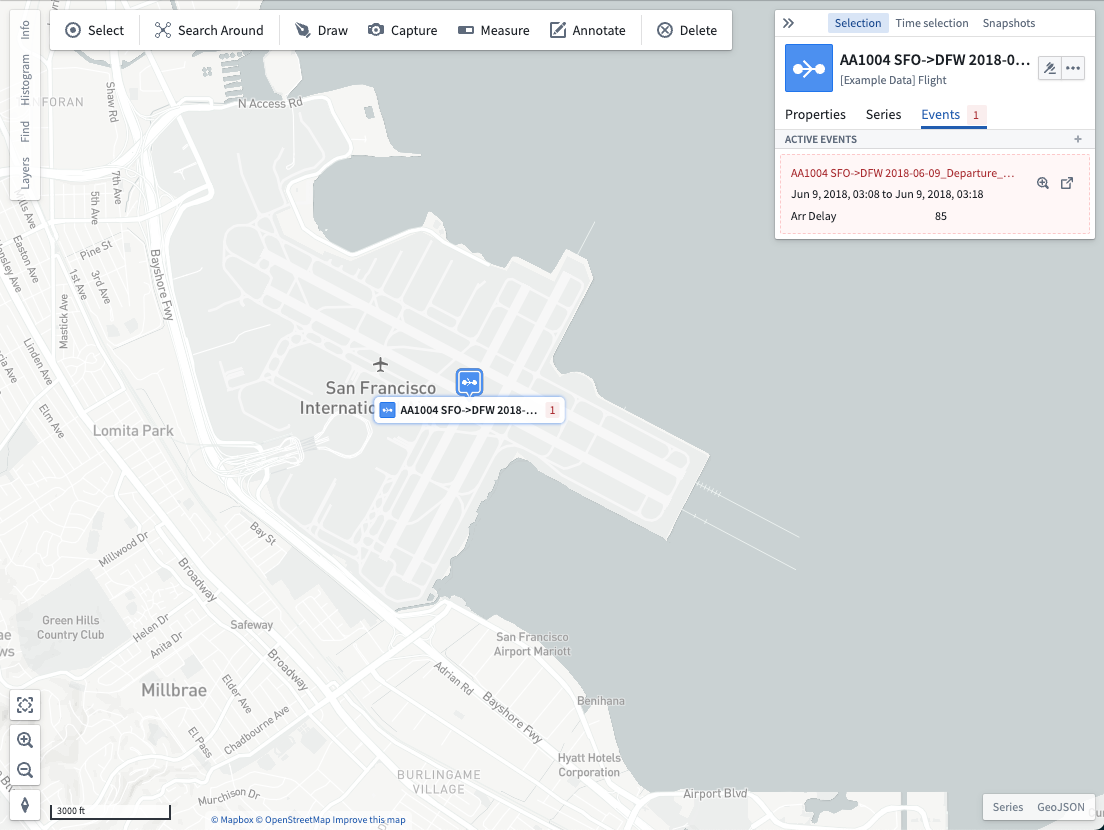
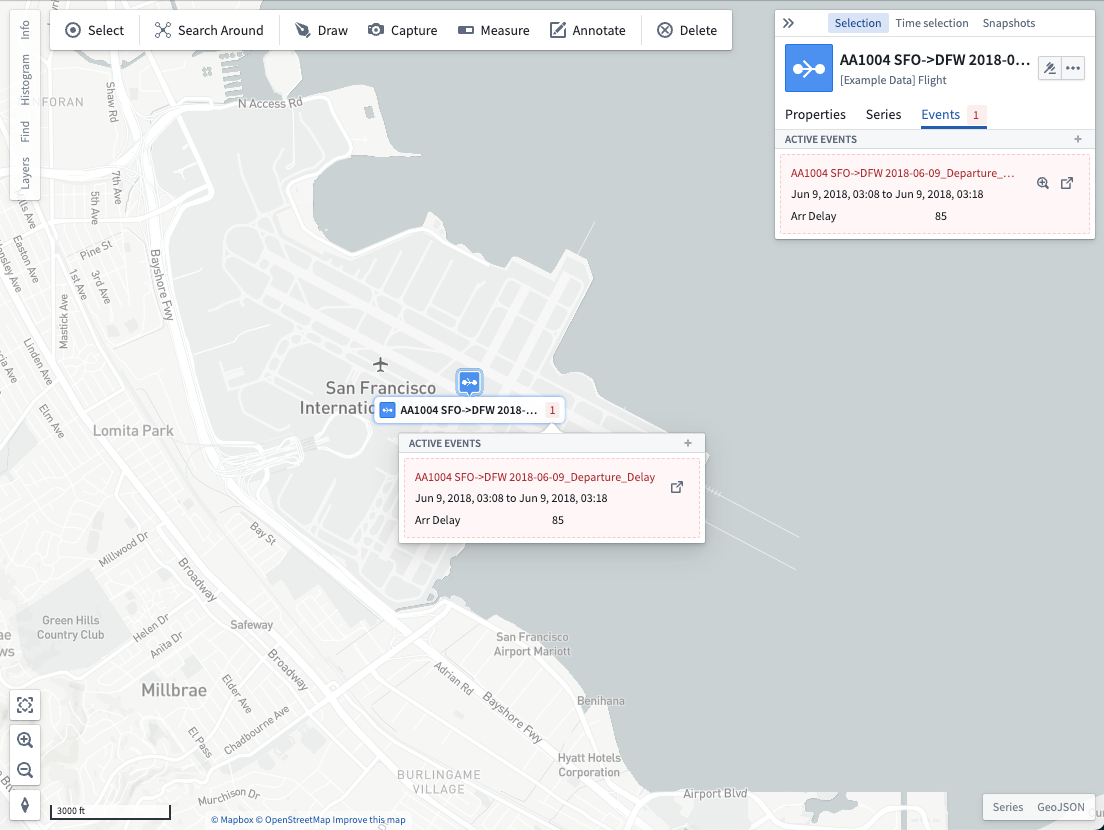
A linked event is an event object linked to another object. On the map, you can view those linked events by selecting the object and opening the Events tab. If the currently selected time lies between the start and end times of an event, the event will appear in the Active events section. Otherwise, the event is considered inactive and can be shown by using the Show inactive events option.
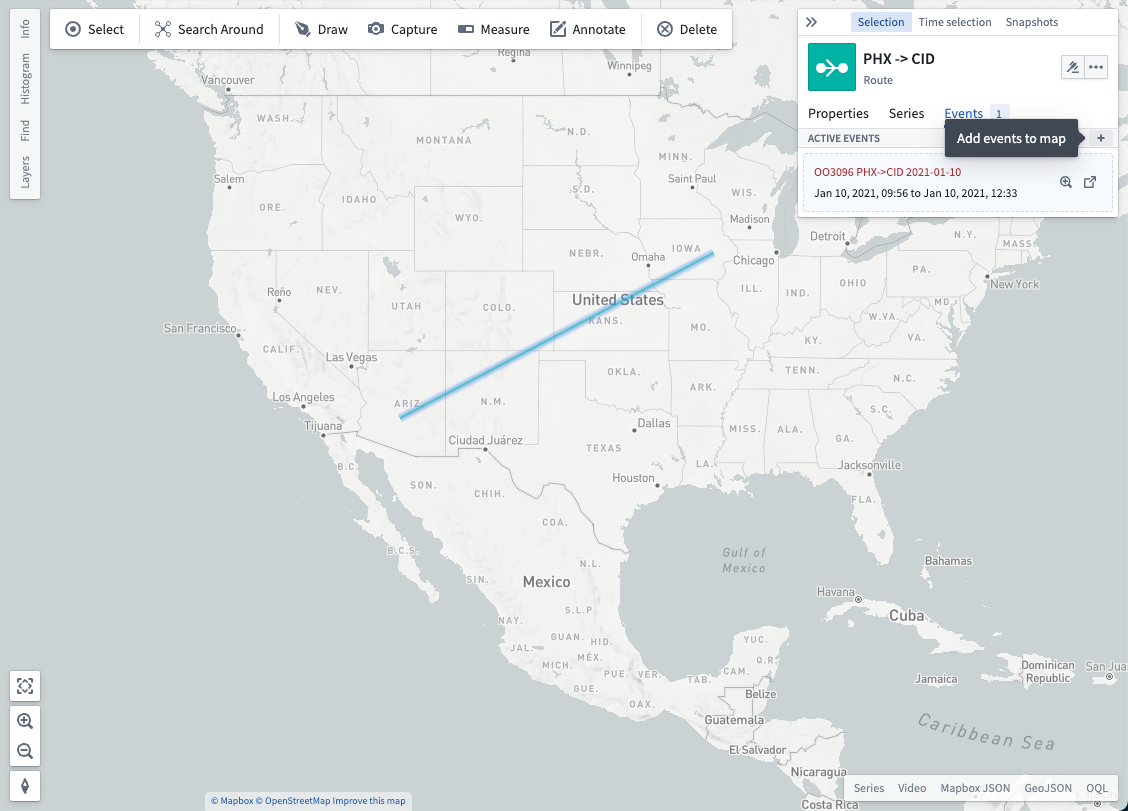
When the linked events are of a geospatial object type click + to add them to your map:
Each event has corresponding actions you may take:
- Set the selected time window to match the time endpoints of the event with the
 icon.
icon. - Open the event in Object Explorer with the
 icon.
icon.
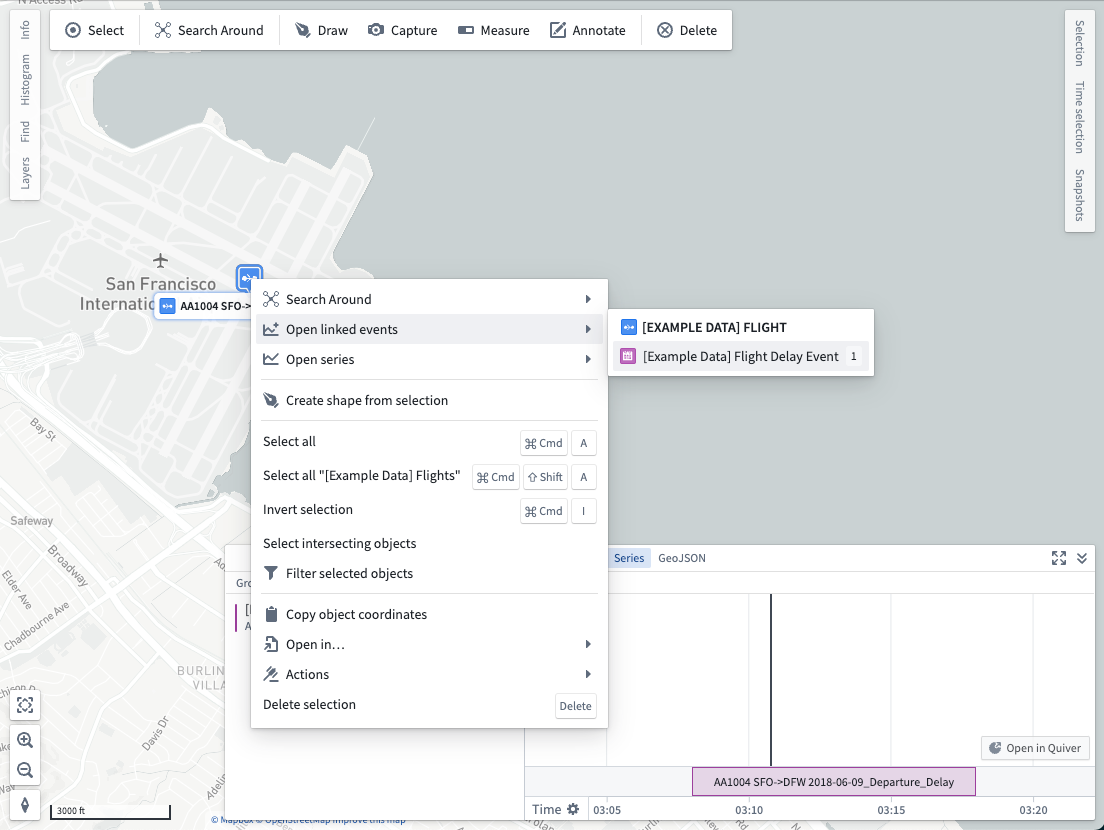
Show on series panel [Planned deprecation]
Right-click on an object and select Open linked events to open and add linked events to the series panel. Analyze your time series data in the context of important periods of time, and adjust the time selection so the map reflects a time of interest.
Show counts in labels
If you enable labels for a layer, a count of active events also displays in the label for each object. Hover over the active event count to view the active events:
Timeline geometries
Defined by an event object's paired timestamp properties, timeline geometries render as event layers in a map's timeline and can be styled by an object property. Timeline geometries offer additional custom style options when compared to event objects rendered as a map layer.
Learn more about adding and configuring timeline geometries on your map.