View results
The Results View displays objects from your exploration in a tabular view. To load more objects into the table, scroll down.
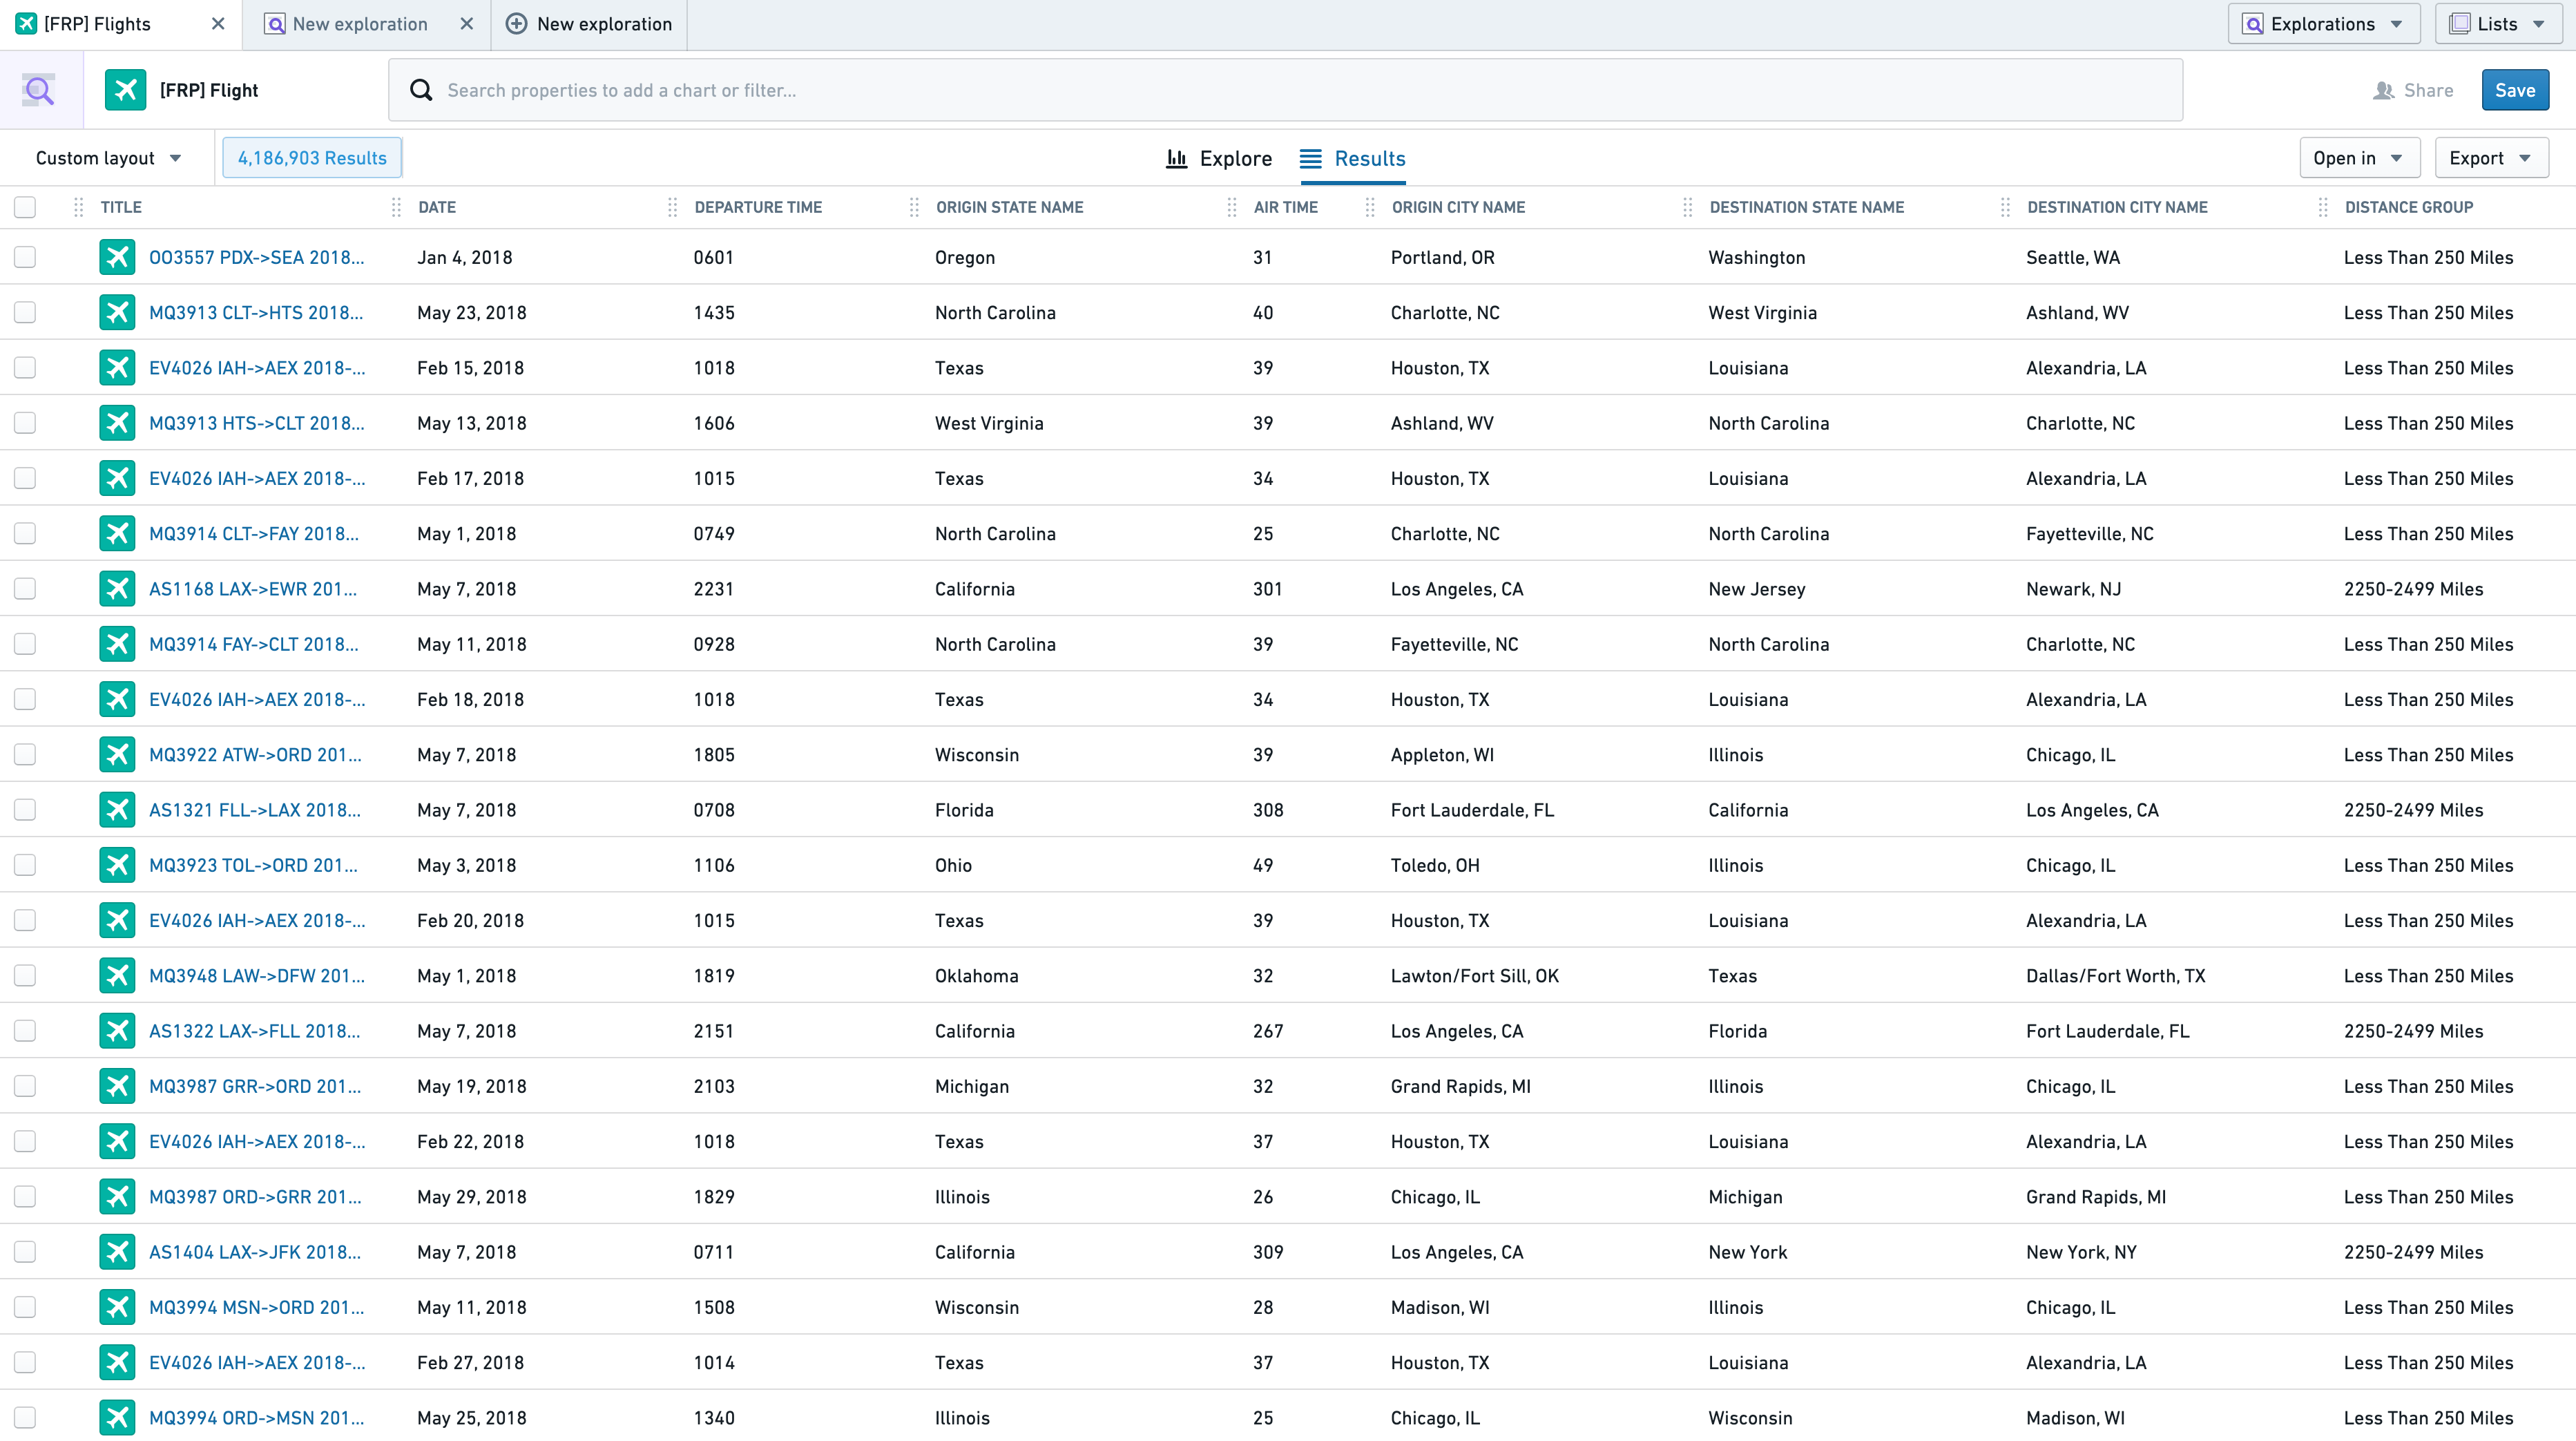
Sorting Table by Column
The results table can be sorted by properties with the Sortable renderHint applied. To sort by a specific column, click the dropdown arrow in the column header.

Once a column is used for sorting, it will display a sorting icon in its header. If multiple columns are chosen for sorting, the last one selected takes precedence. Previous sorts have a number next to their sorting icon to show the sort order, as below.

Select “Clear All Sorts” from the dropdown to reset your sorts to their original state.
Configuring Columns
Changing Column Order
Columns can be re-ordered by dragging the handle icon on column headers.

Users can select the “Freeze X columns” option from a column header dropdown to keep the X leftmost columns visible while scrolling to the right in the results table. The checkbox column is included in the count.
Resizing Columns
To resize a column, drag the right side of the column header to the desired width. This boundary, highlighted blue, is just to the right of the configuration dropdown.

Adding and Removing columns
To hide an individual column, select the “Hide this column” option from the column header dropdown.
To reorder and configure multiple columns at once, select “Configure columns” to open the following menu.
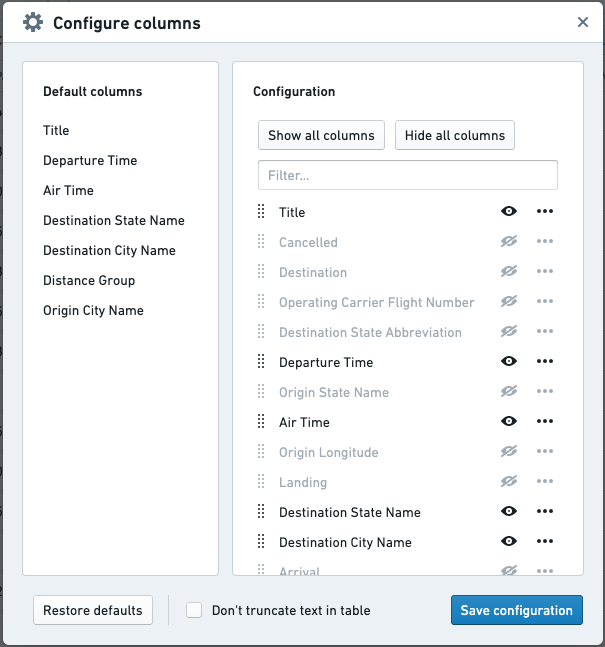
The left-hand panel shows default columns for the table, while the right-hand panel displays the current order and visibility for all possible columns. Hide or add all columns using the shortcut buttons, or search for a specific column with the search bar at the top to toggle visibility.
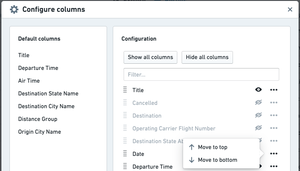
Change column order by dragging the columns to the desired locations, or move the columns to top or bottom using the menu below.
Selecting “don’t truncate text in this table” will cause text properties to wrap to the next line if they cannot be displayed in the existing column width.
Save your configuration with the button in the bottom right. Administrators can update the default configuration for this table by saving the current view as a new layout and setting it as the default for all users. Learn more about updating the default configuration.
Previewing Results
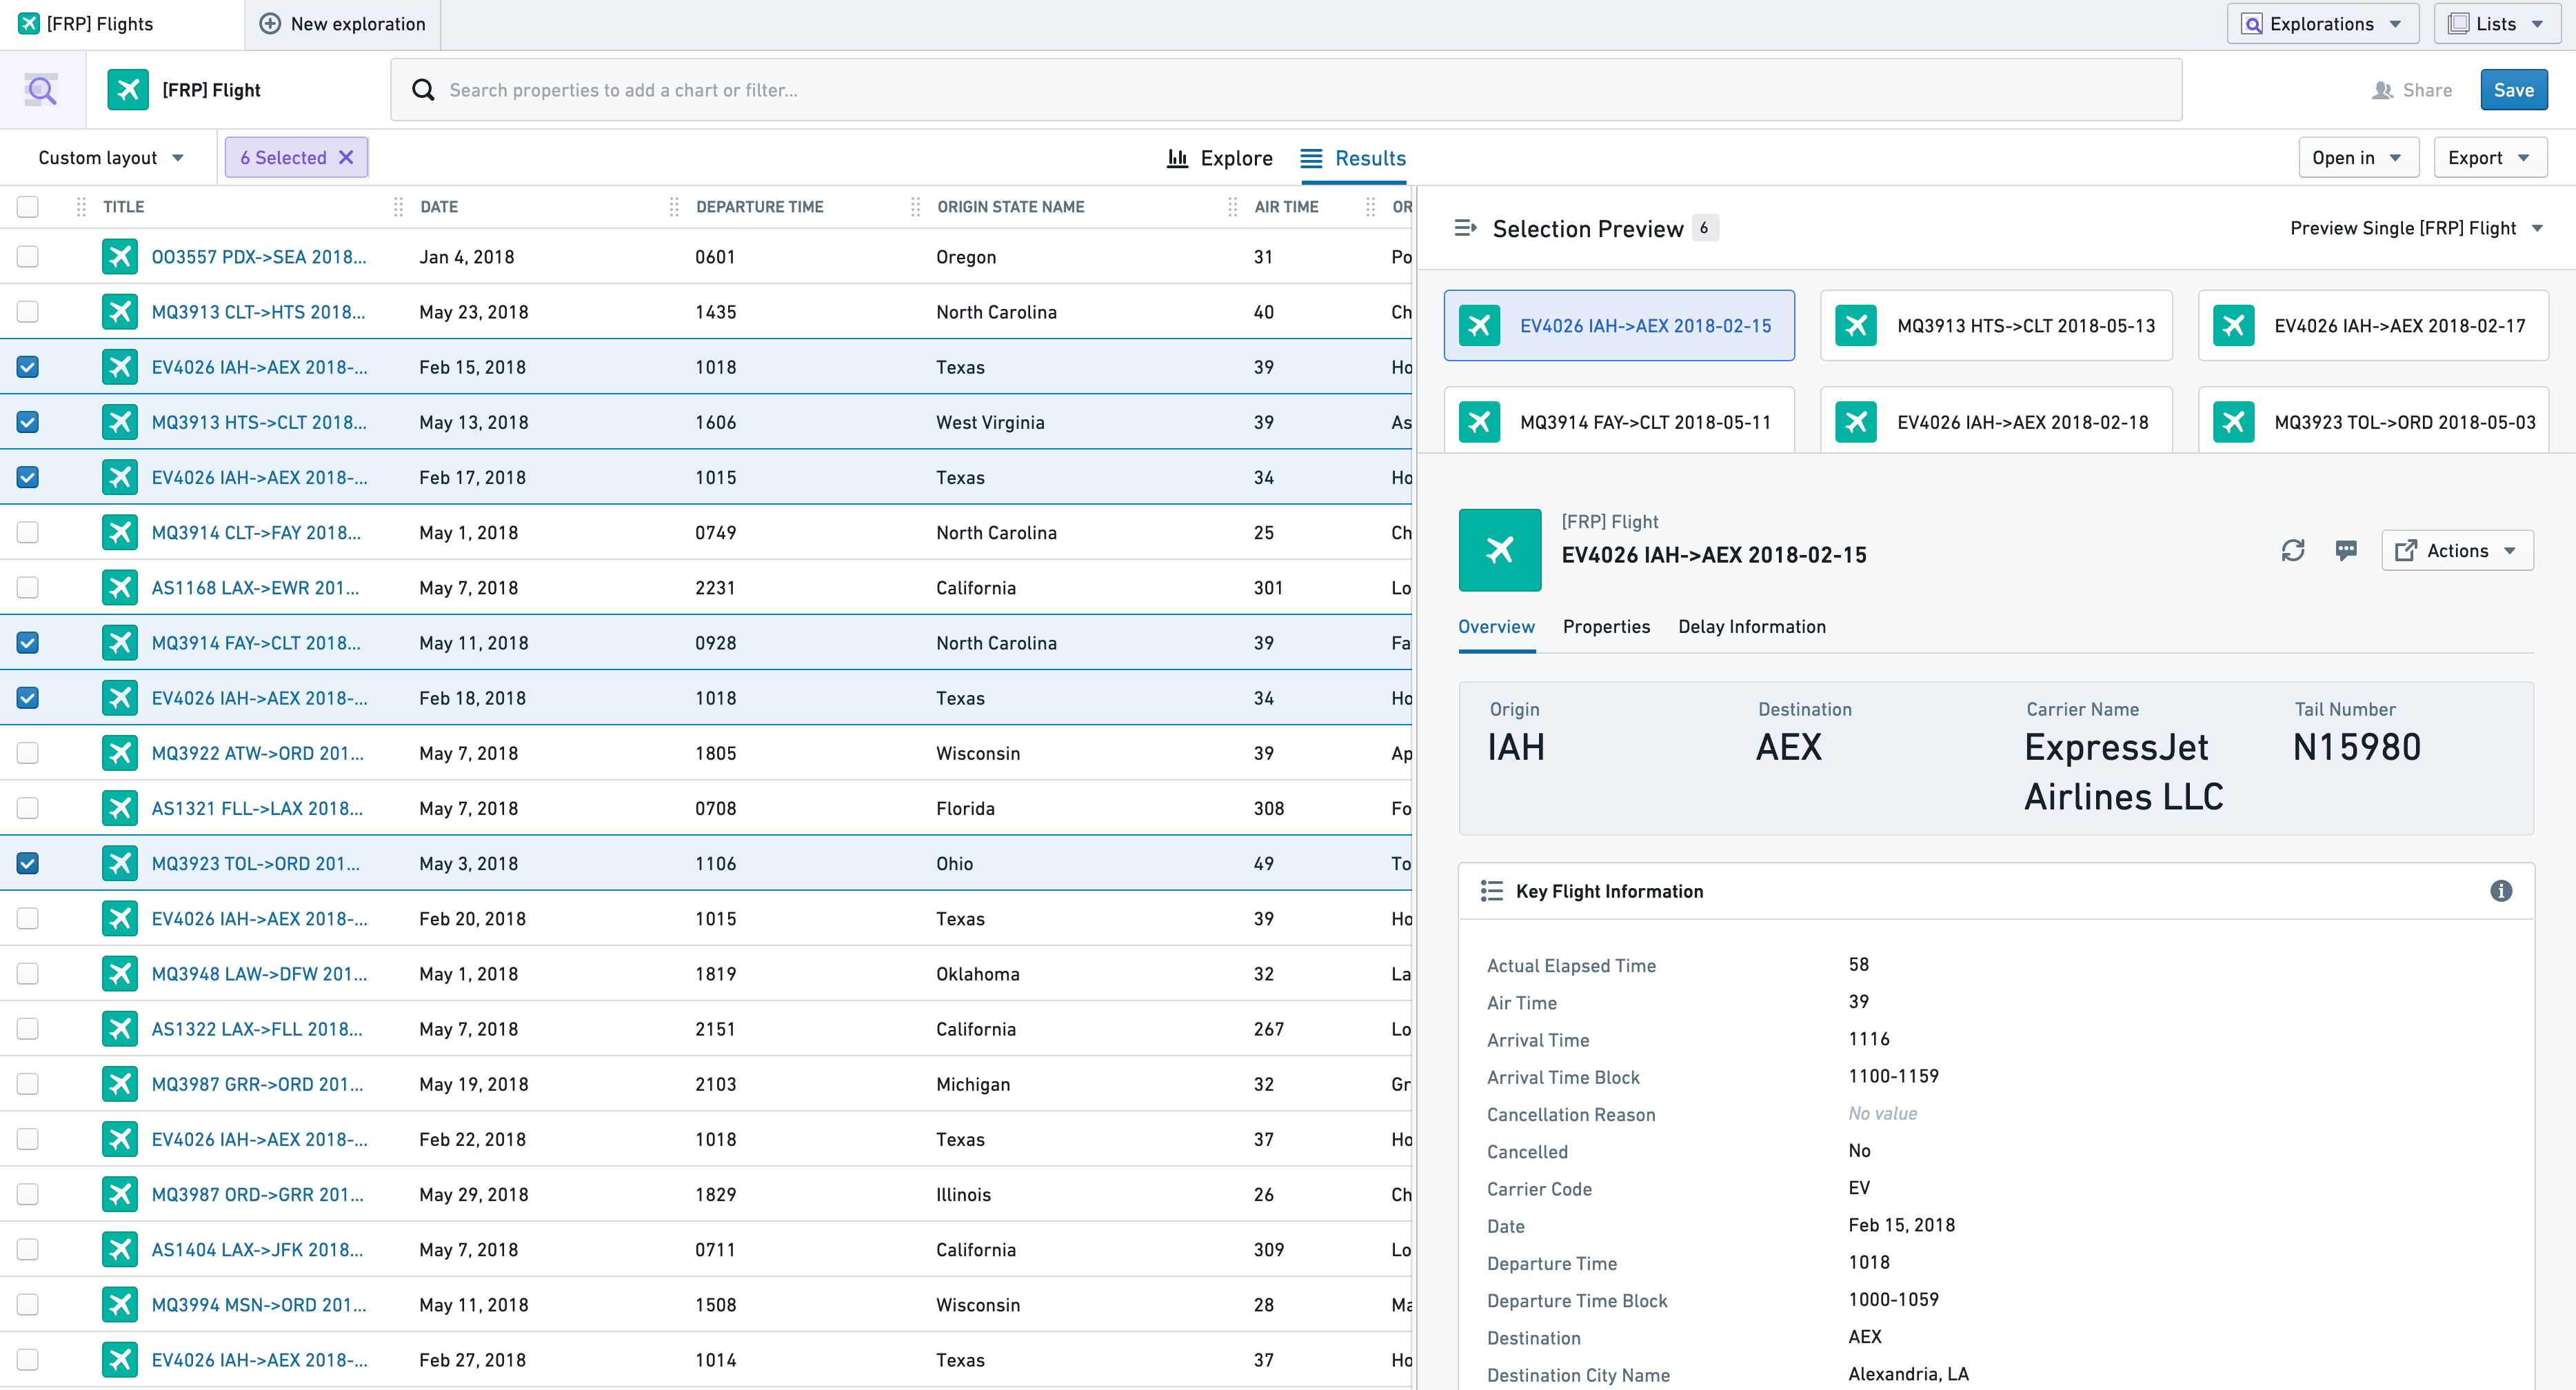
To open the object view for an object in a new Object Explorer tab, click the Title column for that object’s row. To open a preview of the object view in your Results tab, select one or more objects by clicking the checkbox or any other column in the corresponding row.
After selecting an object, the Selection Preview panel will open from the right. To close this panel for a full table view, use the "collapse" icon (![]() ) on the top left of the panel.
) on the top left of the panel.
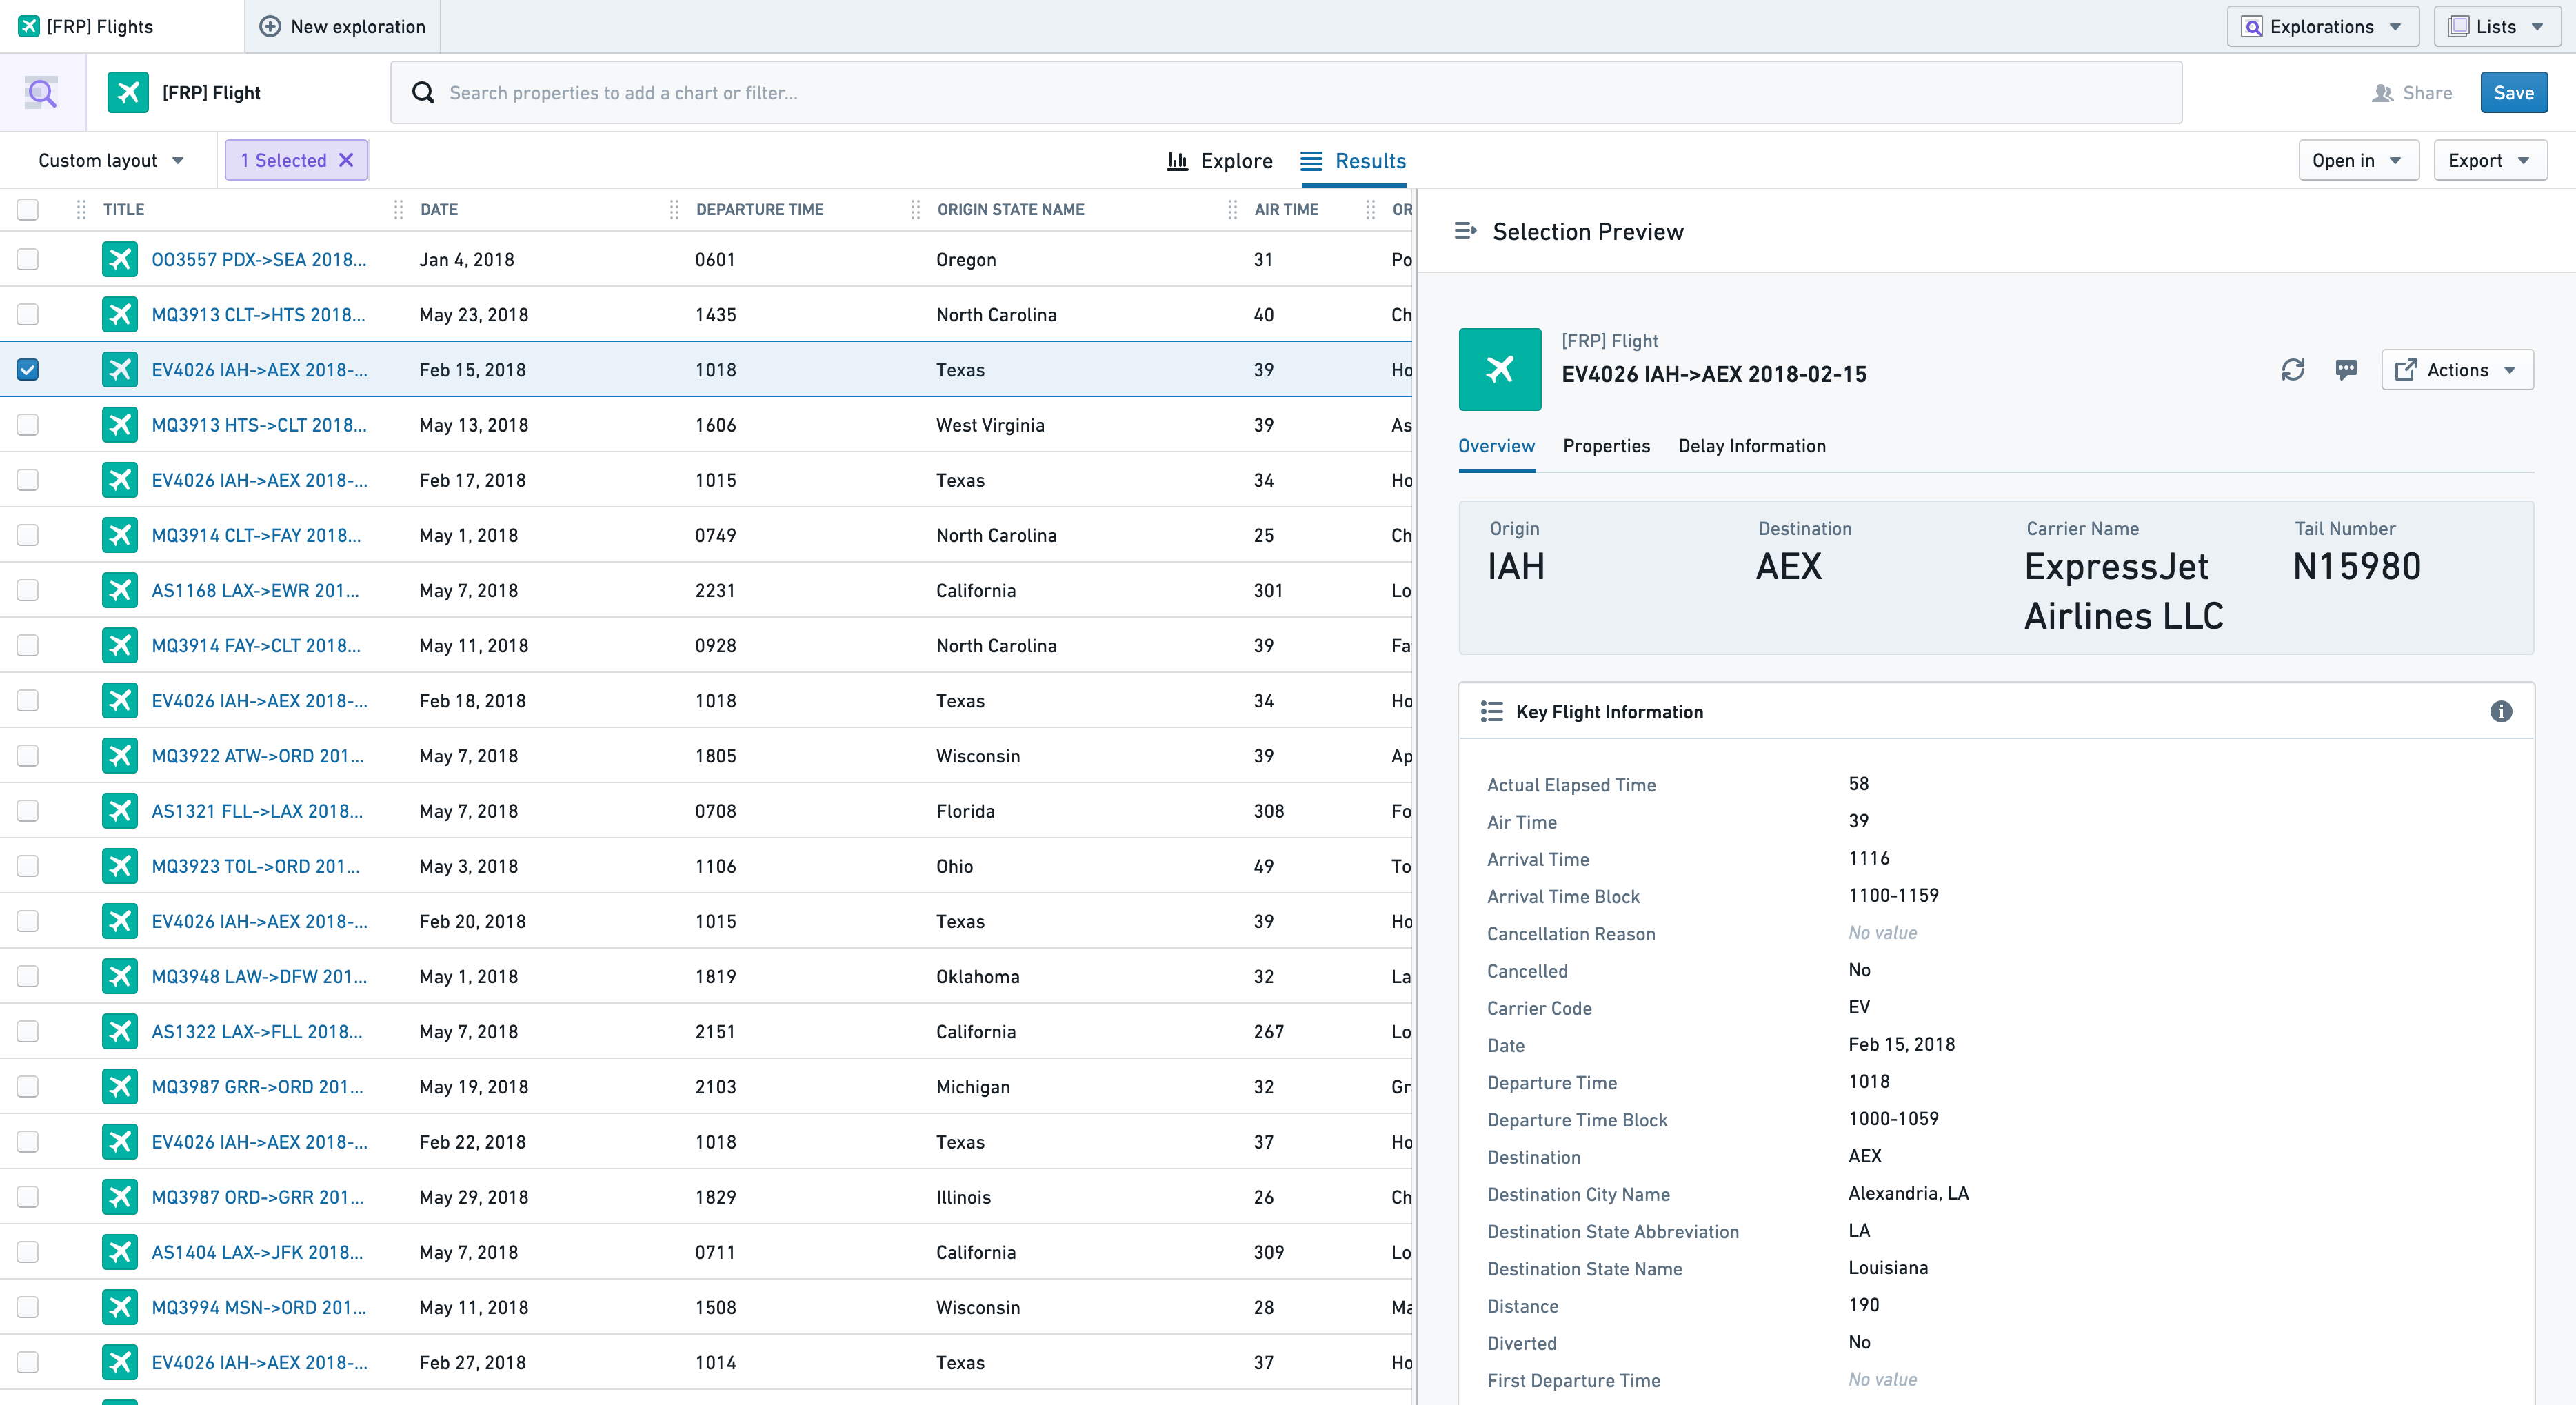
If multiple objects are selected, the object view for any of the first twenty is available for previewing, displayed in a list of cards above the object view.
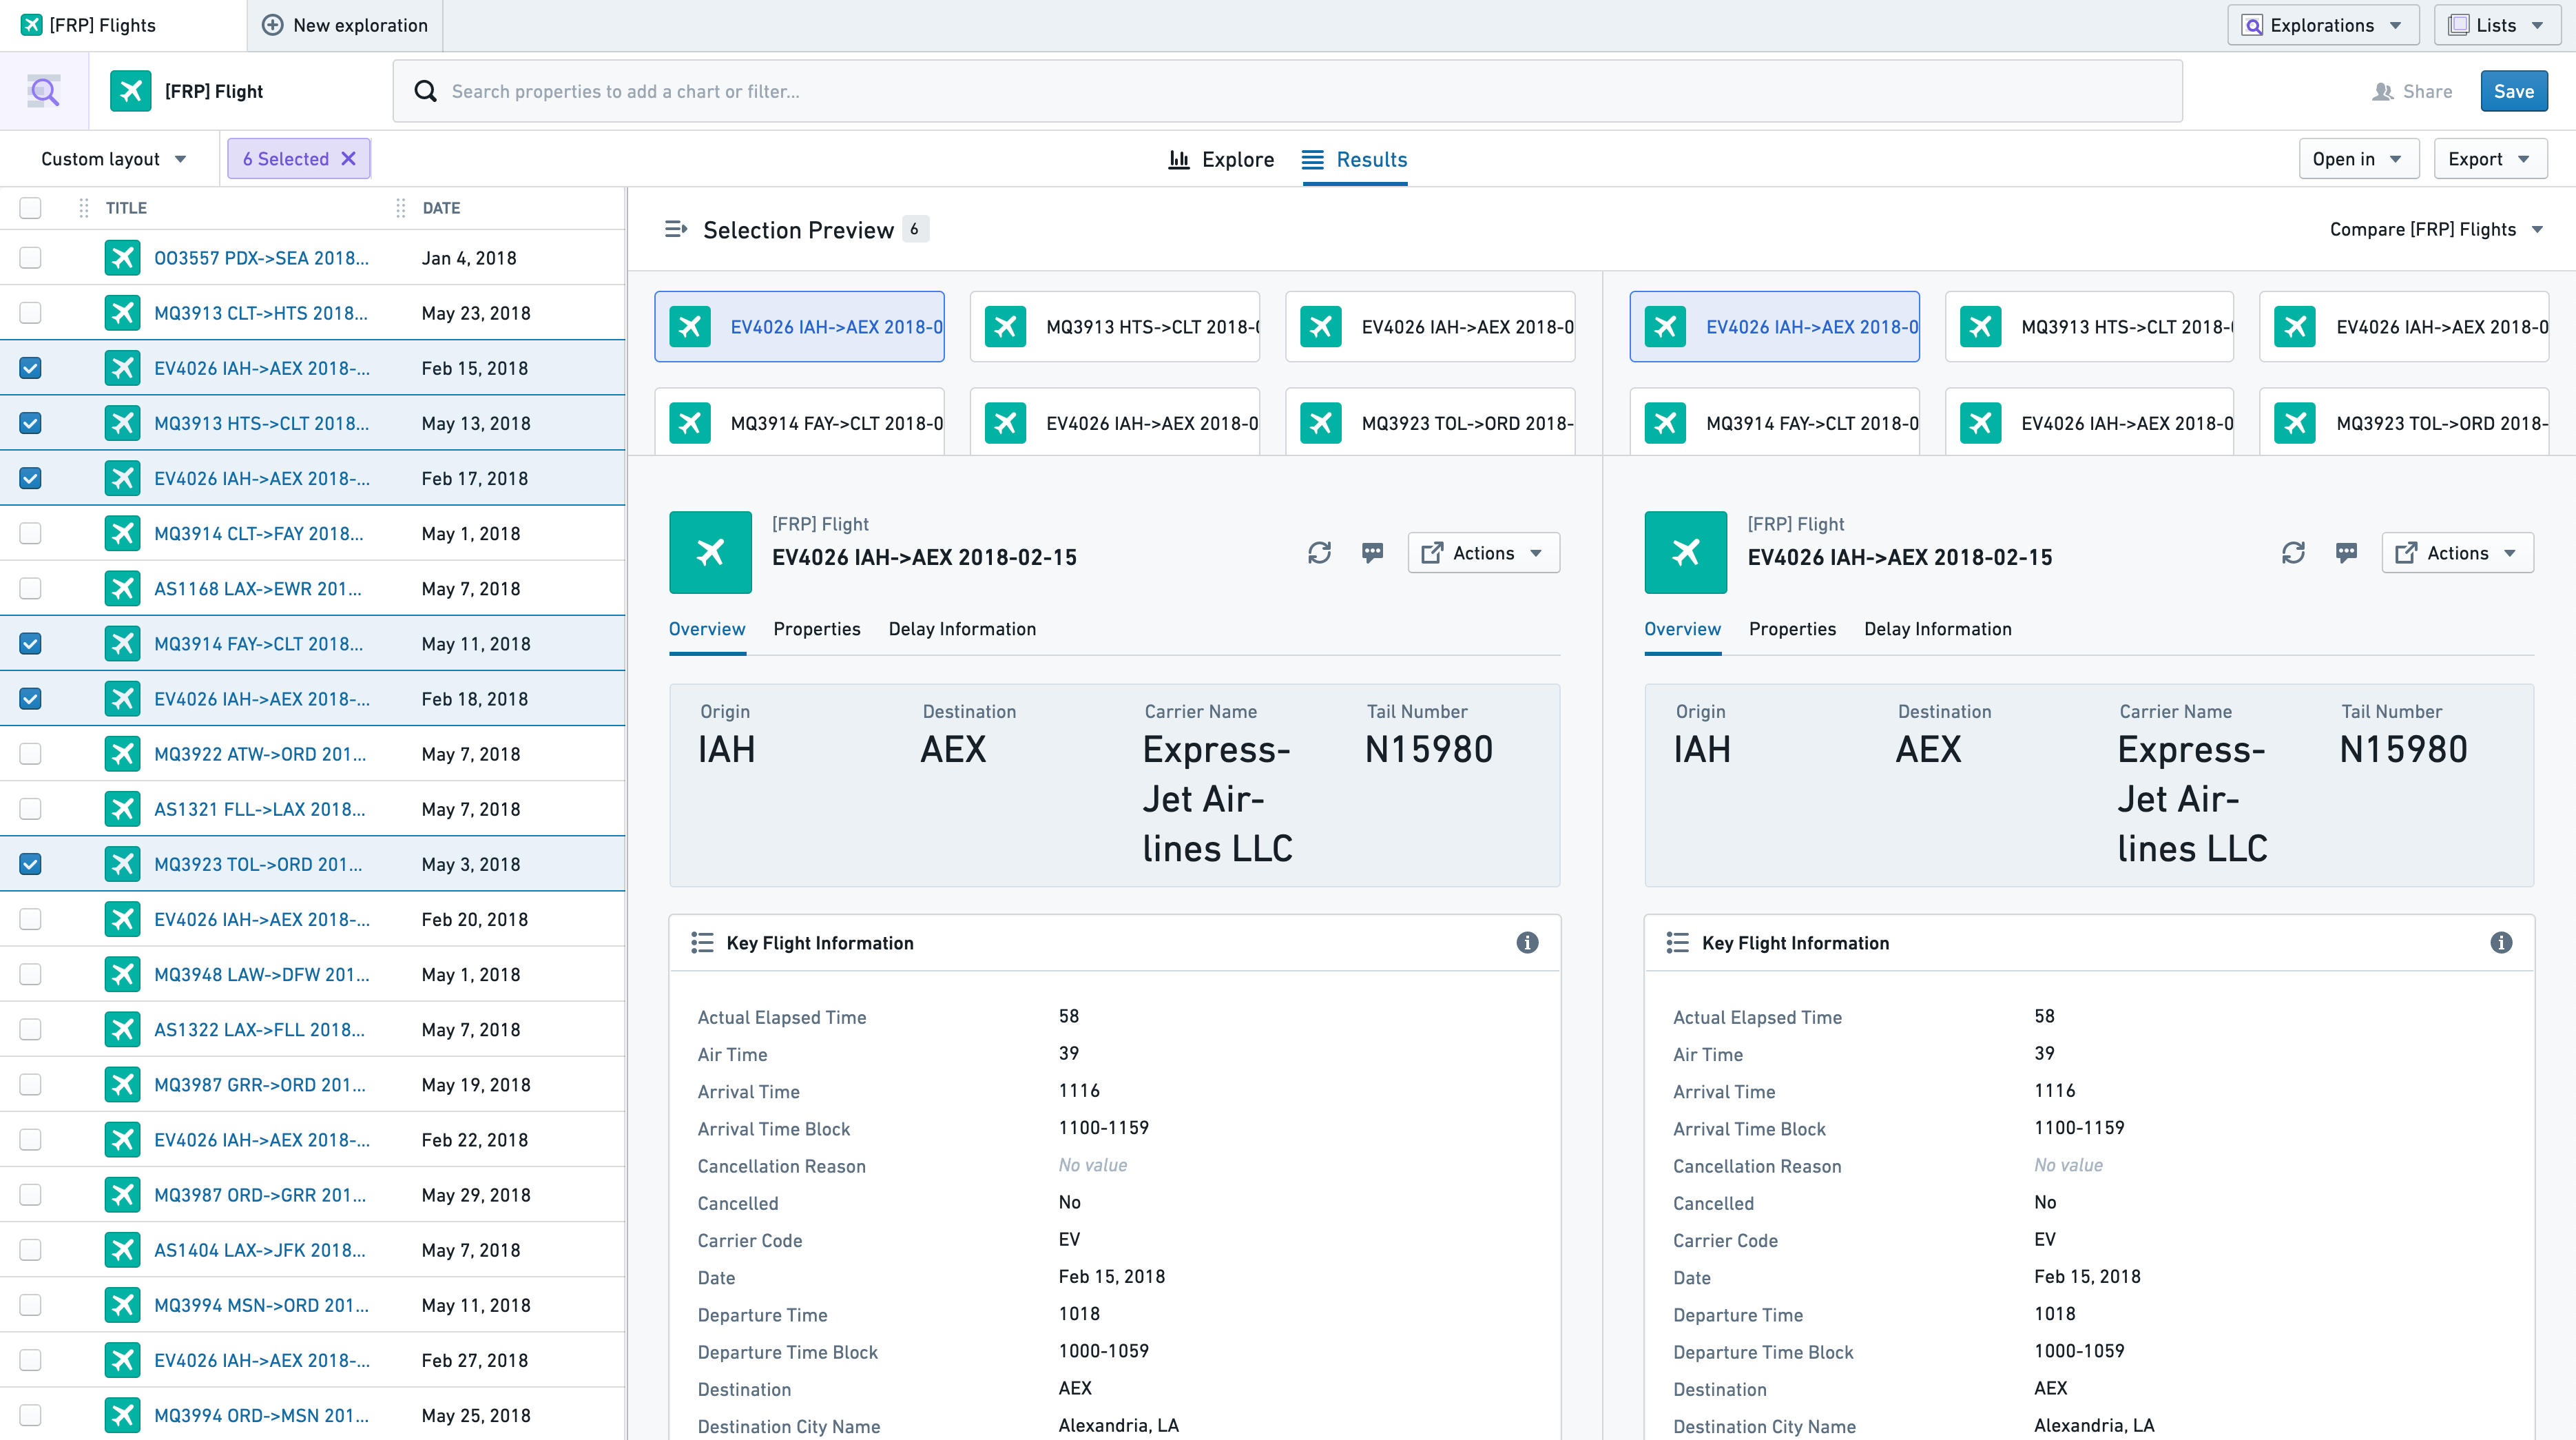
To compare object views for two objects at once, select the top right dropdown and choose “Compare objects”.
Viewing time series properties
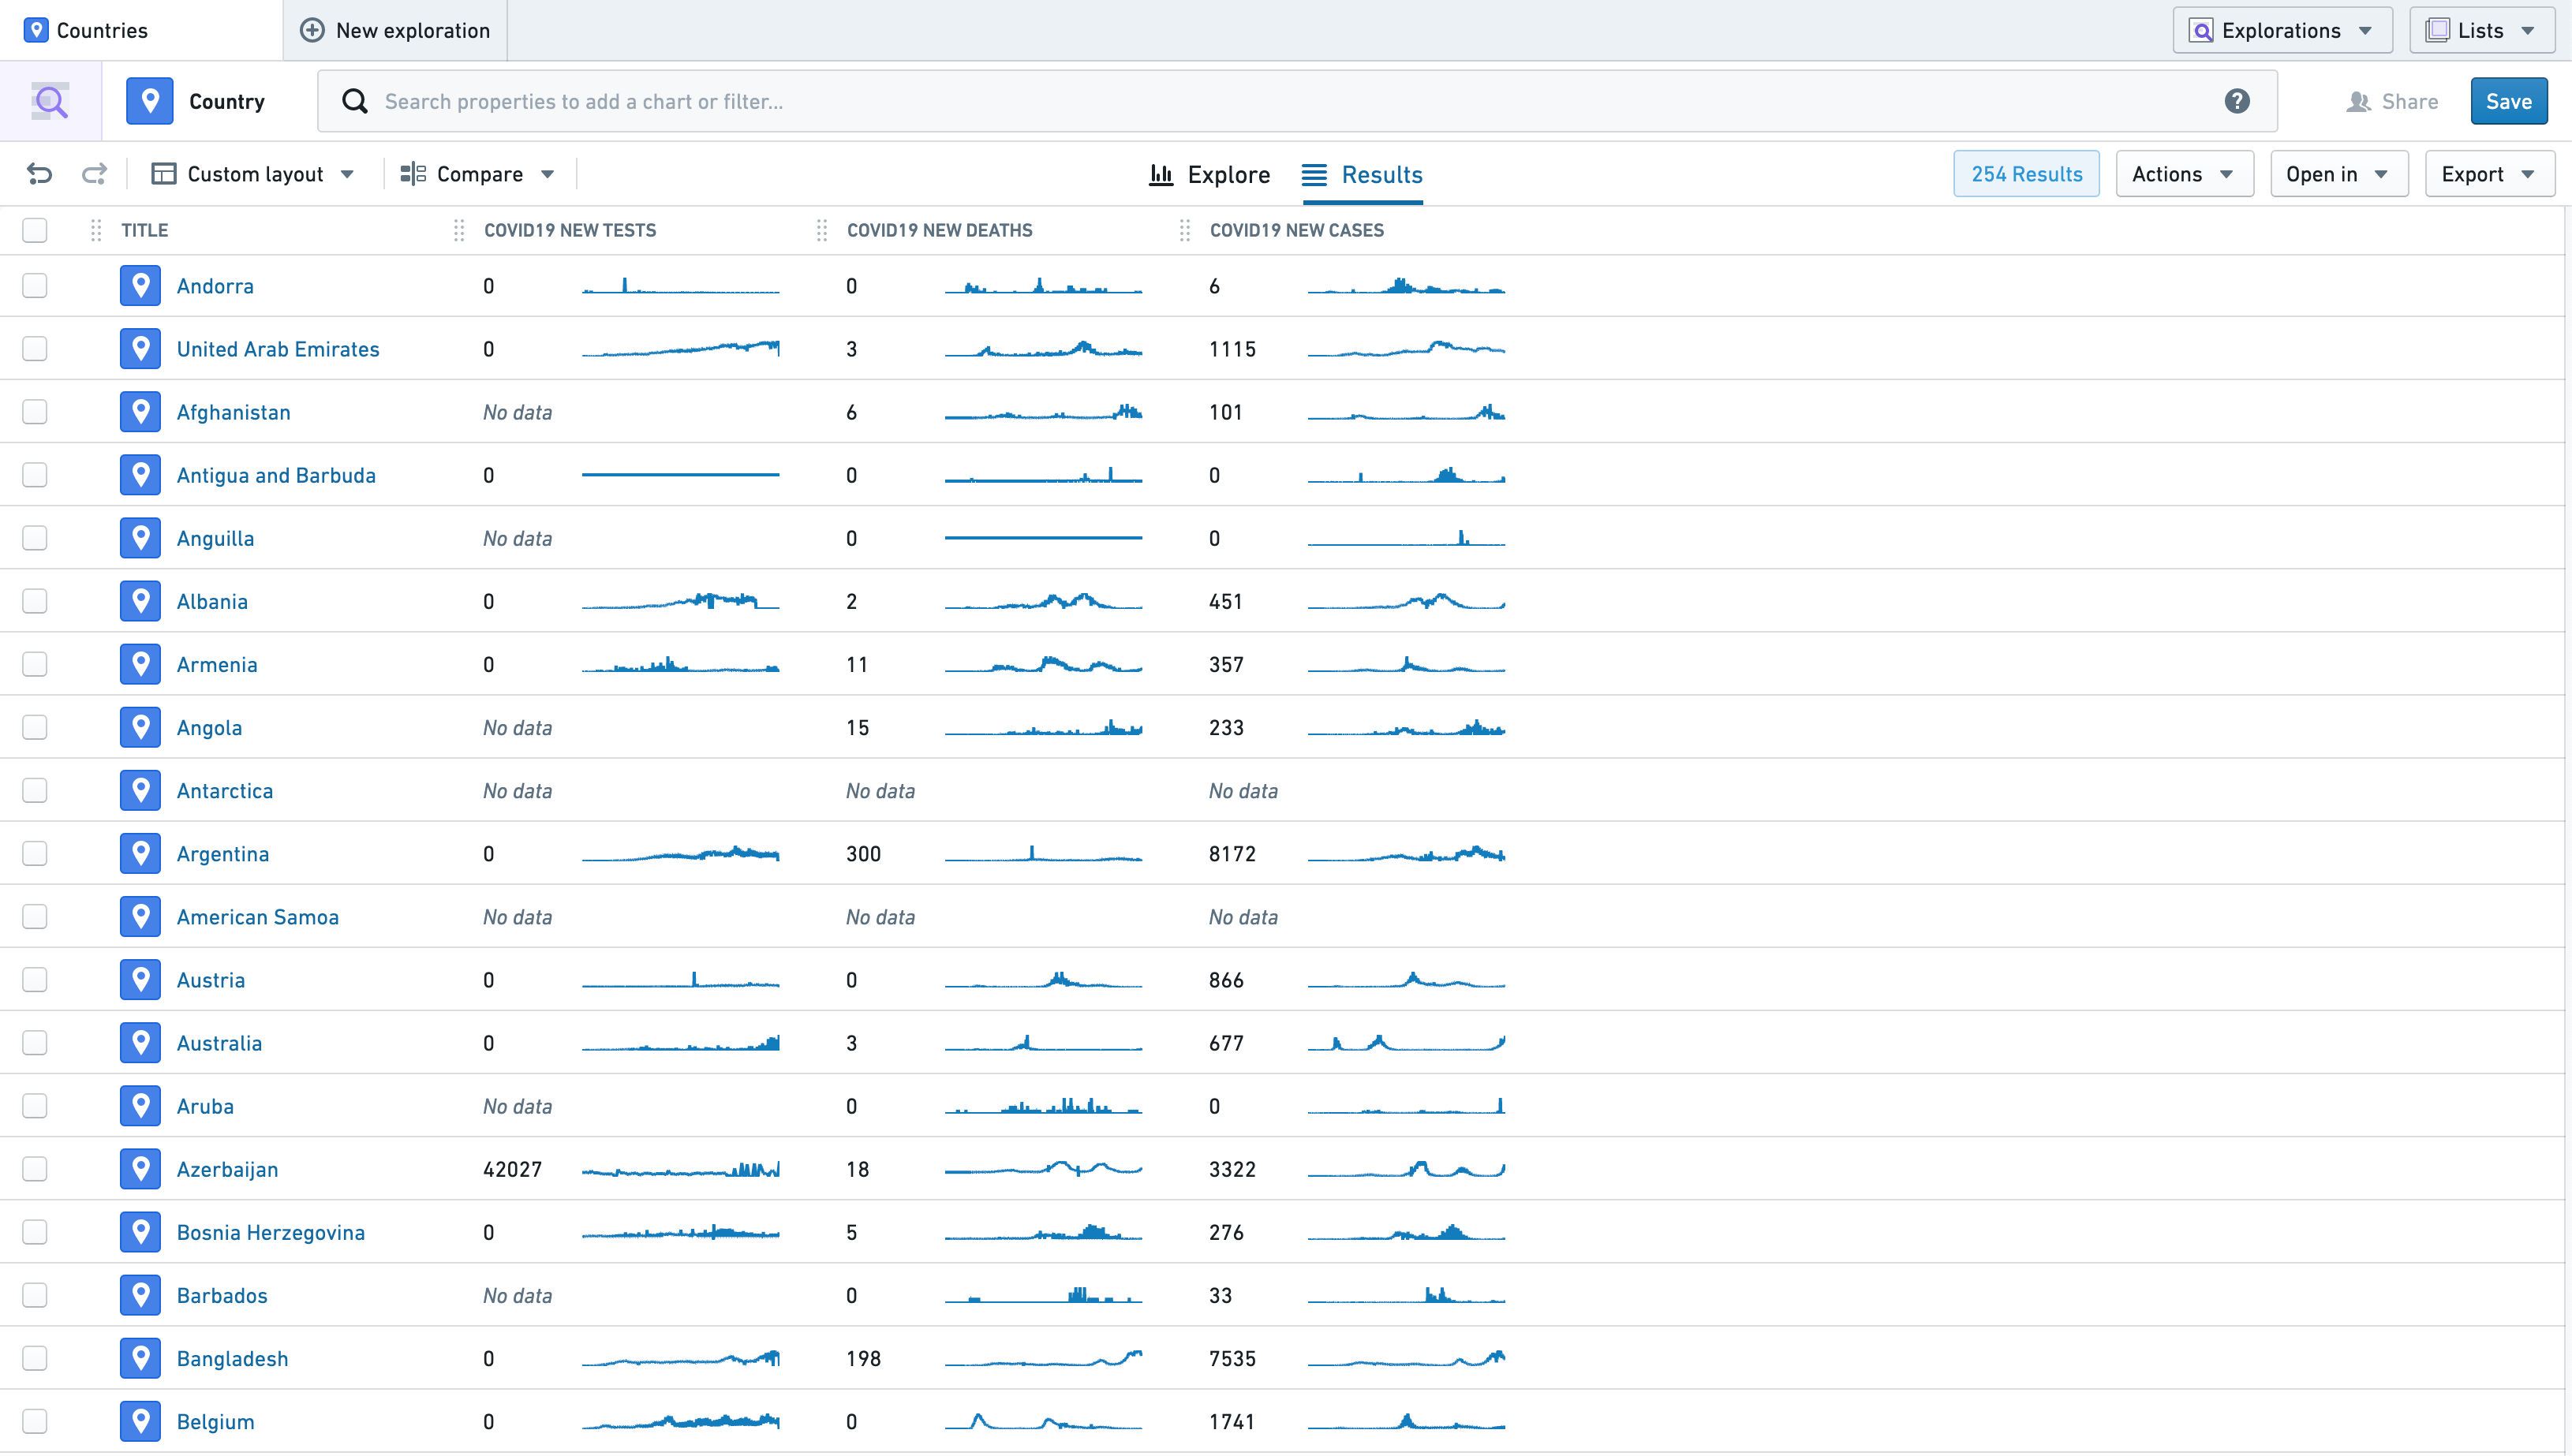
Time series properties can be viewed alongside regular properties in the Results View. A time series property is an object property which stores a history of timestamped values. Learn more about time series properties.
In the example below, the Results View displays the Country object, which contains three time series properties: COVID19 New Tests, COVID19 New Deaths, and COVID19 New Cases. Each column displays the most recent observation in the time series on the left, and a sparkline visualizing the history of the time series on the right.
Inline edits
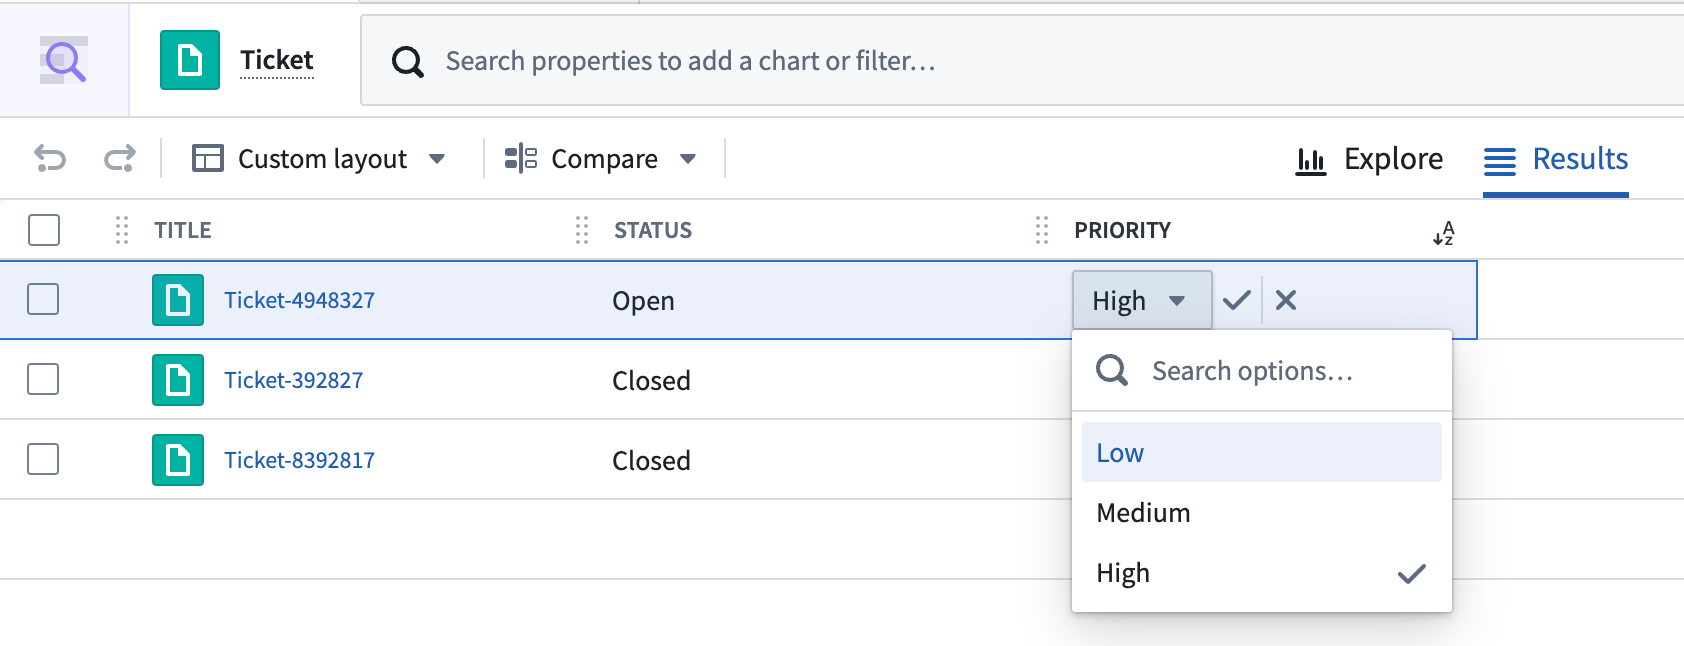
Properties that are configured with an inline edit action can be directly edited in the Object Explorer results page. Once a user meets the submission criteria of the inline edit action, a pen appears next to the value on hover. Clicking on the value enables an editable field, depending on the type of the property. To submit, the submission criteria need to be passed again, otherwise the submission button is not selectable.