- Capabilities
- Getting started
- Architecture center
- Platform updates
Visualize Ontology data
A map's primary capability is to enable visualization and analysis on geospatial data from your Ontology. Once you have added objects to your map, you can configure styling configuration to represent various properties of your objects. At a high level, an object layer contains multiple displays (for example, icons, lines, polygons) that represent the objects on the map. Each display can be styled to represent different properties of the objects, such as color, size, and opacity.
Edit layer styling
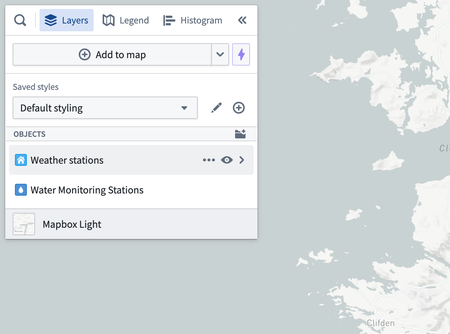
To edit the style of a layer, select a layer entry from the Layers panel. The layer details panel will open with multiple sections as tabs:
- Style: Configure the appearance of individual displays, or define default settings that can be applied to multiple displays.
- Legend: Control how the style information for this layer is displayed in the Legend panel.
Layer style
The Style section allows you to configure Shared Defaults that apply to all displays in a layer. The default color and opacity can be linked to specific displays to share consistent styling. See the Value based styling and Opacity styling sections for more information on how to configure the color and opacity.
Displays
An object layer can contain many displays, each of which is a different way of representing the layer's objects on the map or in the timeline. By combining multiple displays, you can create complex visualizations to represent multiple properties at once and provide a more detailed view as you zoom in. The various display types available are:
- Icons and circles: Placed according to a geopoint property.
- Lines and polygons: Based on a geoshape property or multiple geopoint properties.
- Track lines, breadcrumbs, and heatmaps: Helps visualize objects that move over time.
You can add a new display using the Add display option below the Style section.
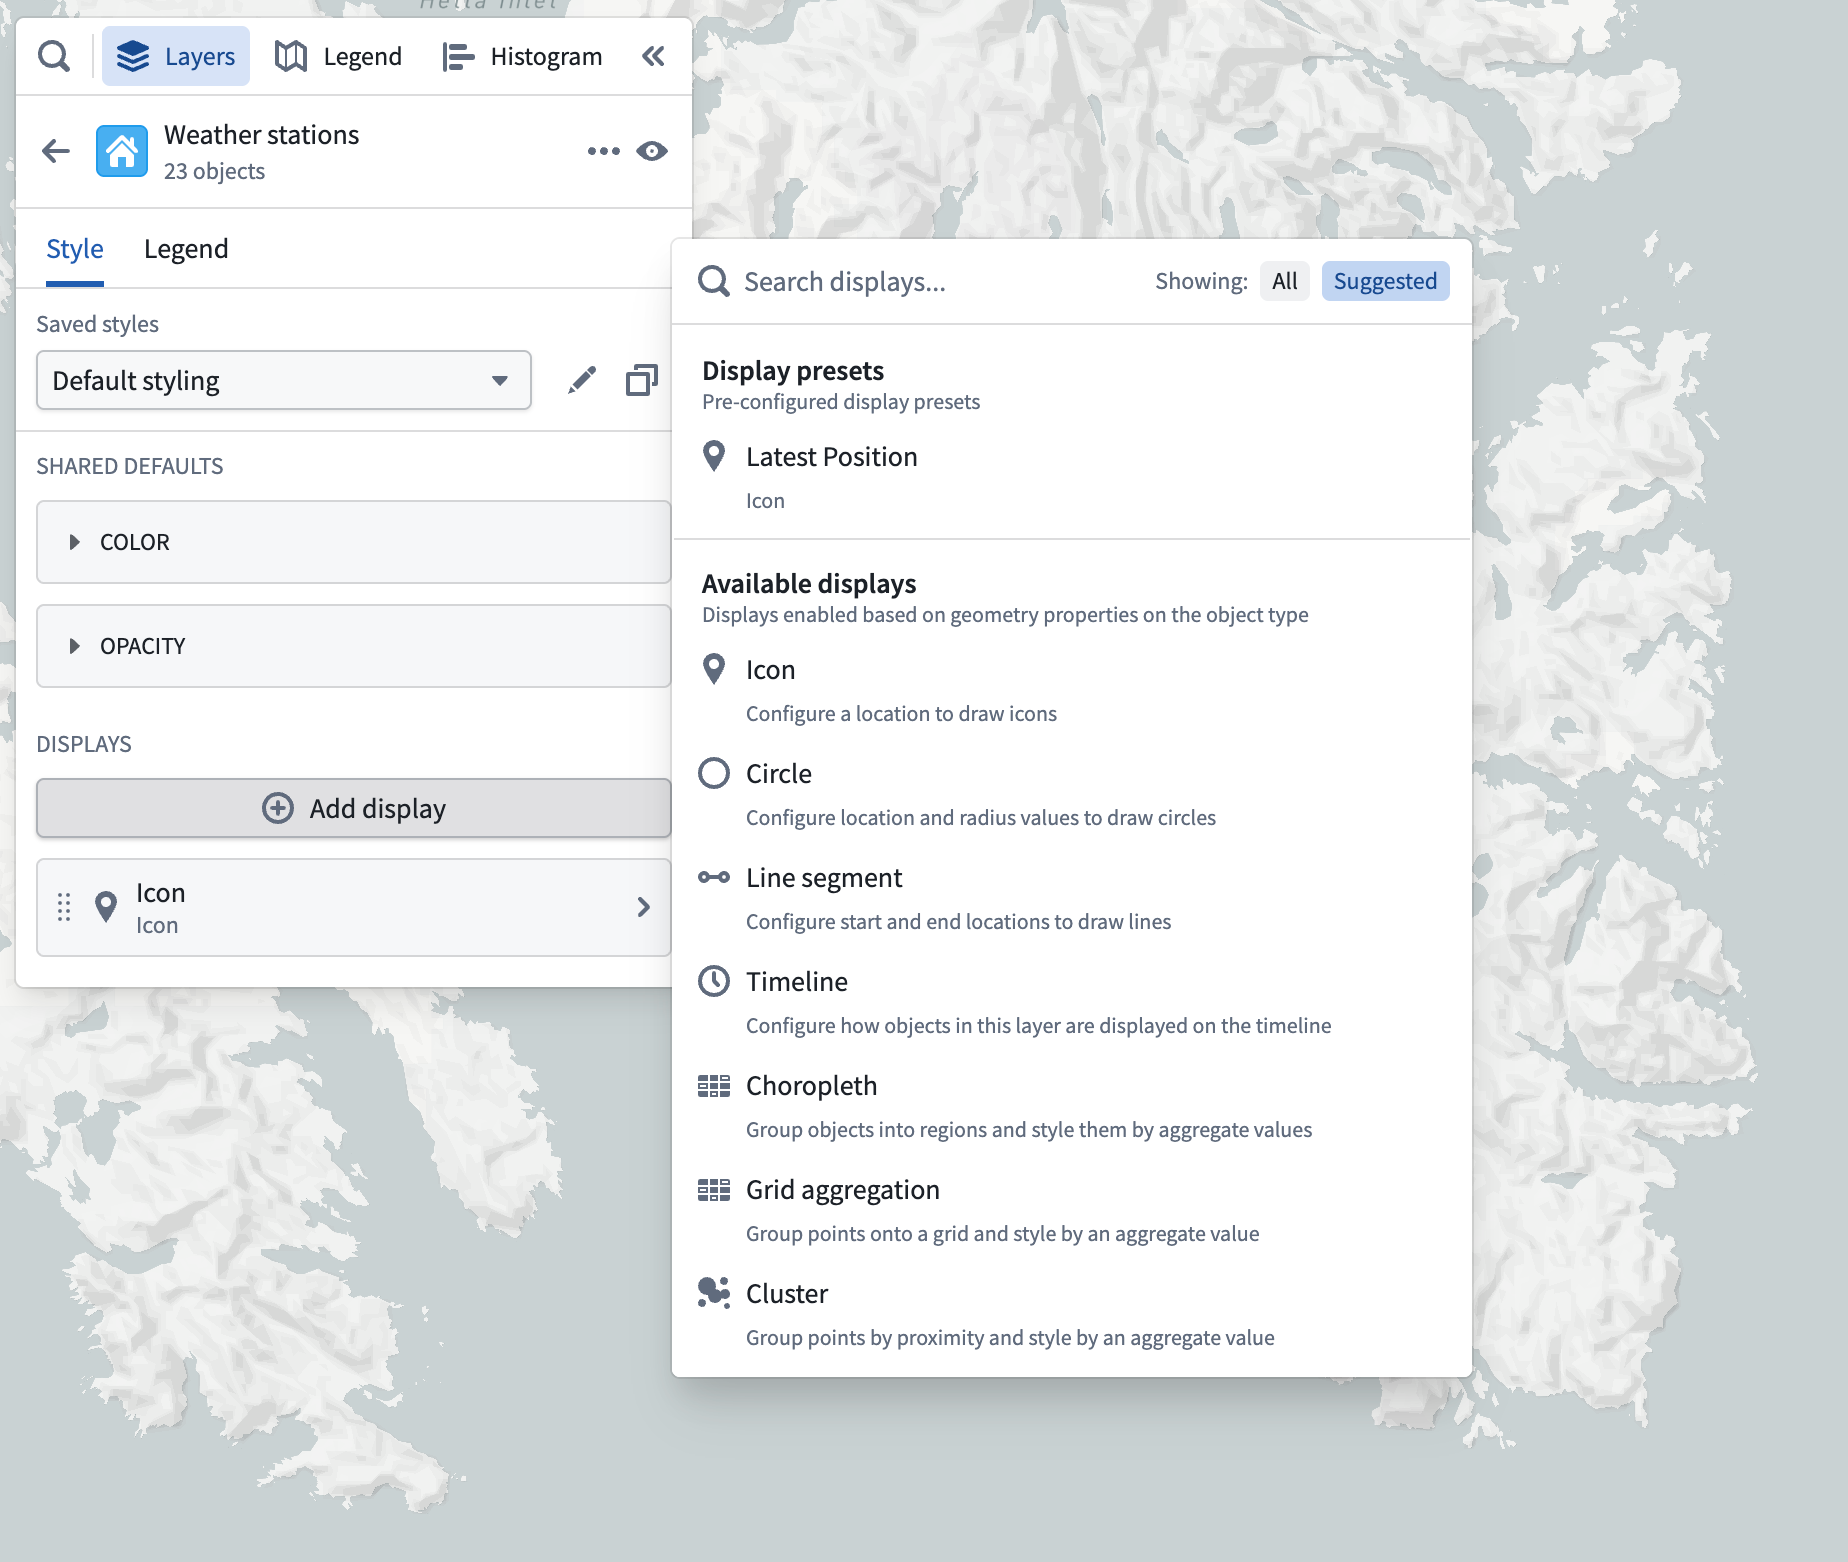
The add display menu has two sections:
- Display presets: Choose a property available on the object type for the layer, and add a display configured to use that property to the map.
- Available displays: Select from all the various display types that can be rendered by the Map. Only those displays which can be fully configured for the layer's object type are enabled.
Each display contains many customizable attributes which are covered in detail on each display's respective page. Most attributes on displays follow the value-based styling paradigm described in the following section.
Value-based styling
Use Value-based styling to control the appearance of a display rendered for an object by a value associated with that object. For example, you can configure the color of an icon to represent the temperature of a weather station, or the size of a circle to represent the number of employees at a company. The most common types of attributes that use value-based styling are colors and numeric attributes (for example, line width, icon size, circle radius, etc.).
The idea is that for each object being rendered, you specify a value source, which determines the a value to use for styling from each object being rendered. Then, specify some way of converting a value into the style attribute (for example, color, size, opacity). The value sources typically available for each stylable attribute are:
- Fixed: Explicitly select a single style value that will be applied uniformly to all objects in the layer.
- Property: Style each object according to a property on the object.
- Function: Style each object according to a value computed by a function.
- Measure: Style each object according to a time series measure.
Once you have selected the value you wish to use, the configuration for converting it into a style value (a color, line width, circle radius, and so on) depends on the type of attribute you are styling.
Color styling
The following sections describe the color-styling options available for each type of attribute.
Fixed
When using a fixed color style, select a single color that will be applied uniformly to all objects in the layer, by using the color picker.
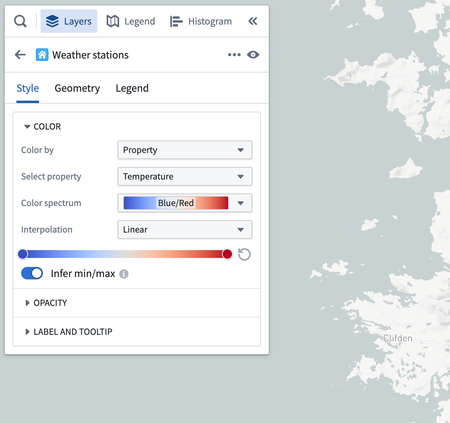
Value-based
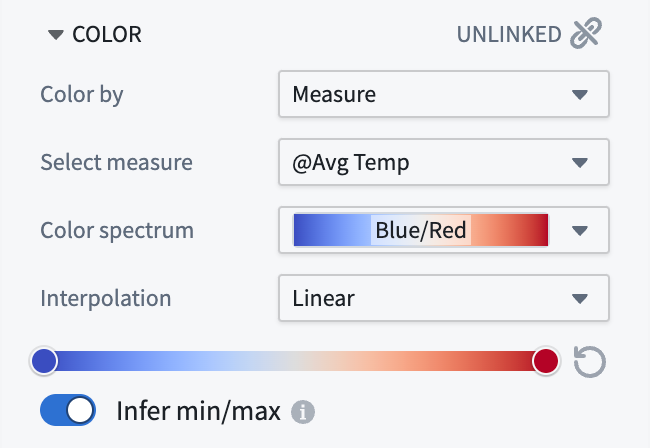
When coloring by a function, property, or time series that has numeric values, use the gradient editor to map values to output colors. The colors used in the gradients can be edited by selecting points the gradient bar. The numerical range (min/max) for the color gradient is automatically inferred, but this can be toggled off to set the range manually.
When coloring by a function, property, or time series that has string values, the Color mapping dropdown menu contains methods for mapping values to colors:
- Manual: Explicitly specify colors to use per-value.
- Automatic: Assign colors from a color scheme automatically to differentiate between different values without having to configure specific values.
- None: Attempt to apply each value directly as a hex color.
Numeric styling
The following sections describe the numeric-styling options available for each type of attribute.
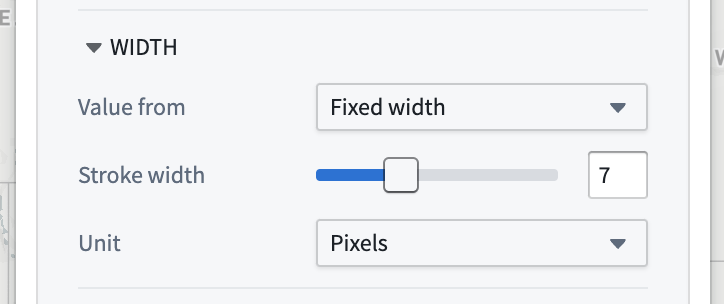
Fixed
When using a fixed numeric style, specify the numeric value by using the slider or entering an exact number in the input field.
Value-based
When styling a numeric attribute (for example, line width or icon size), only properties that have numeric values can be used as a value source. Configure a mapping from your selected value source to the style attribute by selecting a Numeric mapping option:
-
Scaled: Define a linear scale to convert a value from the object to the number used for styling.
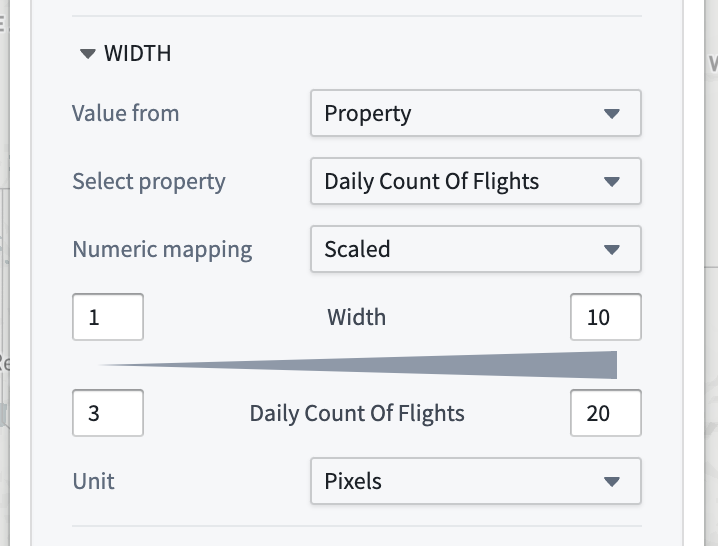
- The top row controls the minimum and maximum values for the styling attribute, while the bottom row determines the range of values that will correspond to those min/max values.
- In this example, the line width will be
1pixel for an object that has a "Departing Flights" property value of20, and10pixels when the property value is500.
-
None: The value of the property will be used directly as the style attribute, without any scaling or transformation.
Opacity styling
Use the Opacity section to control the transparency for objects in the layer.
The Value from dropdown menu contains the various ways in which you can specify opacity:
-
Fixed: Select a single opacity that uniformly applies to all objects in the layer.
-
By time: When rendering tracks or objects that are events, control their opacity based on the global time selection.
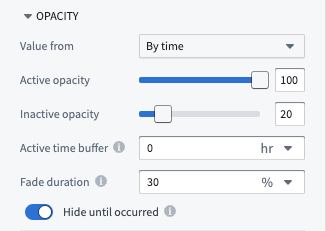
- Active opacity: Sets the opacity when the object or point is considered active.
- Inactive opacity: Sets the opacity when the object or point is not considered active.
- Active time buffer: Sets how temporally close an event or track point's timestamp must be to the current time cursor for it to be considered active.
- Fade duration: Sets the time period over which an object's opacity fades from the active to inactive opacity, once it becomes inactive.
- Hide until occurred: If enabled, an object will be fully hidden until the time cursor has passed the start of the event or a track point's timestamp.
The Value from dropdown and By time opacity options will only appear when styling tracks or objects with event data. Otherwise, the opacity section will only display the fixed opacity option.
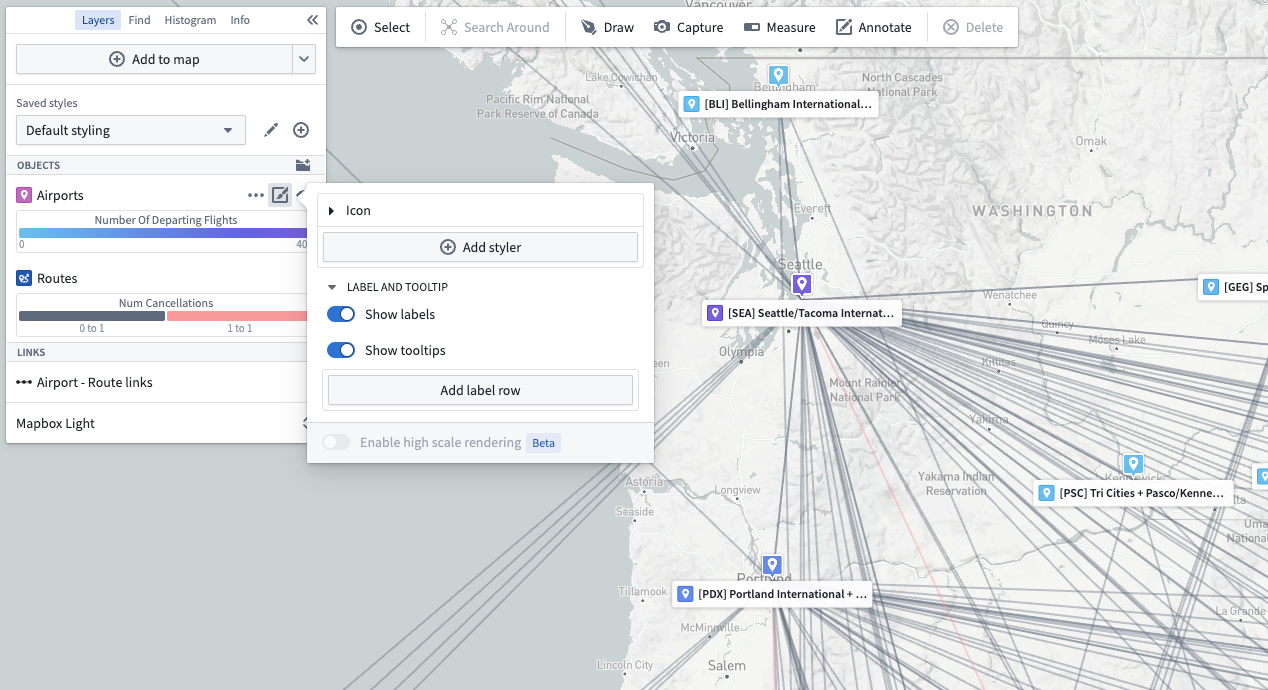
Labels
Define custom labels to showcase important information as text on the map. Use the following attributes to control how labels appear for each display:
- Visibility: Configure when labels are shown on the map.
- Always visible: Labels are shown for every object represented by the parent display.
- Only on hover: Labels are shown as a cursor pop-up when a user hovers over one or more objects.
- Hidden: No label information is shown.
- Style: For always-visible labels, control the appearance of the label content with the following options.
- Card: Labels are shown on a solid background to ensure high contrast and readability.
- Minimal: Label content is displayed only as text for a cleaner, less obtrusive appearance.
- Enable Header: Display the first label row item with bold text and a more opaque background, making key information immediately recognizable.
- Show Missing Data: Include row entries with null or empty values in the label.
Note that labels and additional tooltip contents are not supported for layers using tile-based loading methods. If you need labels or custom tooltip contents, ensure you are using the "Object" loading method.
Label content for object layers
For object-backed layers, labels may contain the following:
- Properties (including time-series properties)
- Functions
- Series
- Linked object counts
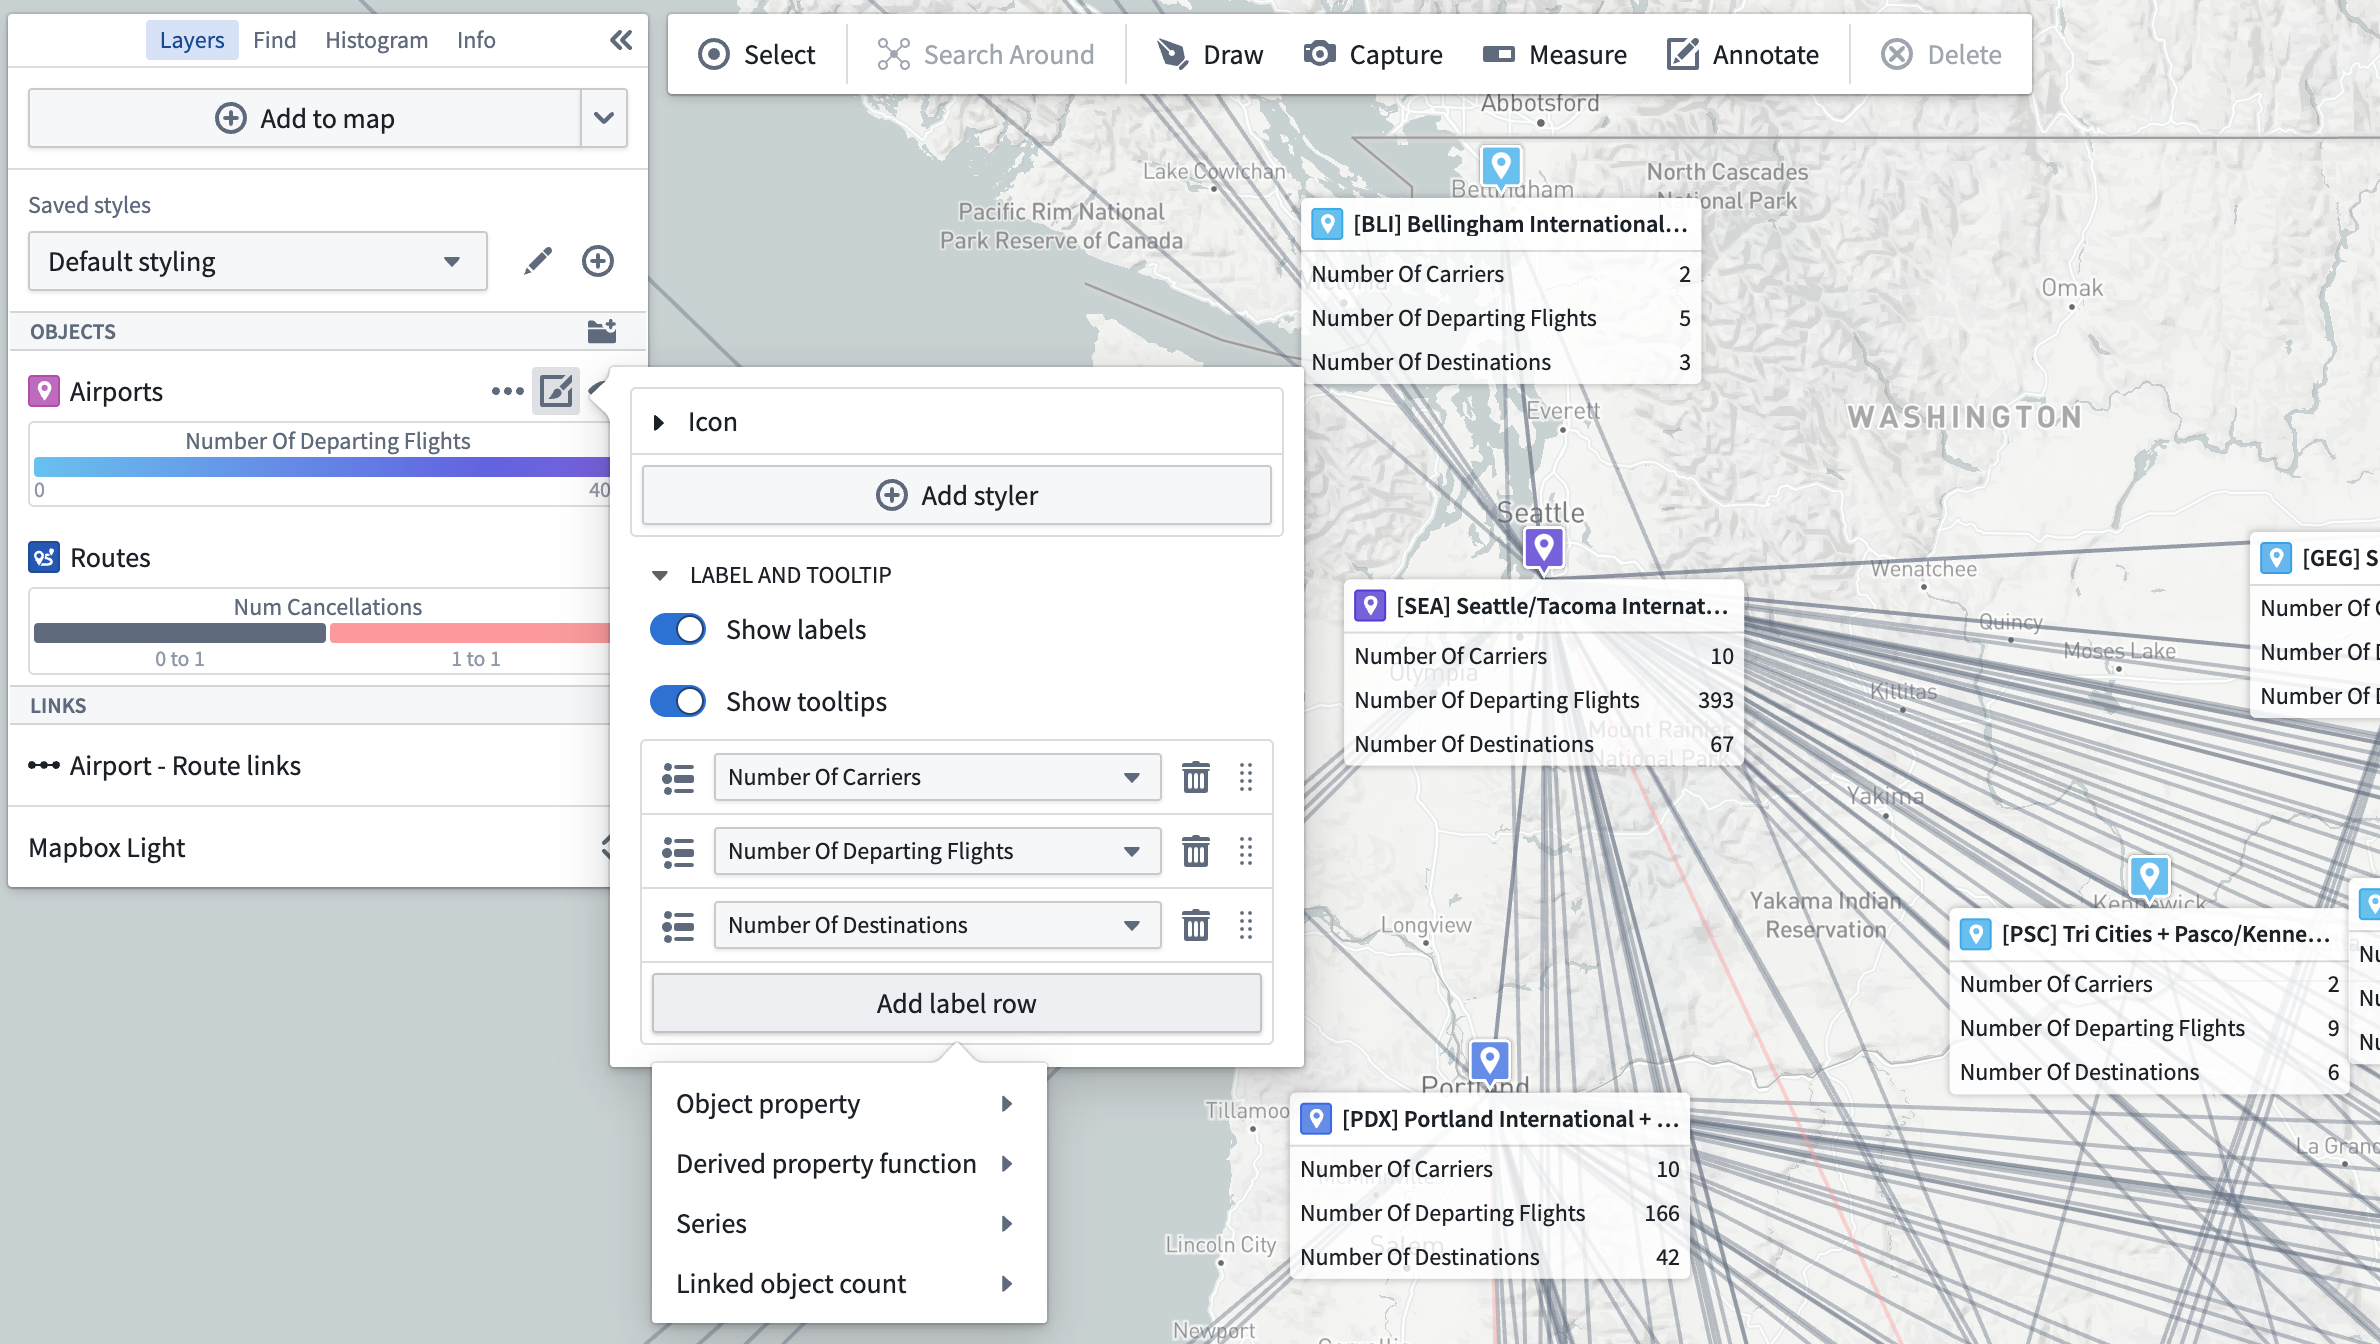
Once added, individual label rows also support the following operations:
- Drag to reorder
- Edit display name
- Show/hide row title
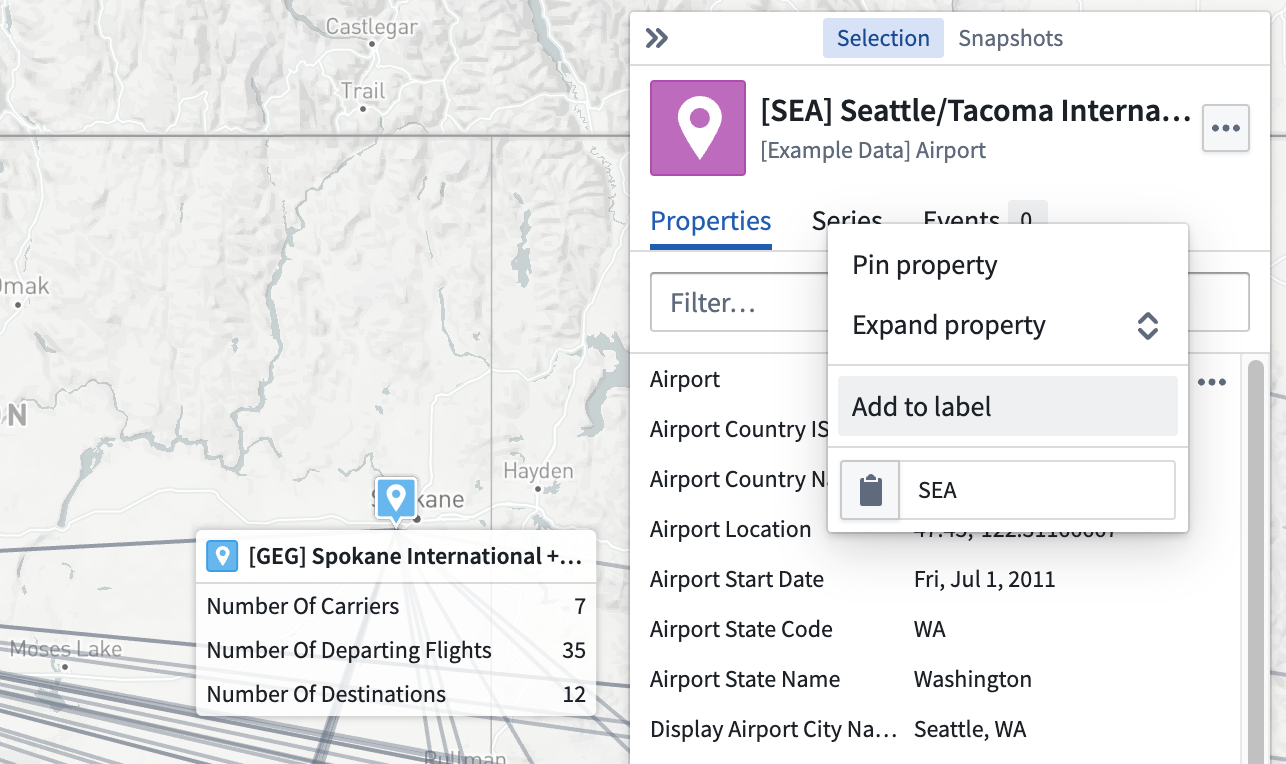
Properties or series can also be added from the selection panel using the … menu that appears when hovering on a property or series, as pictured below.
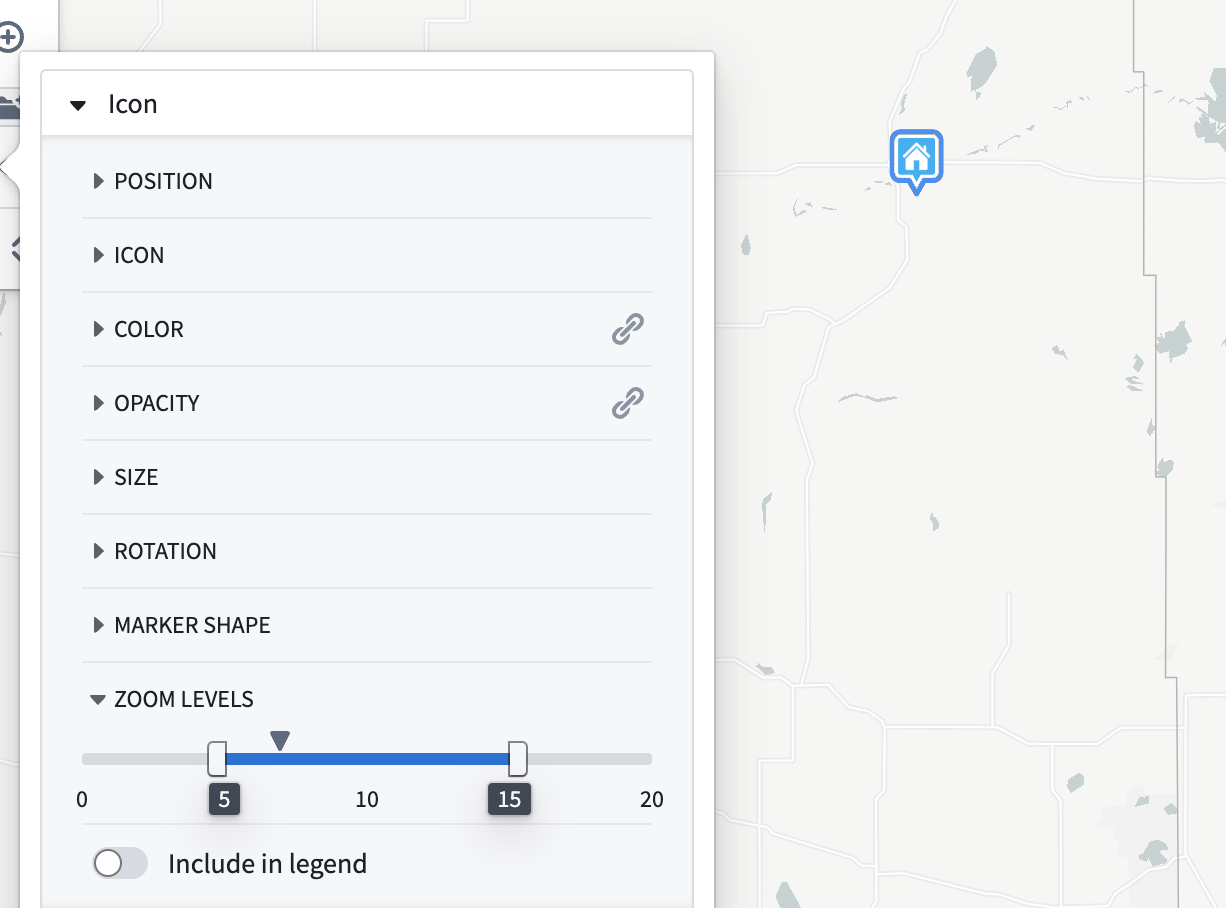
Display visibility by zoom level
Use the Zoom levels section to control the visibility range of the objects in the layer. The caret symbol indicates your current zoom level.
When the viewport is at a zoom level within the active range, the corresponding display will be rendered on the map. When outside the range, the corresponding display will be hidden.
The zoom level configuration only applies to layers that are toggled to be visible.
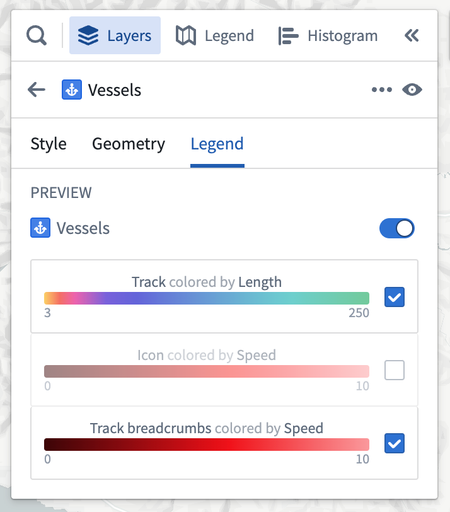
Legend
From the Layers details panel, use the Legend tab to preview and control how the layer will be represented. Style information from the layer's displays are included by default in this tab. The title switch determines whether this layer and its associated displays will appear in the Legend panel. Toggle the checkboxes at the row level to hide or show individual entries.