- Capabilities
- Getting started
- Architecture center
- Platform updates
Time and temporal data in the map
The map has a collection of features for visualizing and working with data that varies over time. There are a variety of forms that temporal data takes, each of which can be used and visualized in different ways.
Time-based data types available on a map
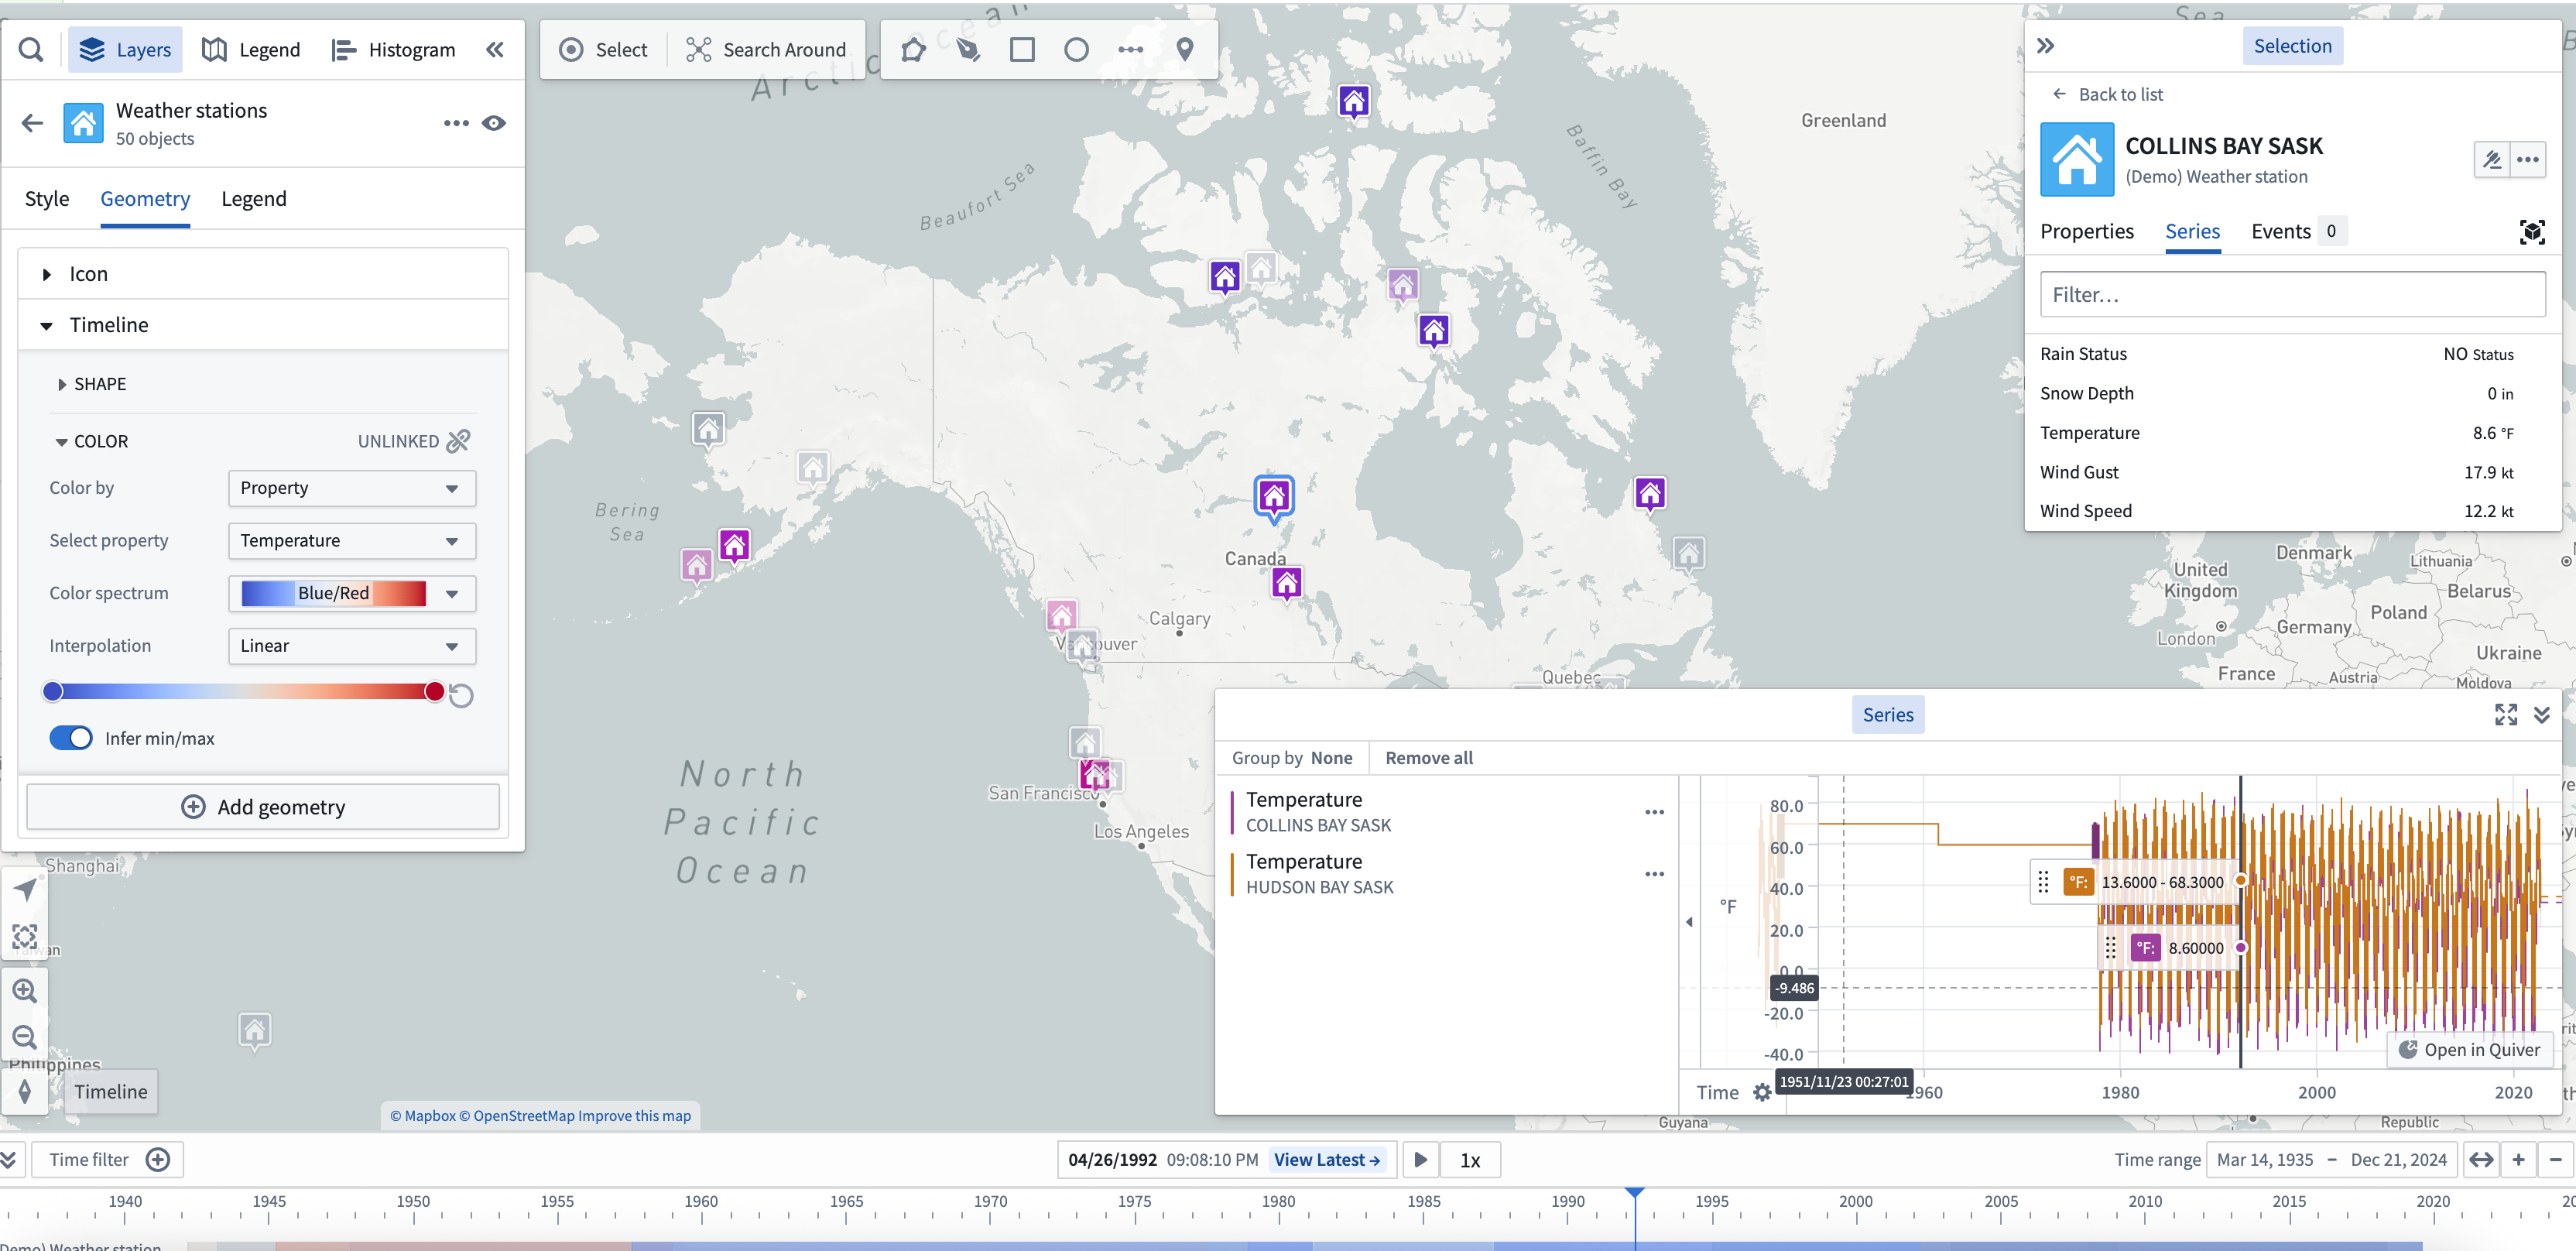
Time series
Time series are measured values that change over time. You can configure time series values in the Ontology as time series properties. Use time series to style objects on your map, and view them in the timeline.
Events
Events objects are objects that have additional metadata that associate the object with a specific time or time range. Event objects can be used to control the opacity of objects on your map and visualized in the timeline.
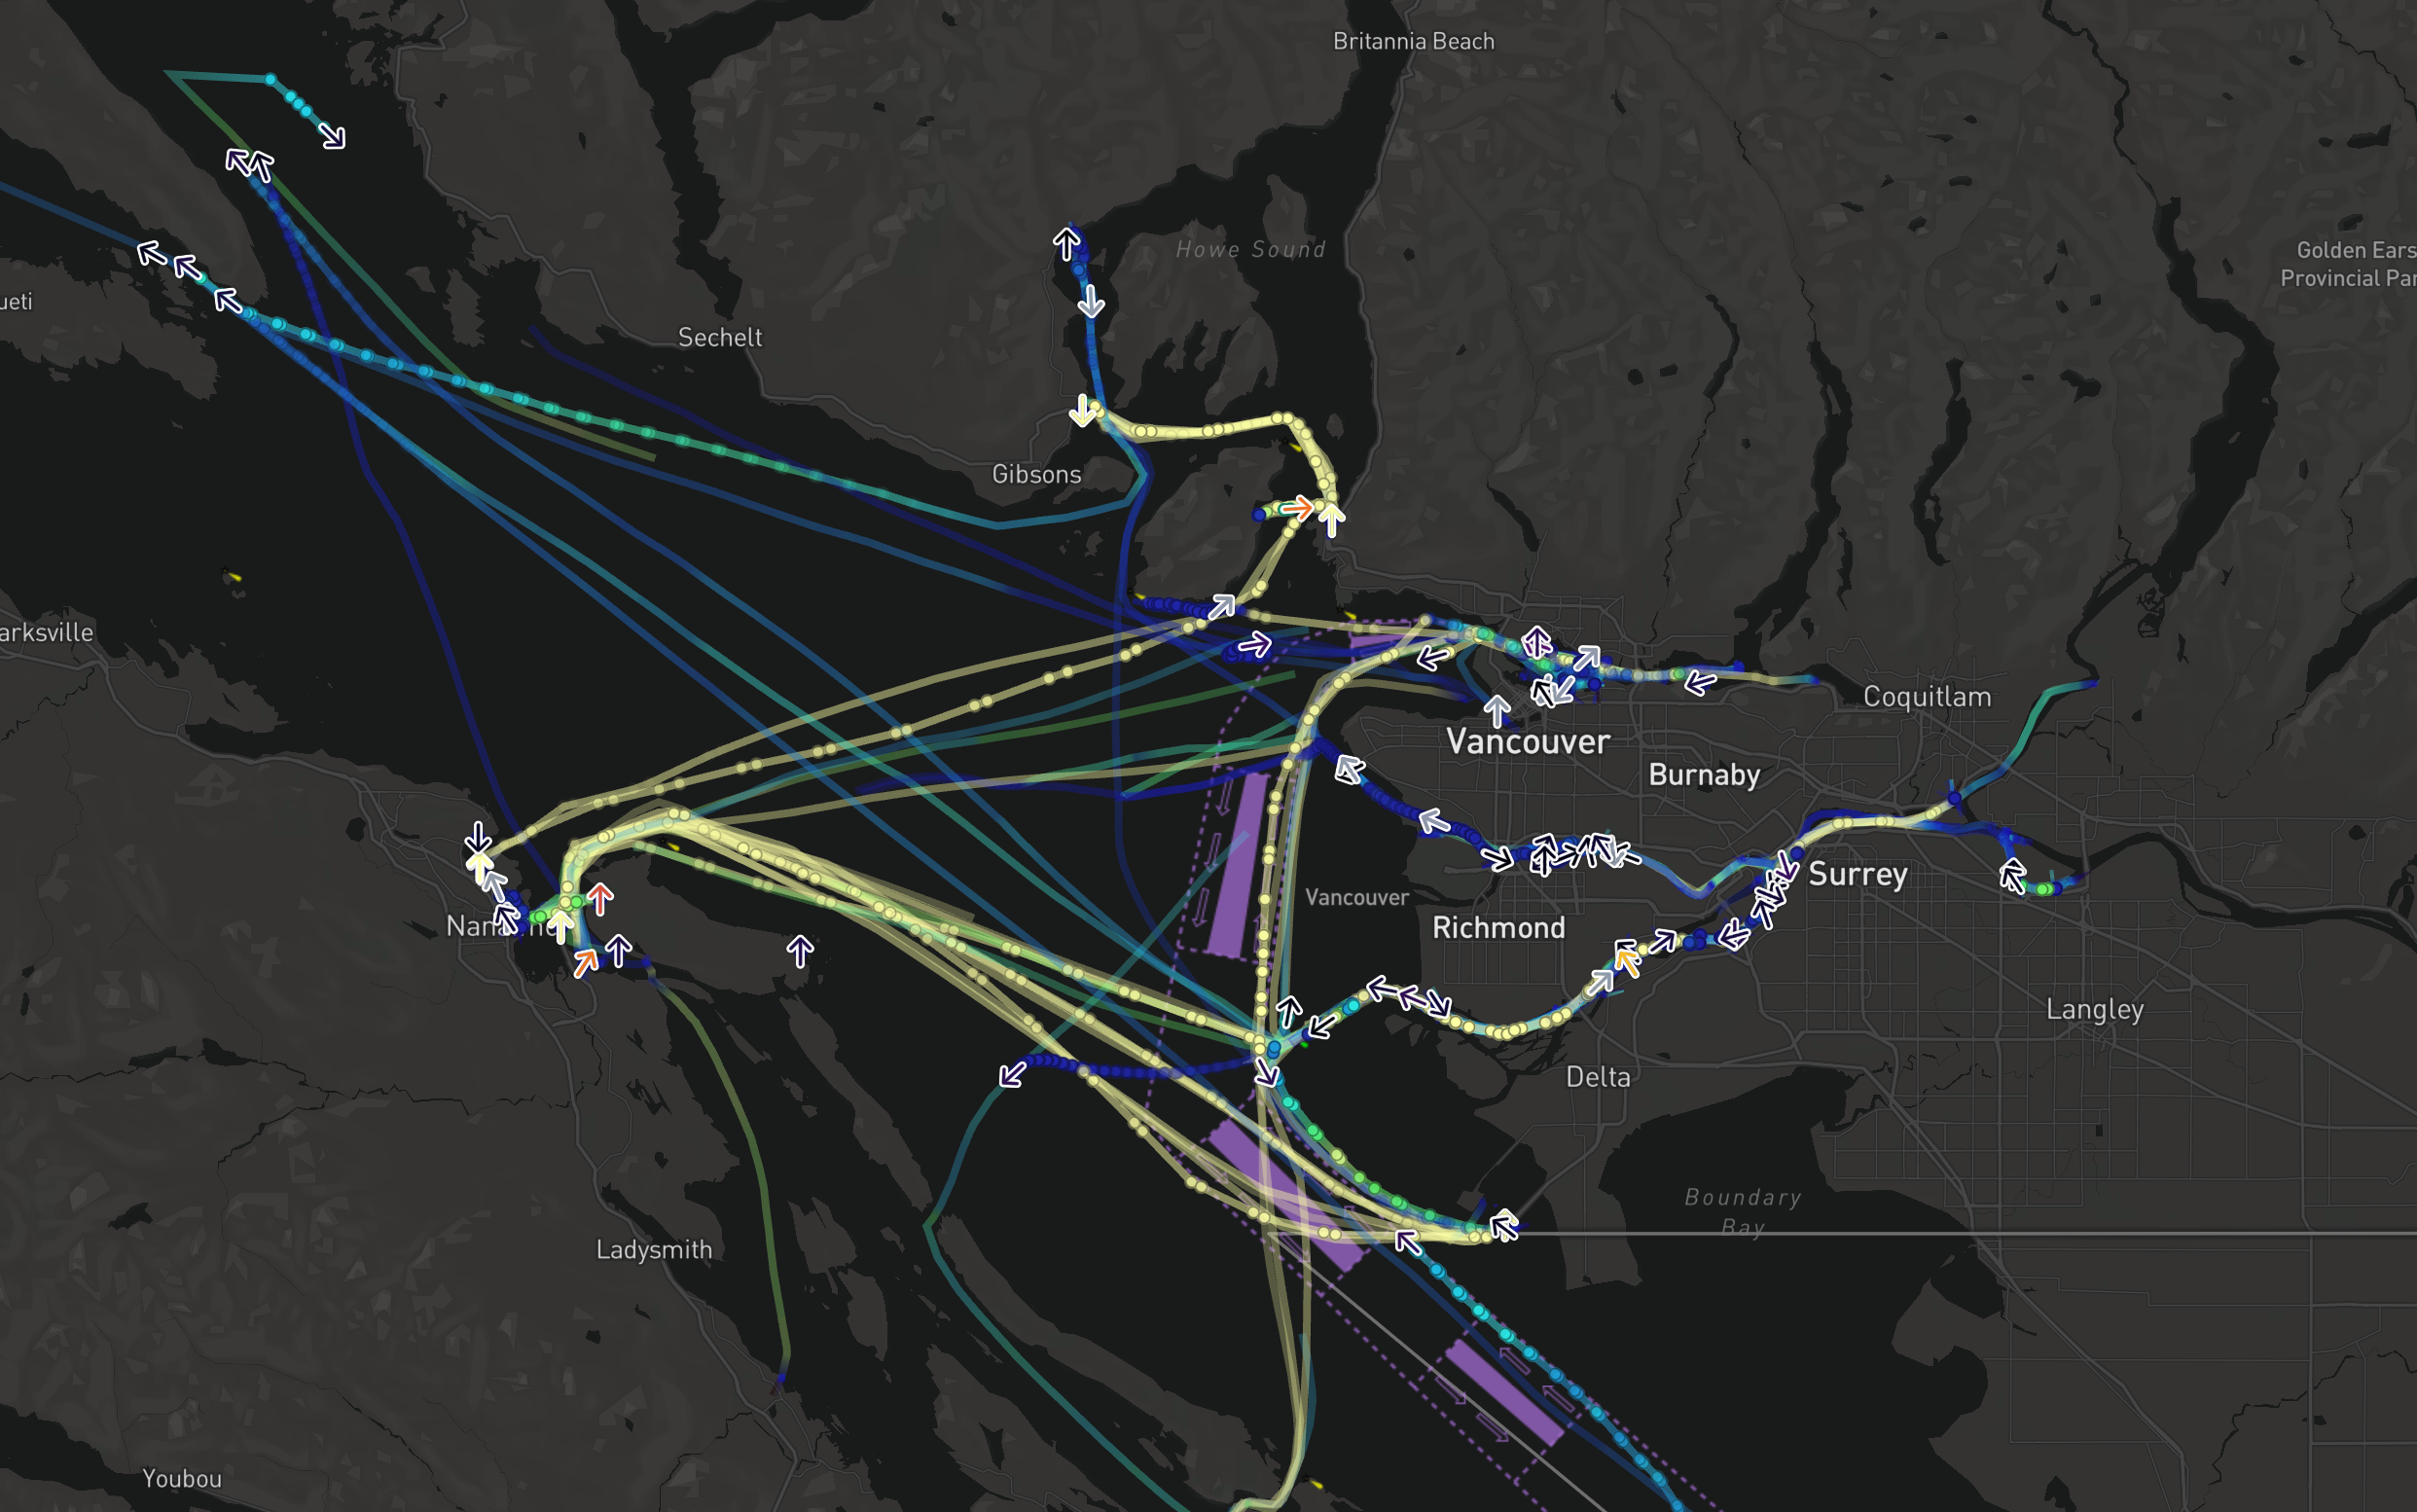
Tracks
Use tracks to represent objects that have a position which changes over time. The track styling options let you customize how you visualize the positions of an object over time.
Selected time and time range
All temporal data shown on a map respects the current selected time and time range, enabling you to see how your data changes over time and to inspect specific times in the past.
Select View latest to launch the Latest Data view, where the selected time will automatically update to match the current time. Use the Latest Data view in combination with streaming data to visualize data on your map that updates in real time.
You can view the map's selected time and time range in the timeline.
For example, depending on the selected time, the color of time-based styling will vary.
The select time and time range will affect the way data is shown on the map even if the timeline is not open.
Adjust the selected time, time range, and filtered time window
Use the timeline to adjust the: