Map Layer Editor
The Map Layer Editor application allows you to create, edit, and preview map layers. A map layer contains geospatial data and defines how the data should be visualized. You can use map layers in the Map Application and the Workshop map widget.
The Map Layer Editor provides a point-and-click UI for configuring map layers that contain vector or raster data. If you need more control or want to use more advanced mapping features, you can instead choose to write a Mapbox GL JS Style Specification document ↗.
Create a new map layer
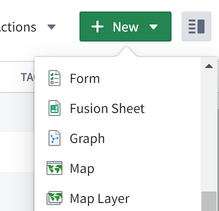
In Foundry, navigate to the folder in which you wish to create the map layer, and select Map Layer from the New menu:
Then, add a data source or choose to write a Mapbox JSON document to begin configuring your layer.
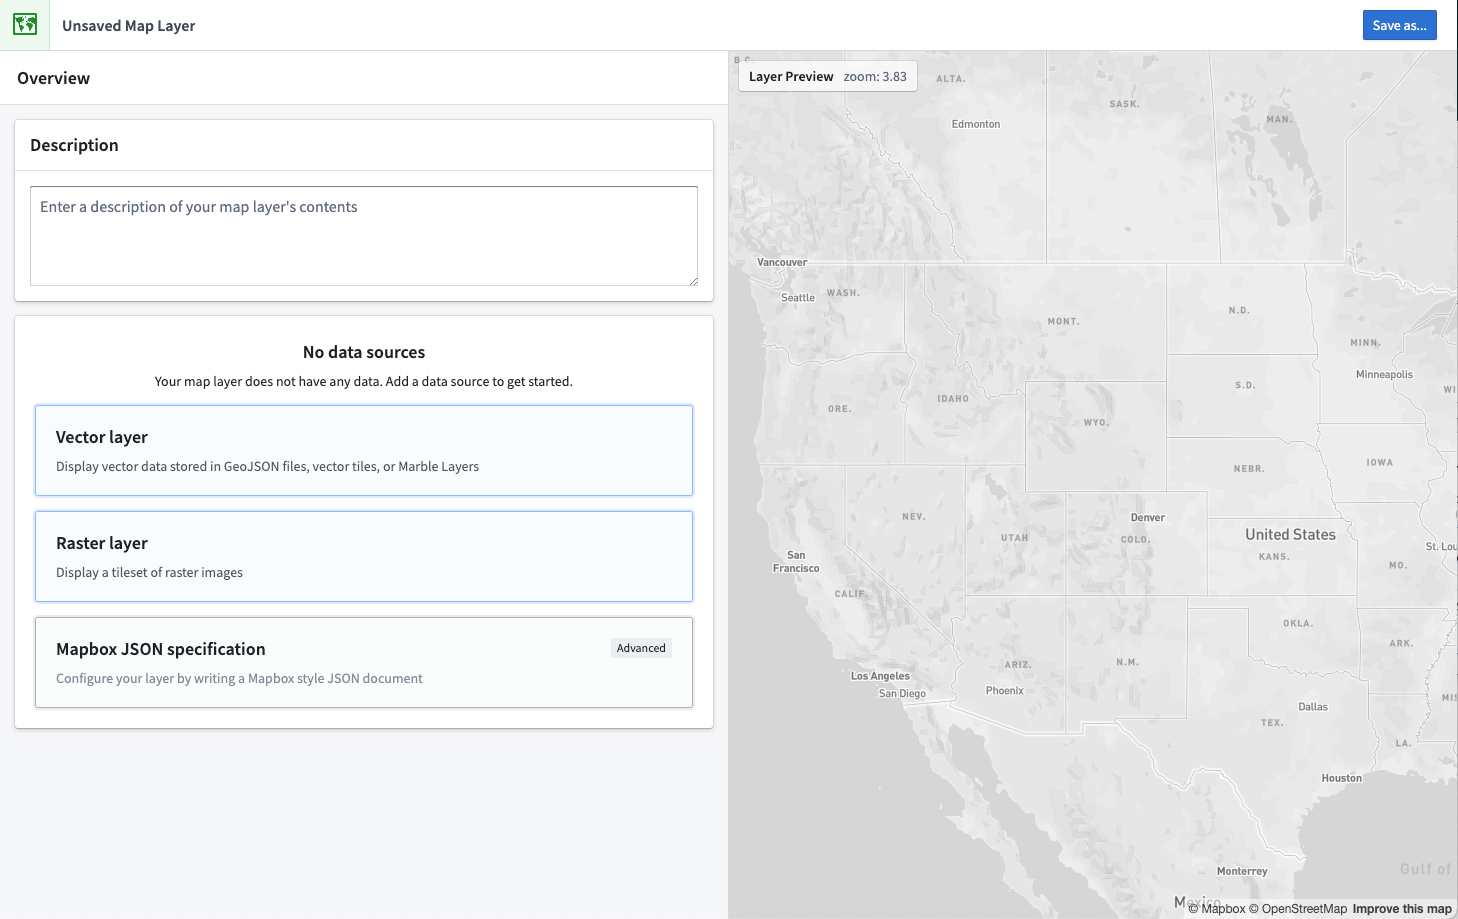
We recommend only using a Mapbox JSON document when you require functionality that is not supported by the vector or raster layers.
You can preview your map layer live in the Layer Preview panel on the right.
Always click Save after creating or modifying a map layer to make the layer available in the Map application.
Vector layers
Vector layers display geometry data from GeoJSON or vector tile sources. There are four ways to specify a data source:
- GeoJSON File: Select a manually uploaded GeoJSON file.
- Dataset GeoJSON File: Select a dataset, and then choose a GeoJSON file contained in that dataset.
- GeoJSON URL: Enter a URL for a GeoJSON file.
- MVT URL: Enter a URL for a vector tileset.
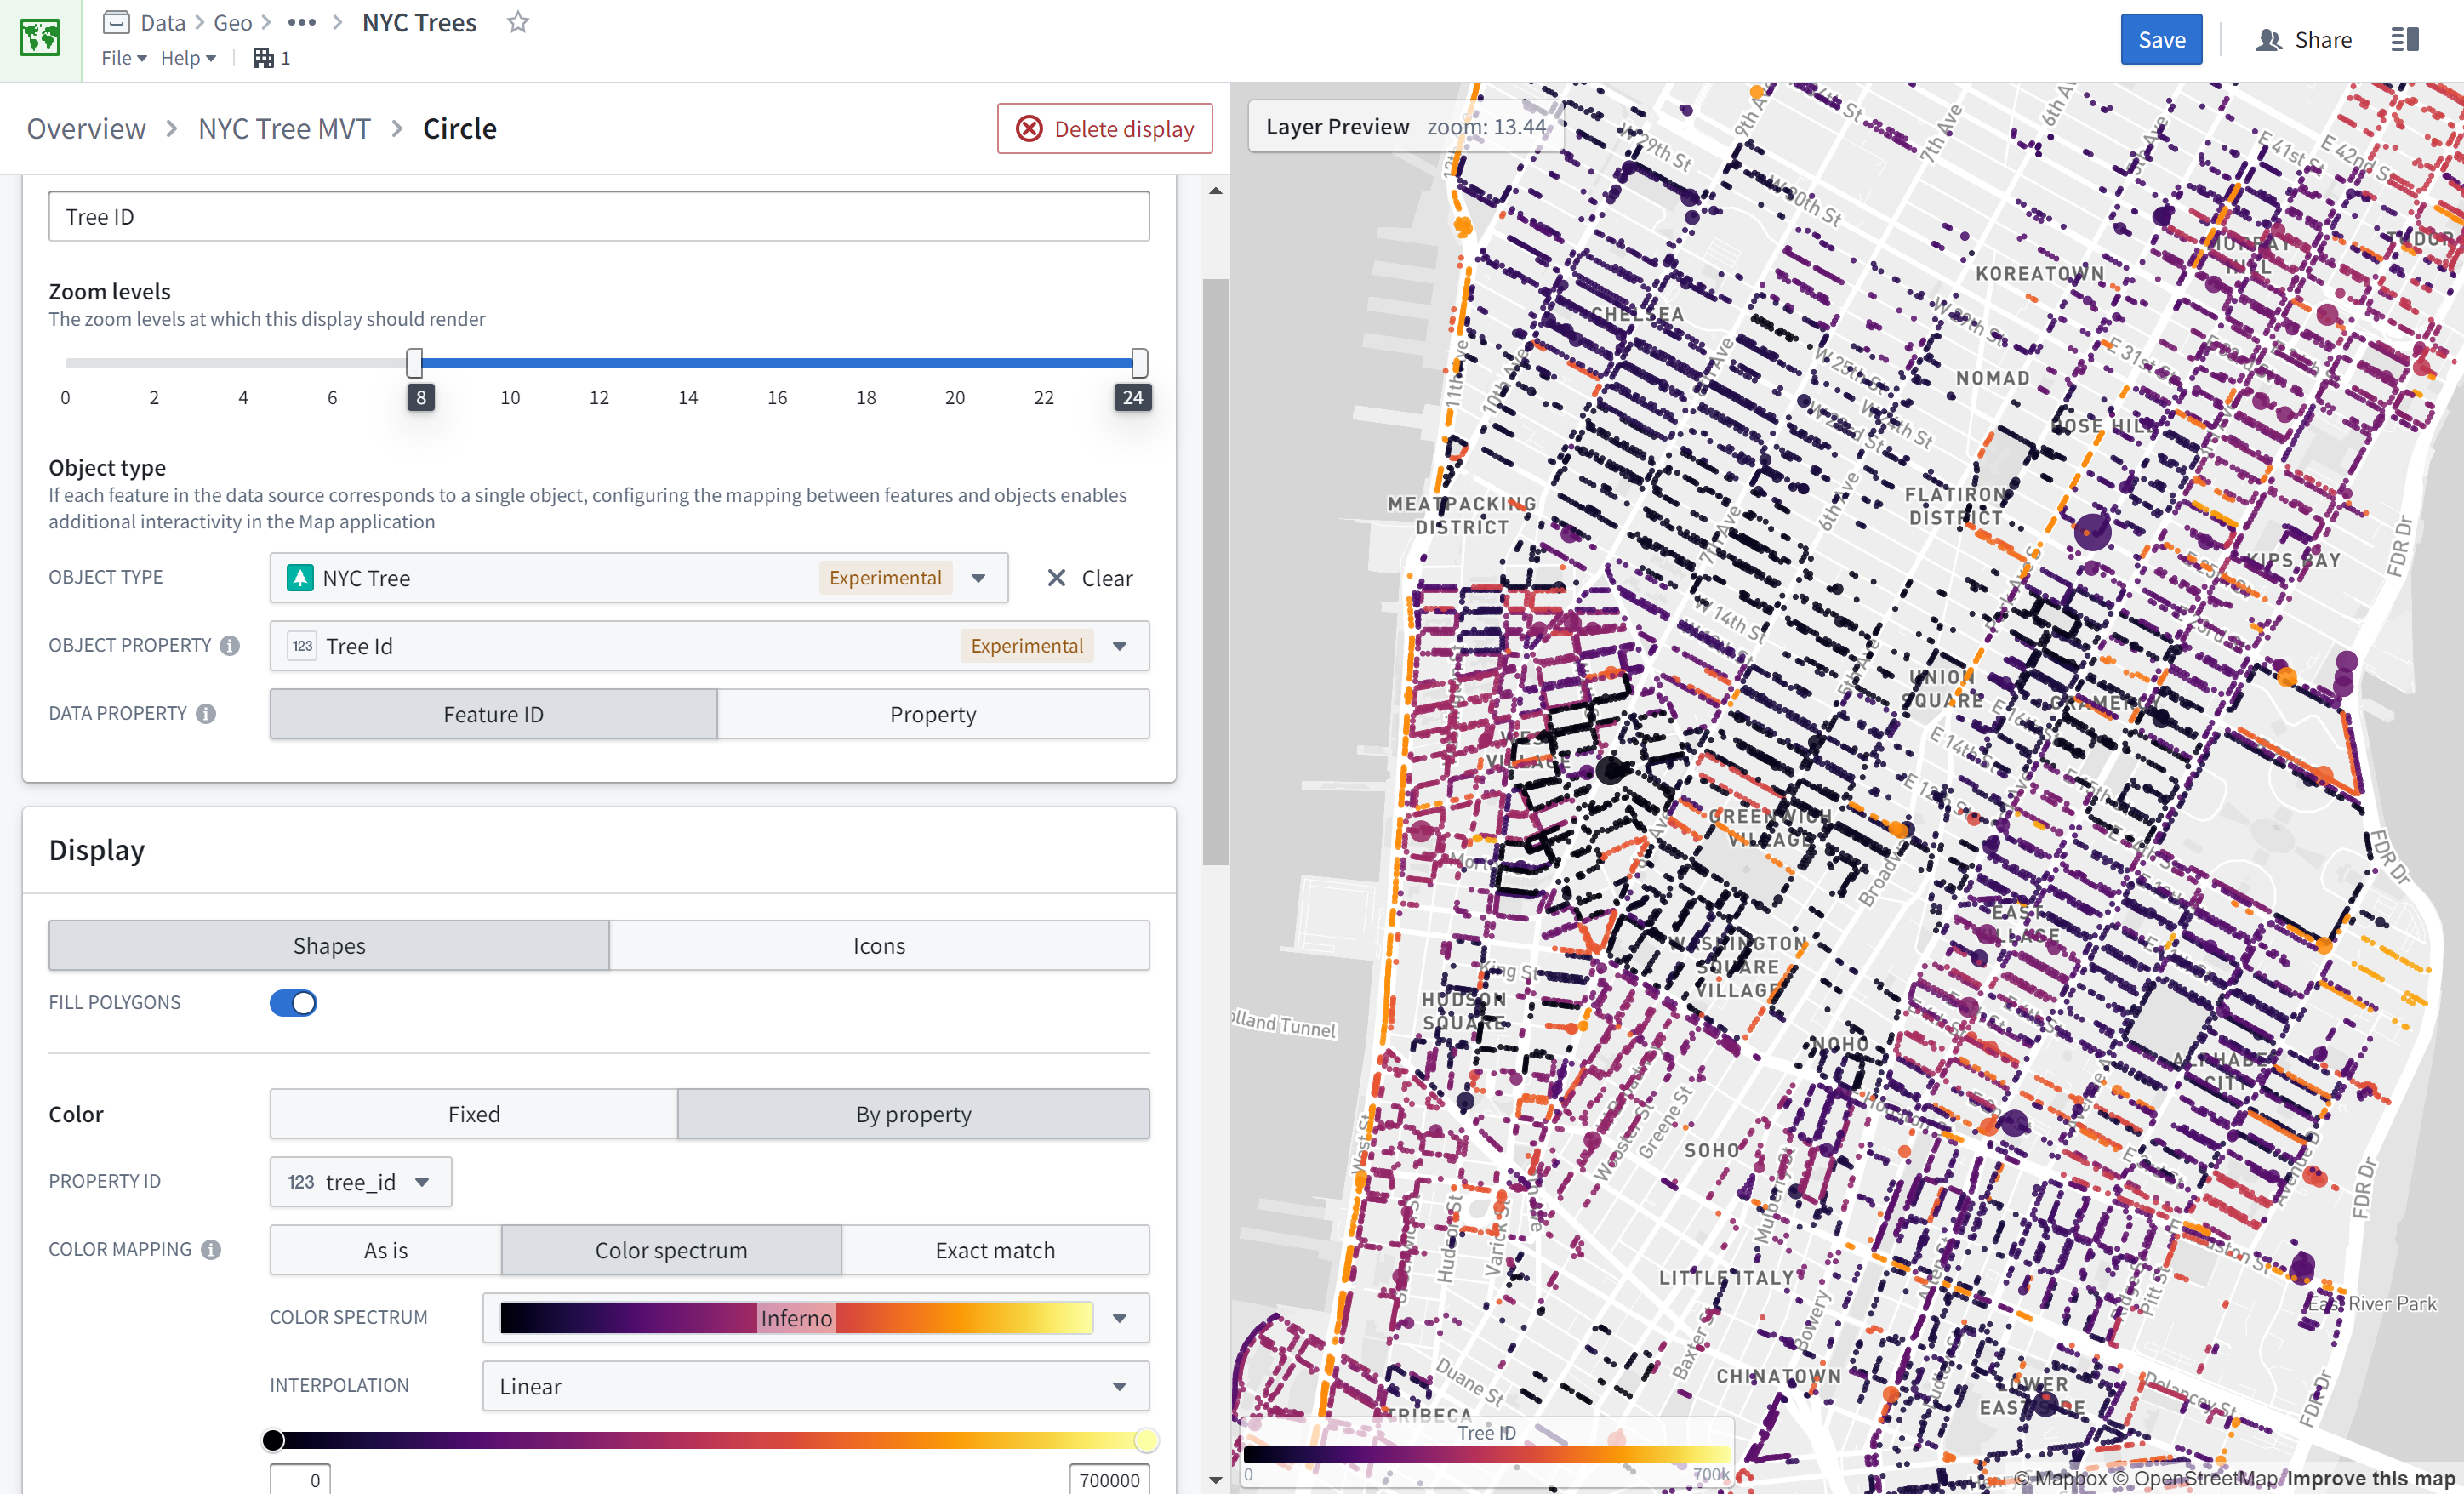
After adding a source, you can add one or more displays to configure how your data is visualized on the map.
Raster layers
Raster layers display bitmap data from a raster tileset. Configure a raster data source by specifying the URL for the tileset.
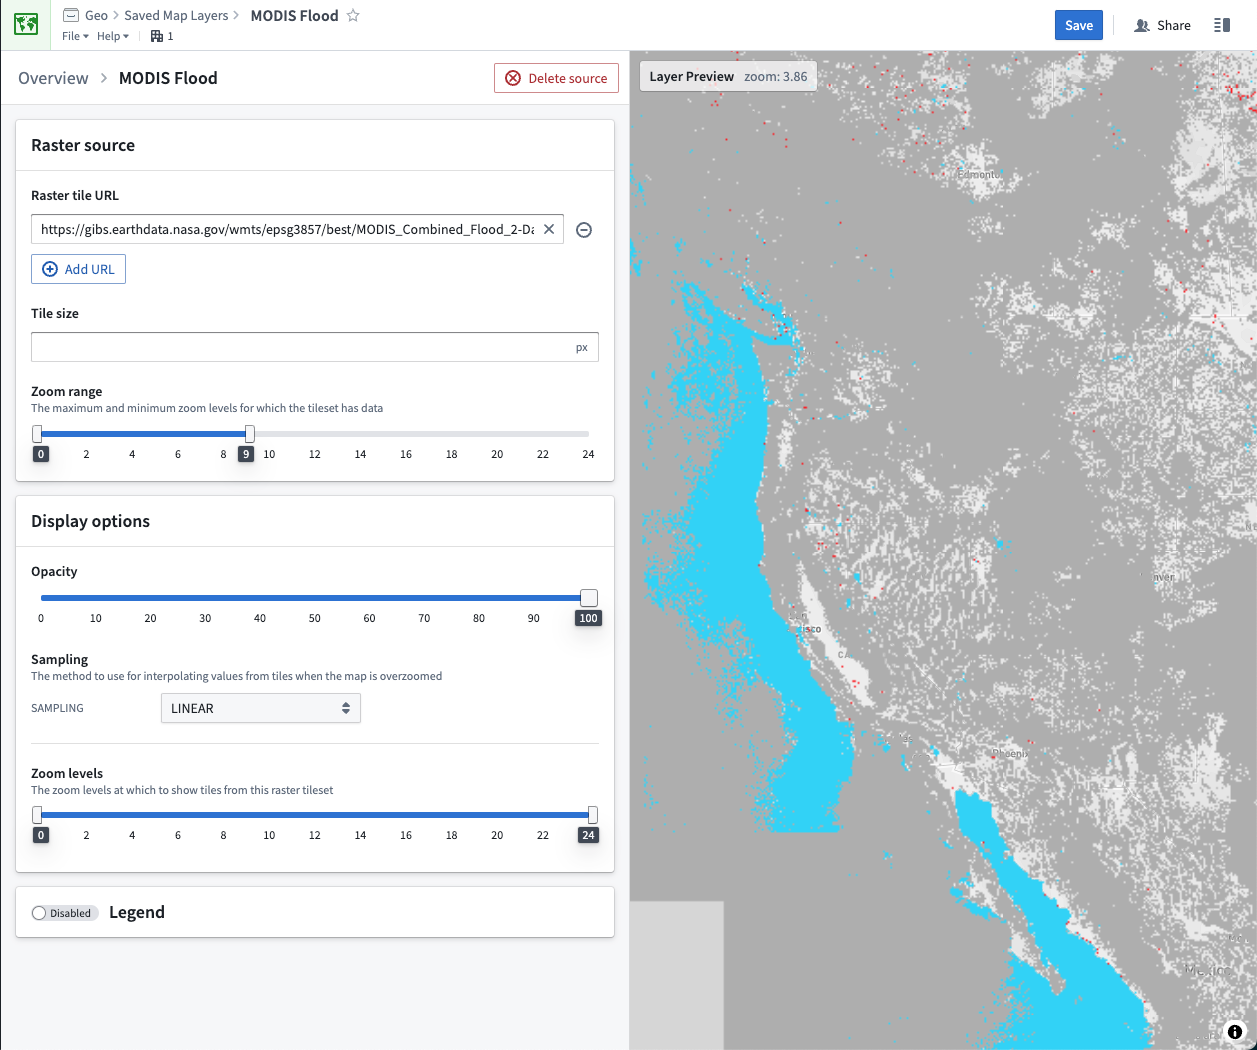
The available display options for raster layers are:
- Opacity: How opaque or transparent to display the layer.
- Sampling: The interpolation method to use when the map is zoomed in such that the raster imagery must be scaled up.
- Linear: interpolates values using an average of the closest source pixels, which can result in a blurry appearance when overzoomed.
- Nearest: interpolates by selecting the nearest source pixel, which creates a sharp but pixelated appearance when overzoomed.
- Zoom levels: The maximum and minimum zoom levels at which to display the layer.
Object layers
Object layers display data directly from your Ontology. Only object types that are synced to OQL and have a geopoint or geoshape property type can be displayed via object layers.
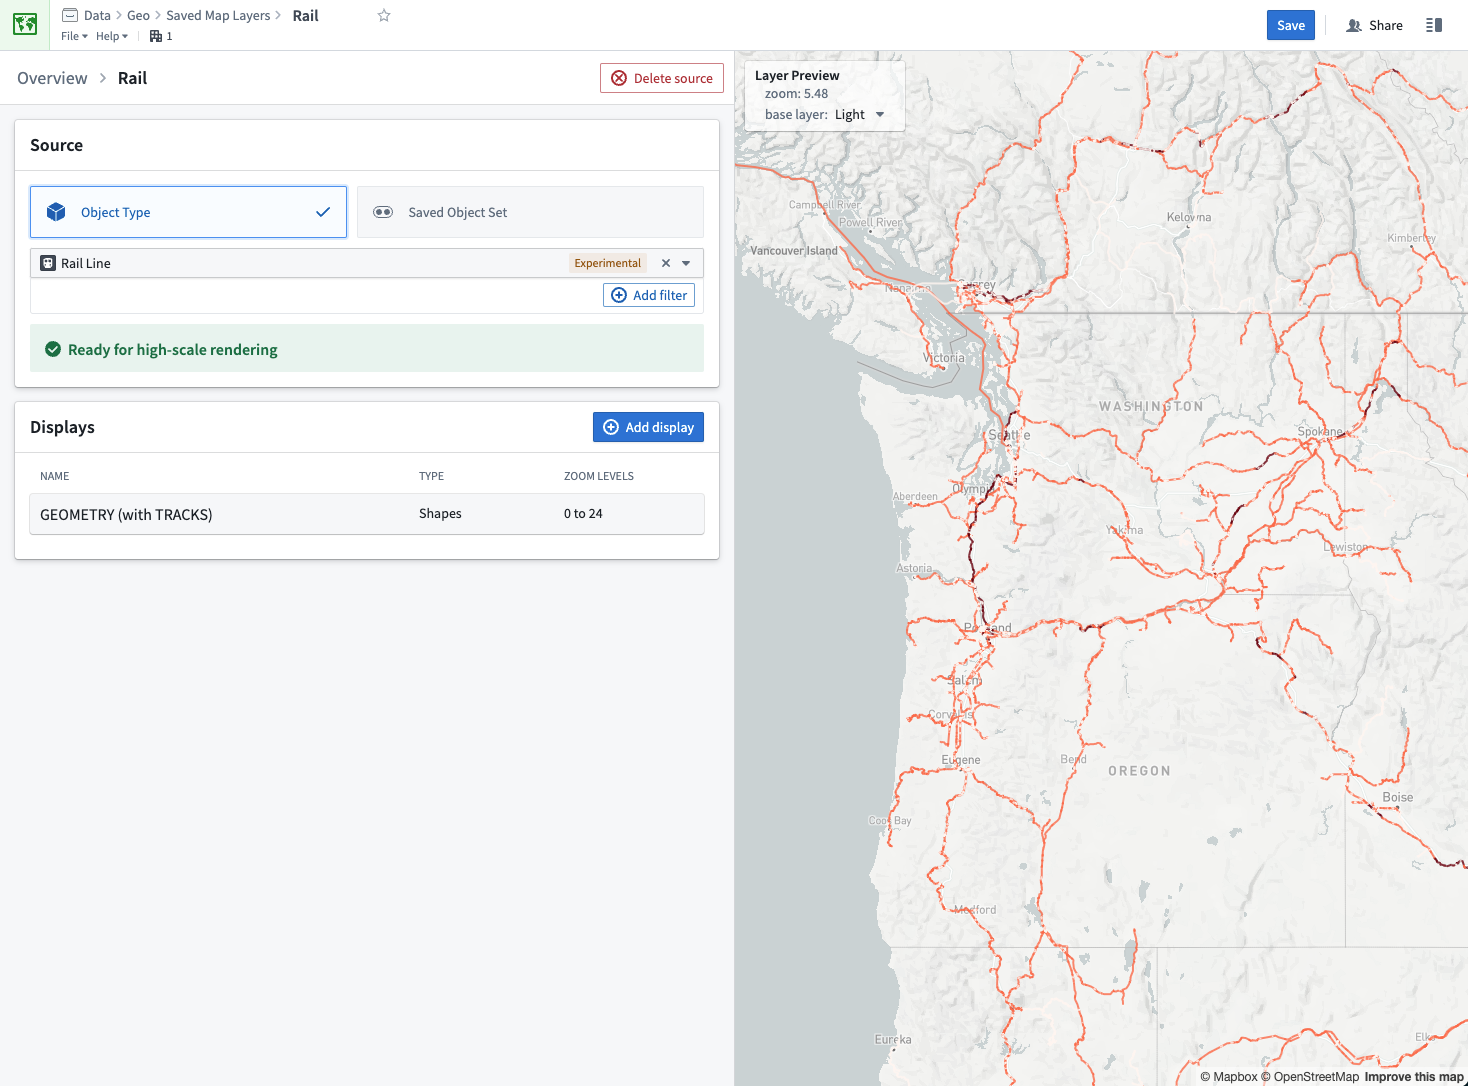
Although OQL is required for object layers, it is not available on all instances. Contact your Palantir representative for more information.
Object layers provide two ways to specify the data you want to render:
- Object type: Select an object type and optionally define filters. All matching objects will display in your map layer.
- Saved object set: Select an exploration saved from Object Explorer. The layer app will display all objects that are present in your saved exploration.
The options for configuring object layer displays are the same as for vector layers.
Mapbox JSON layers
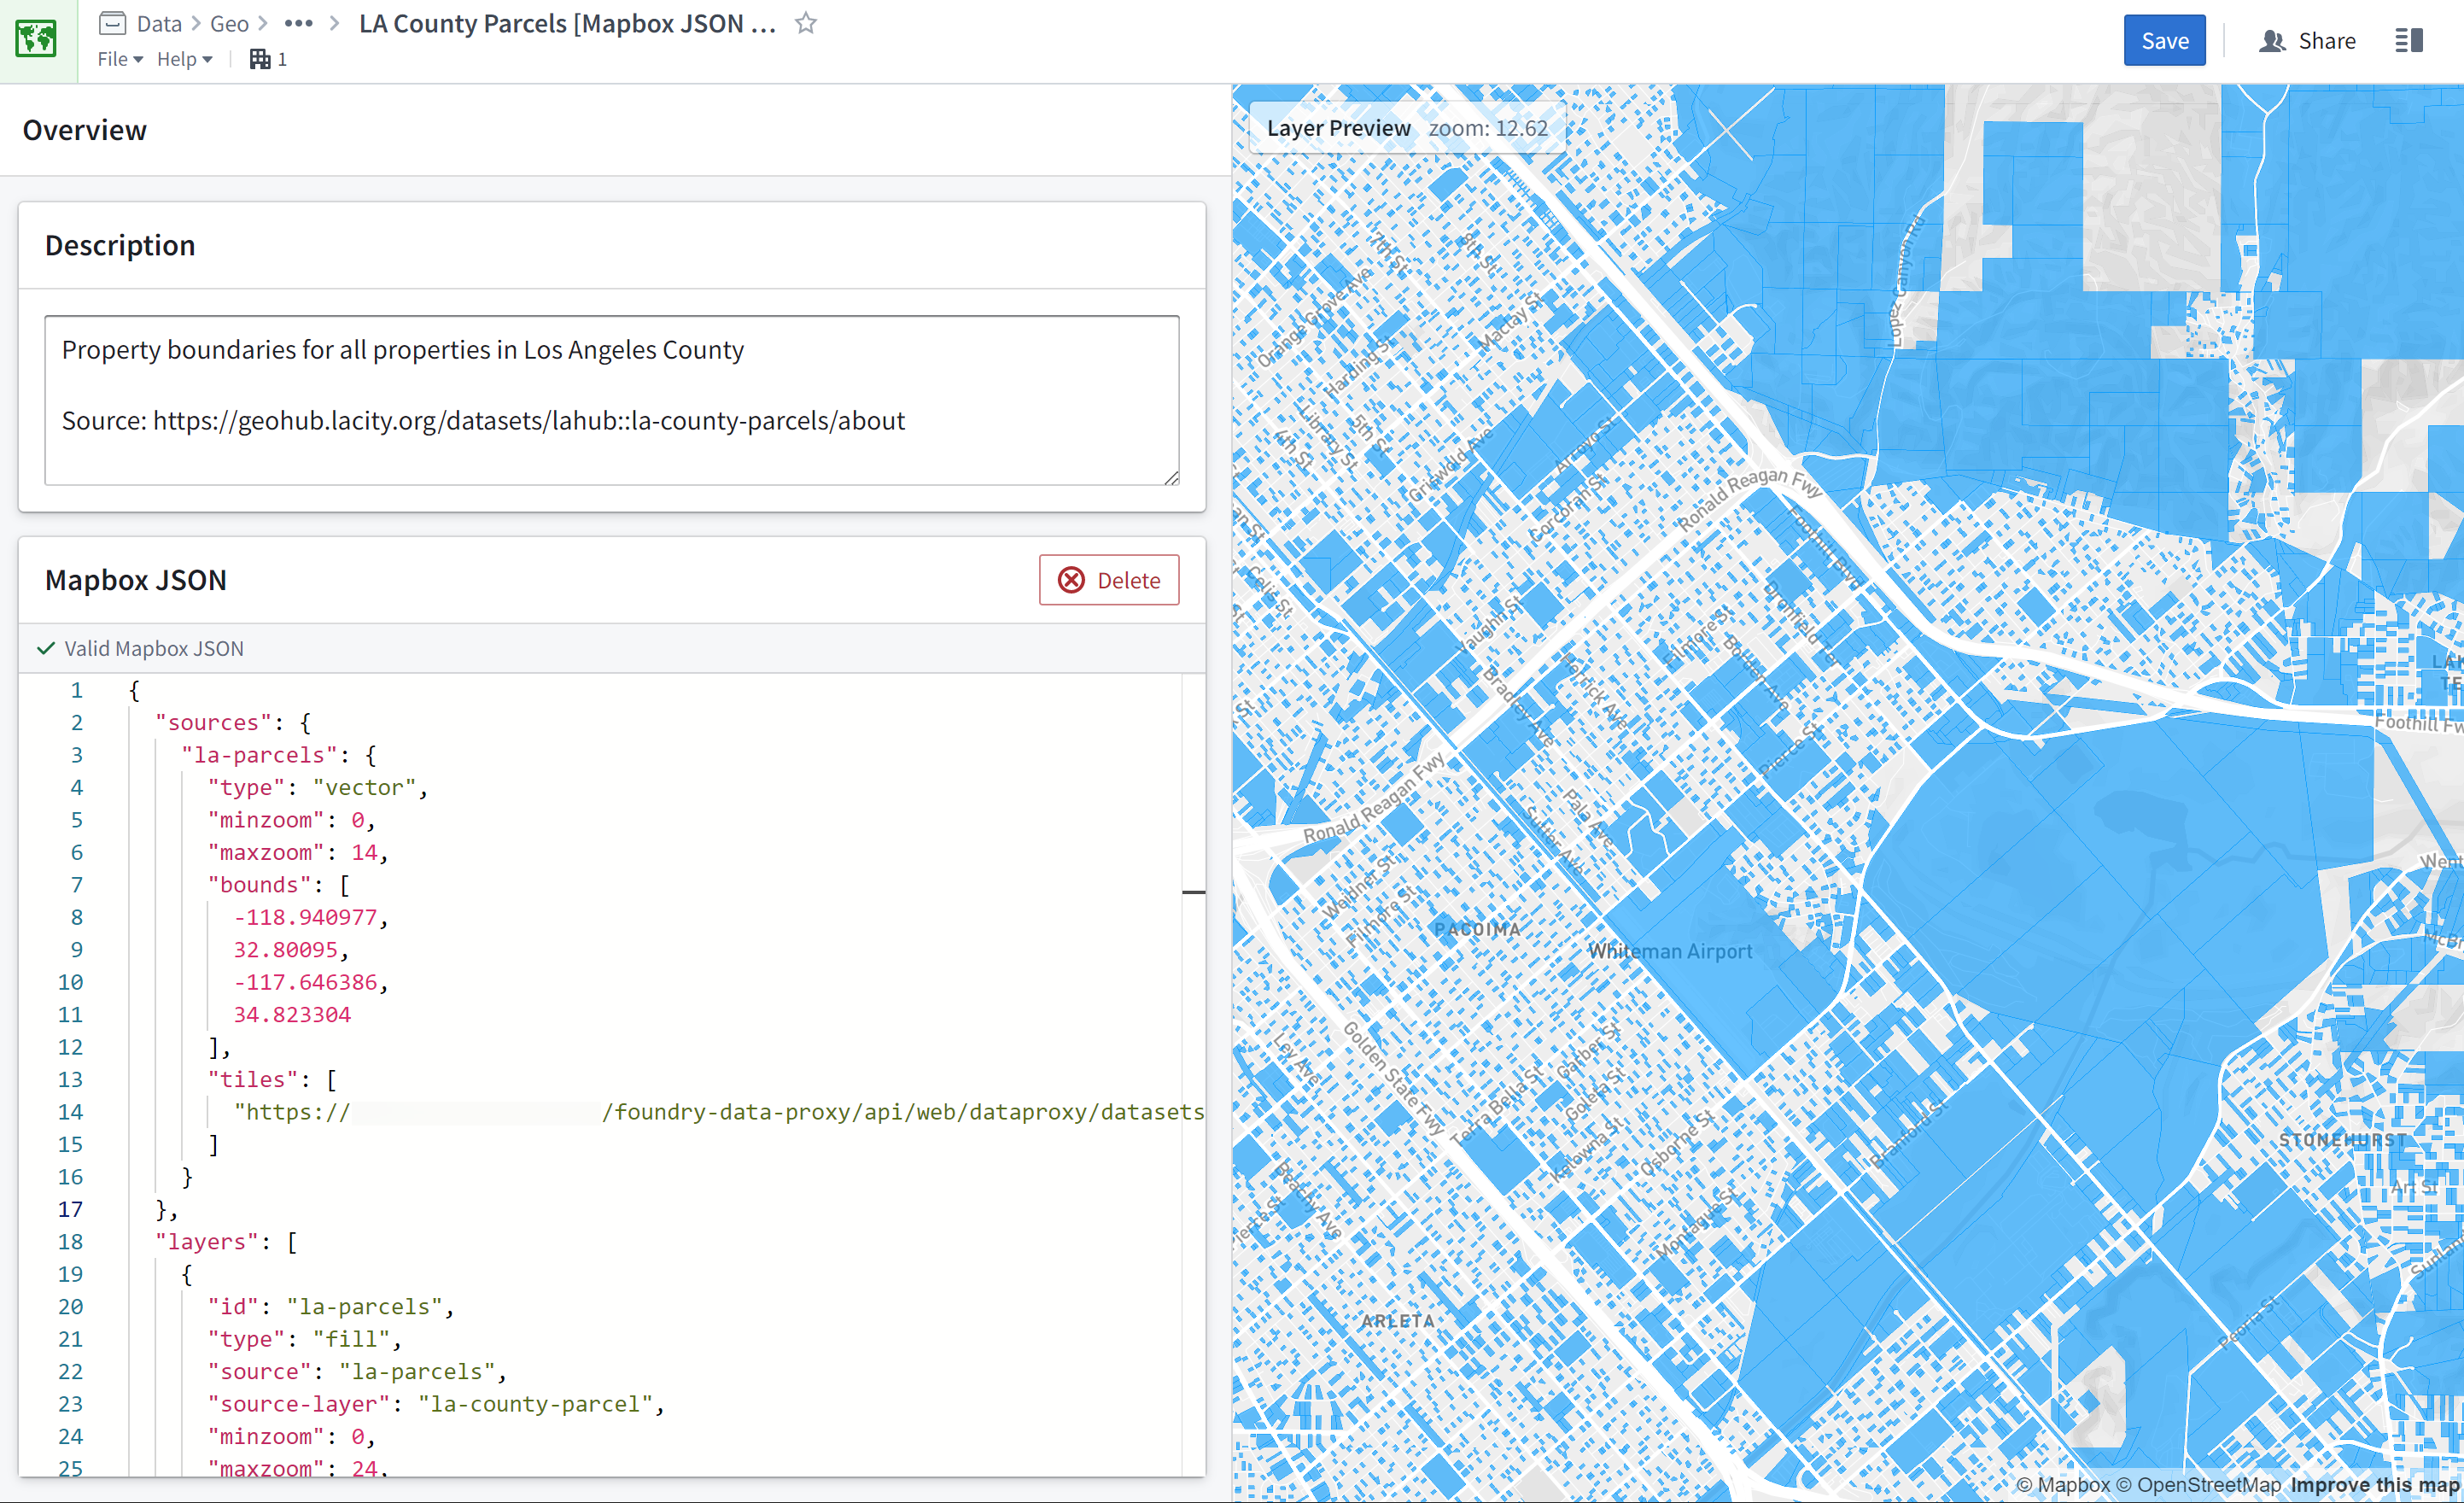
For Mapbox JSON layers, you can edit the JSON document in the Map Layer Editor. The editor validates the JSON and highlights any errors.
The JSON content must conform to the Mapbox GL JS Style Specification ↗, but only the sources and layers properties are supported (and both are required).
