Ontology objects
The Map application supports Ontology objects with geospatial data attached.
Ontology-native representation
Point, line, and polygon geometries can be specified in the ontology using the geopoint or geoshape property types. See the ontology section of the geospatial docs for more details.
Circles
A circle geometry can be specified on an object type by selecting a Radius property in the Geospatial section of the object type's Capabilities tab. The radius property can be any numeric property measured in meters.
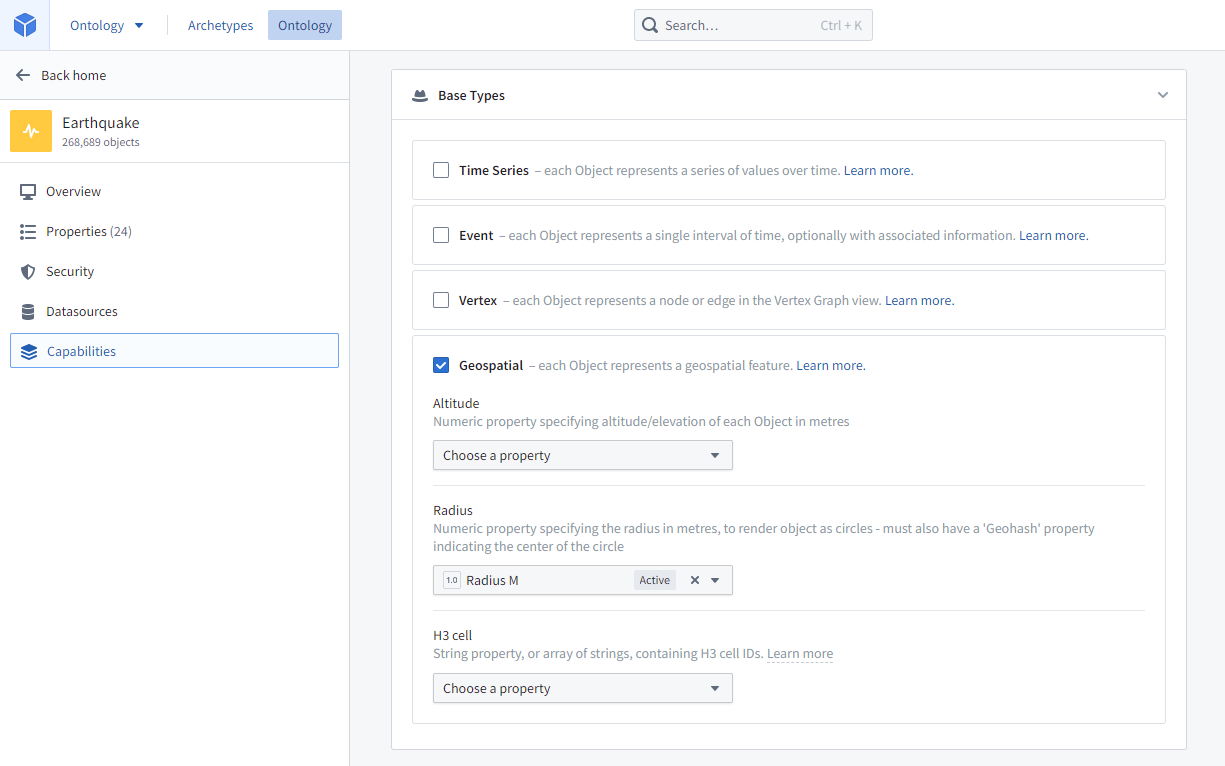
The circle geometry is only rendered on the map, not indexed for searching. If you need objects to be geospatially searchable based on a circle geometry, you will need to approximate a circle using a polygon.
Choropleths
To render choropleth visualizations, you will need to configure your ontology so that objects can be grouped together into regions. There are two ways to do so, boundary identifiers and linked objects.
Boundary identifiers
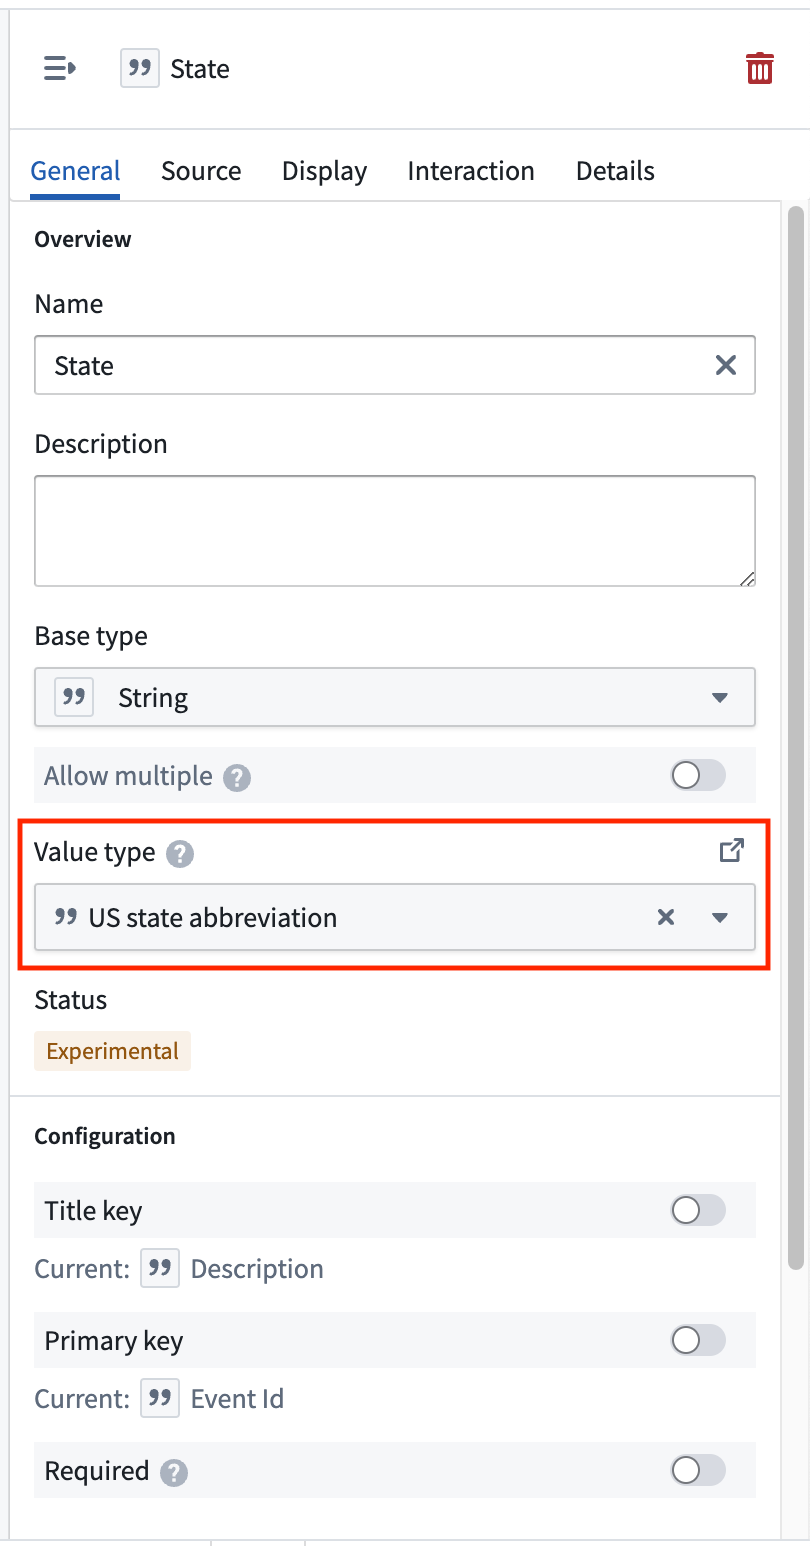
Maps support rendering choropleths for objects that are configured with some common region identifier types -- including ISO 3166 country codes, US State abbrevations, and more. The polygon geometry for these boundary types is built into the map application, making your data integration easier if your data already has one of these identifier types attached. These identifiers are configured by attaching a specific Value Type to a property on the object type you want to map.
To configure boundary identifiers, first search for and install the "Choropleth Value Types" product in Marketplace. This product contains the ontology value types that the map application knows how to render as choropleths.
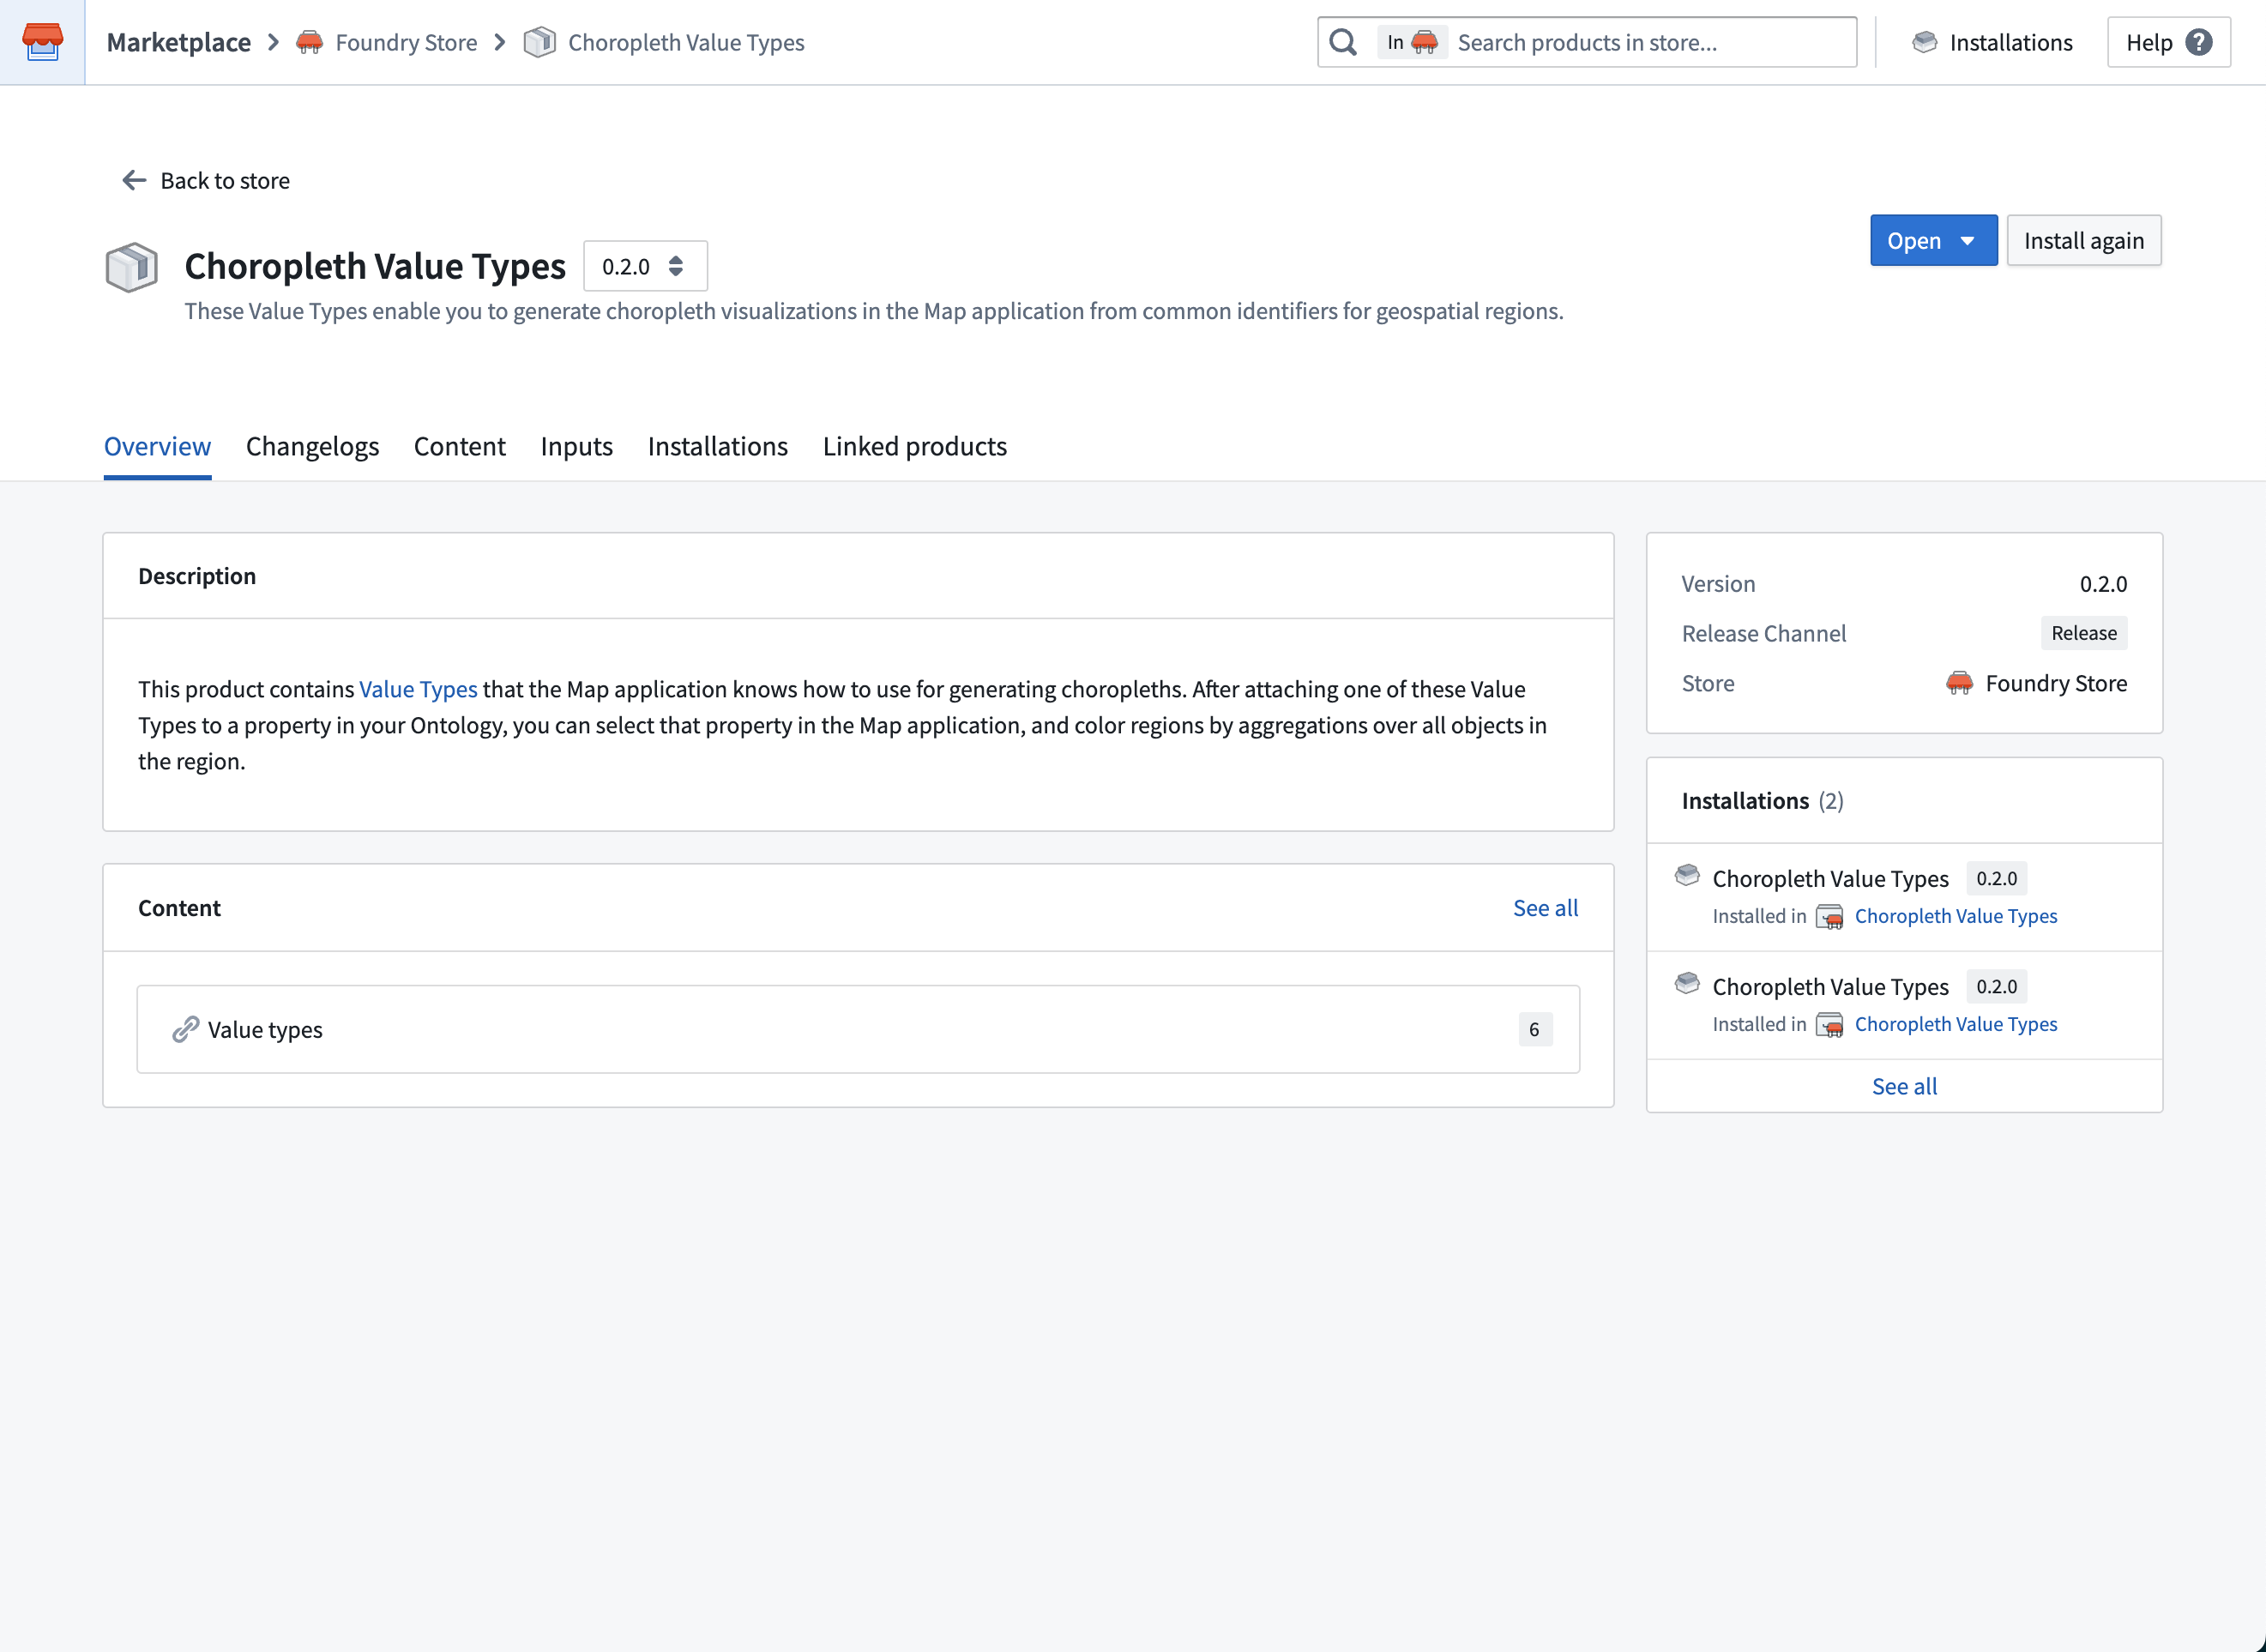
The current supported region types and ways of identifying them are:
- Admin 0 (global administrative level 0 boundaries)
- ISO 3166 alpha-2 country codes
- ISO 3166 alpha-3 country codes
- US States
- FIPS codes
- USPS abbrevations
- US Counties
- FIPS codes
- ANSI codes
If your object type already has a property the contains one of these identifiers, select the corresponding value type in the Value Type dropdown menu for that property in Ontology Manager.
If you want to display choropleths for one of the region types above, but your data has latitude/longitude points instead of one of the supported identifiers, use the "Choropleth Boundary Datasets" product from Marketplace to attach the region identifiers. This product contains datasets that contain the actual geometries and other metadata for the regions. Use Pipeline Builder's Geometry intersection join to find the region that each point lies within and attach the corresponding region identifier, then configure the corresponding value type in ontology manager.
Linked objects
If you want to display a choropleth with a region type is not included above, or otherwise want more control over the region geometries and properties on the regions, you can create an object type with region geometry of your choice. Then create a many-one link from the object type you want to aggregate over to that region object type.
For example, imagine you want to display a choropleth that shows the total value of orders placed for each sales region. A simple way to configure the ontology for this is to have:
- A "Sales region" object type with a geoshape property containing the geometry of each sales region.
- An "Order" object type, with the properties:
- "Sales region" that contains the primary key of the region each order was placed in
- A "Value" that contains the total value of the order
- A many-one from "Order" to "Sales region"
To display the choropleth:
- Use the search dialog to add your "Order" objects to the map
- Add a Choropleth geometry for the "Order" layer
- Choose the Linked object option in the Regions section, and select the link type that links from an "Order" object to its associated "Sales region".
- Use the "Value" property in styling aggregations to control the color of each region
H3 hexagons
Objects can include string properties containing H3 cell IDs from the H3 geospatial indexing system ↗. These will render as relevant hexagons on the map.
To specify that a string property contains H3 cell IDs, select that property under H3 cell in the Geospatial section of the object type's Capabilities tab.
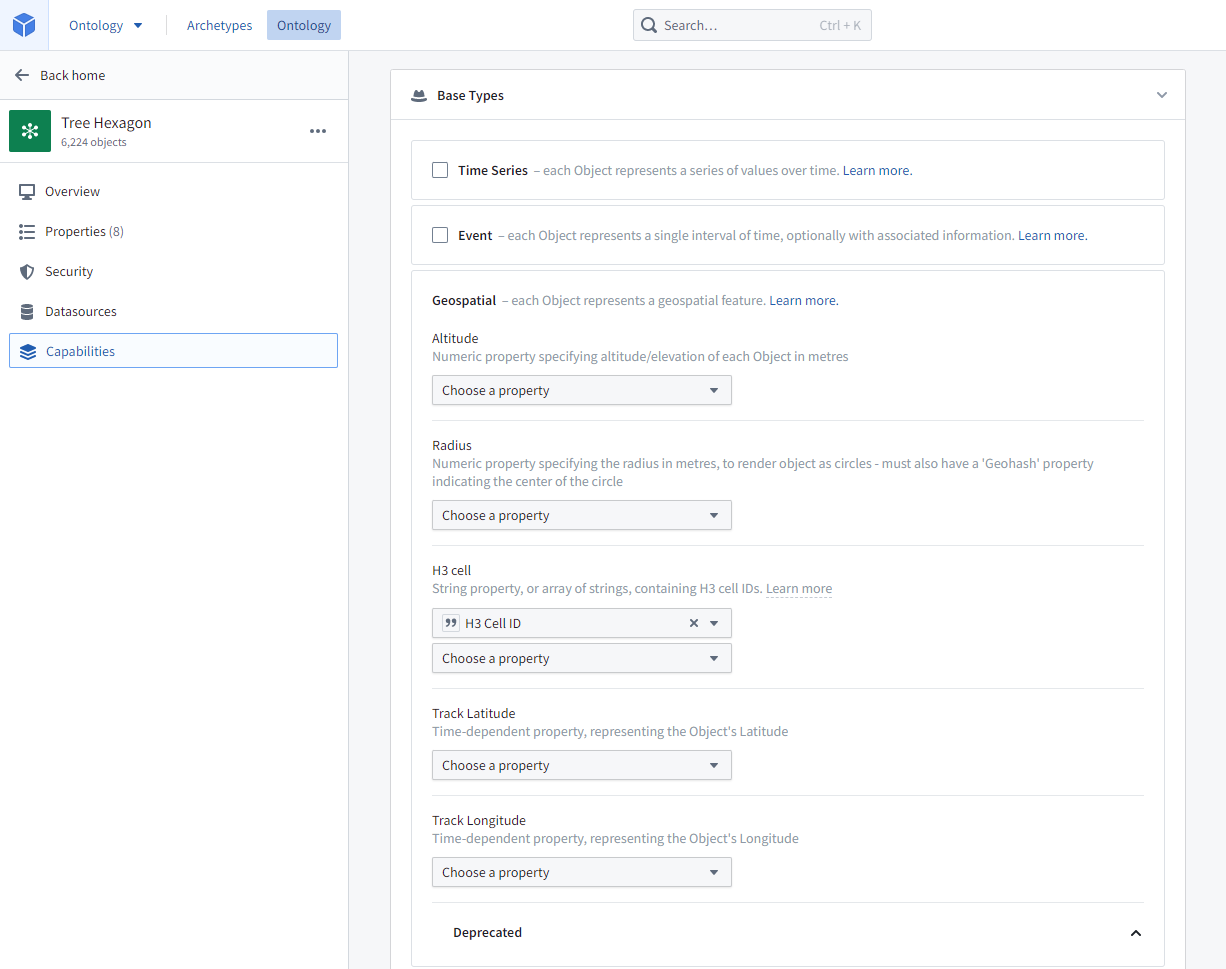
The H3 hexagon is only rendered on the Map, not indexed for searching. If you need objects to be geospatially searchable based on a H3 hexagon, you will need to convert the H3 cell IDs into GeoJSON Polygons and include them in a geoshape property as described above.
Georectified images
An object can have georectified images attached, such as a satellite photo, aerial imagery, or a scan of a physical map. Two properties are required for the georectified image:
- An image URL
Stringproperty containing the URL of the image to render. Supported image file extensions include.png,.jpg,.jpeg,.gif,.webp,.bmp,.ico, and.svg. The ID of the image URL property is used to configure the image bounds property. - An image bounds
geoshapeproperty containing a GeoJSON Polygon of a quadrilateral representing the georectified bounds of the image. The polygon must specify its vertices in clockwise order, beginning with the bottom left corner.- The image bounds property must have a type class indicating the ID of the image URL property, in the following format:
- Kind:
geo - Value:
bounds.<image URL property ID>where<image URL property ID>is the ID of the image URL property.
- Kind:
- For example, if the image URL property ID is
image_urlthen the typeclass would be: Kind:geo, Value:bounds.image_url
- The image bounds property must have a type class indicating the ID of the image URL property, in the following format:
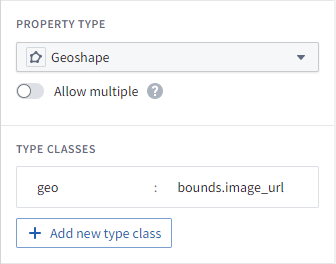
Objects with georectified images are indexed for geospatial search, as with all geoshape properties.
Tiled imagery from media sets [Beta]
Using media references in Maps is in the beta phase of development and may not be available on your enrollment. Functionality may change during active development.
Georeferenced raster imagery can also be displayed in tiles by uploading GeoTIFF imagery in a (.tiff, .tif) to a media set. From there, object types with a media reference property can be added to the map and only the visible portions of the imagery will be loaded as the user pans or zooms around the Map.
Track objects
Objects can have numeric time series properties representing an object's latitude and longitude over time, allowing users to see the path the object traveled over time as well as its location at any point in time.
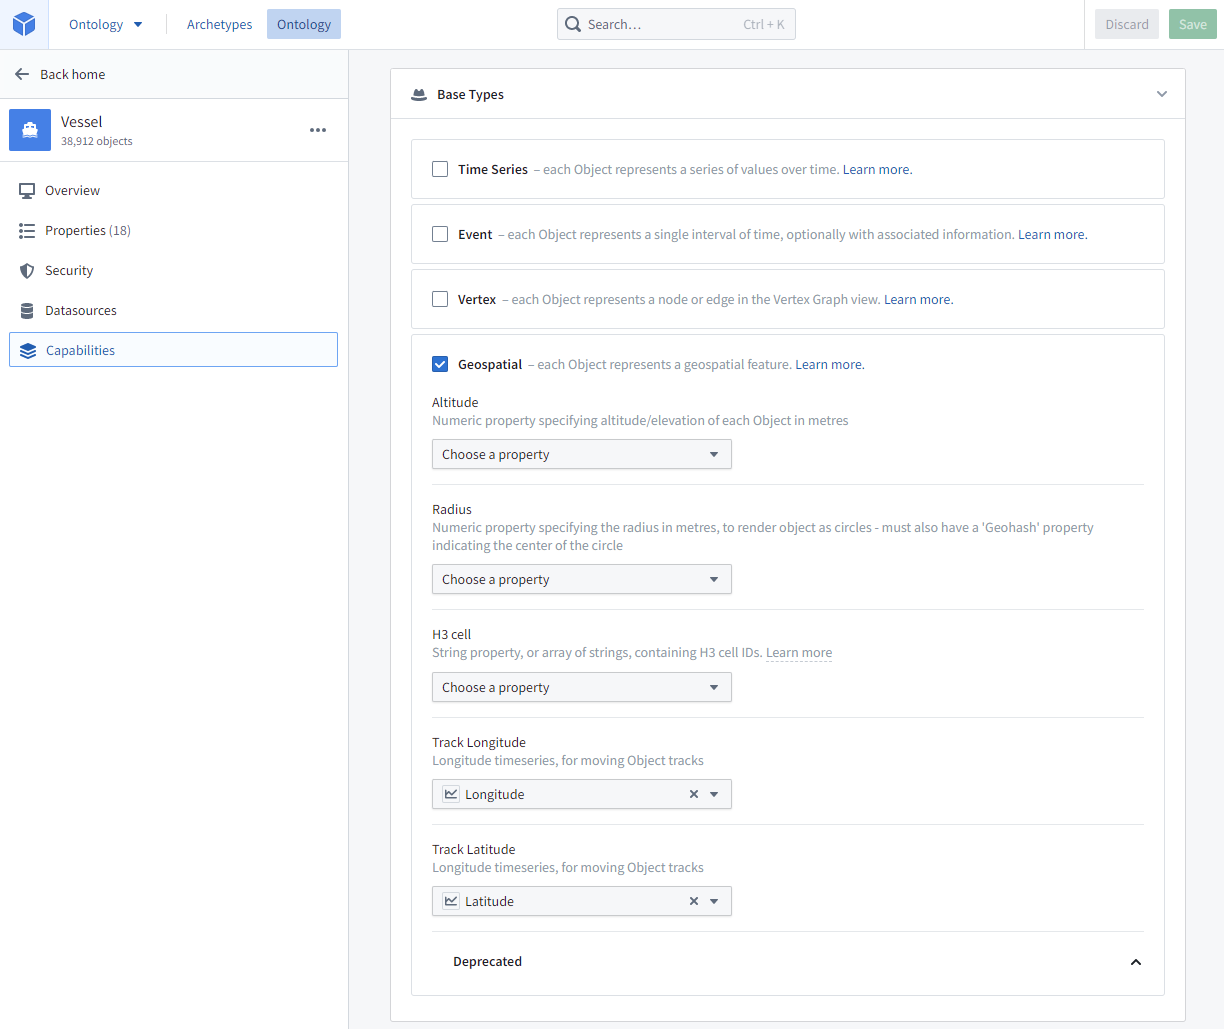
To configure the track for the object type, select the Track Latitude and Track Longitude properties in the Geospatial section of the object type's Capabilities tab. Both properties must be numeric time series properties representing the object's location over time. See Time series setup for more information on configuration time series, and track geometries for more information on the options in maps for visualizing tracks.
Event objects
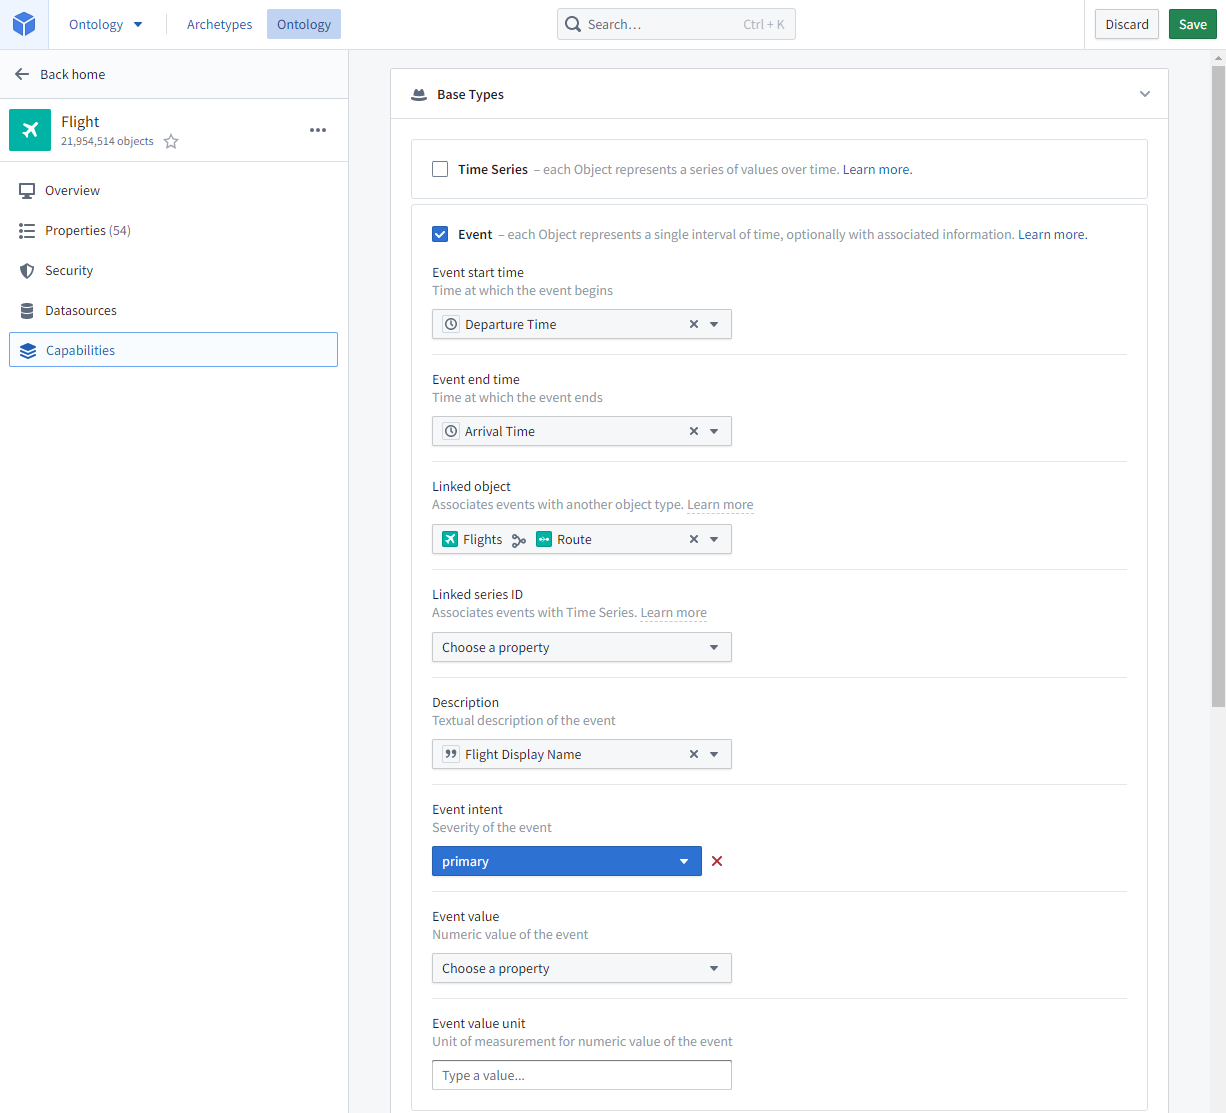
Event objects are Ontology objects that occur at a point or period of time. Object types can be configured as events by specifying Event start time and Event end time timestamp properties in the Event section of the object type's Capabilities tab.
Event objects on the map
If event objects are added to the Map, they can be configured to only display when current (that is, when the selected timestamp is within the event period).
Event objects linked to objects on the map
If objects on the map have event objects linked to them, the event objects can be added to the Series panel for temporal analysis, and current event count indicators can be added to object labels. For example, a road object could be represented as lines on the map, and a road object may have linked traffic accident events; a user could then use the indicators to see traffic event counts for each road at any point in time.
For this to be possible, the event object type must be configured with an Event intent indicating the severity of the event in the Event section of the object type's Capabilities tab.