Debug

Use the debugger tool in Code Repositories to examine the behavior of your unit test while it runs. Set breakpoints to pause the execution of the unit test in order to examine variables, and understand functions and libraries.
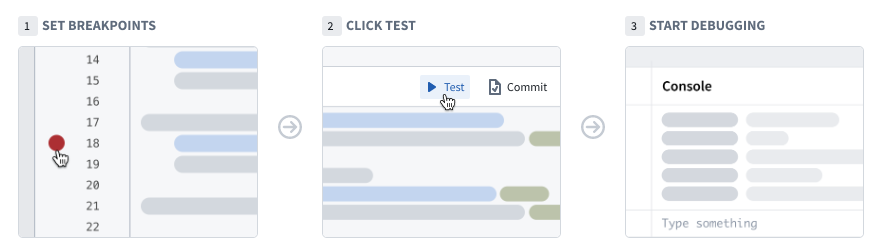
Debugger overview panel

Set breakpoints

To use the debugger, you need to set breakpoints. These breakpoints indicate the specific points where the debugger should pause the code execution, enabling you to interact with variables.

Set a breakpoint by selecting the faded red dot in the margins of each line of code. The debugger suspends the execution before the marked line runs. You can set multiple breakpoints across several files, if needed.

debugger breakpoints

Run the debugger

After adding breakpoints in your code, select Run test, located next to the unit test in the code editor. The debugger panel will open and pause on the first breakpoint it encounters. The left bar of the debugger allows you to navigate the code, remove breakpoints, and finish/stop the debugging session.

debugger layout

As you navigate in the code, the editor highlights the line of code to be executed next. Use the following buttons to advance the debugger:

debugger controls

  1. Resume execution: Continue execution until completion or until paused by the next breakpoint.
  2. Step over: Execute the line of code without stepping into internal functions.
  3. Step into: Navigate into internal functions if they exist in that line of code.
  4. Step out: Navigate out of an internal function and advance the debugger.
  5. Stop execution: Stop the debugger completely.
  6. Remove breakpoints: Remove all breakpoints from the repository and run the unit test without pausing the execution.
  7. Settings: Toggle the debugger on/off (without clearing the breakpoints).
  8. Documentation: Open the documentation for additional details.

Examine variables

While the debugger is running, you can examine the variables and data at the exact point of code execution.

Frames

Frames represent the functions in which the debugger is active or breakpoints exist. Each frame indicates the name of the function followed by the name of the file and the line number in which the function is written.

Select a frame to examine the variables within that frame and run console commands against it.

Variables

The variables section displays the values stored in both local and global variables while the transform is executed.

debugger variables

Console

The console allows you to interact with your data using Javascript console commands while running the debugger. There are two commonly used patterns in the console:

Note that the console operates within the context of the selected frame. Attempting to execute commands on variables local to a different frame will lead to an error.

debugger console