- Capabilities
- Getting started
- Architecture center
- Platform updates
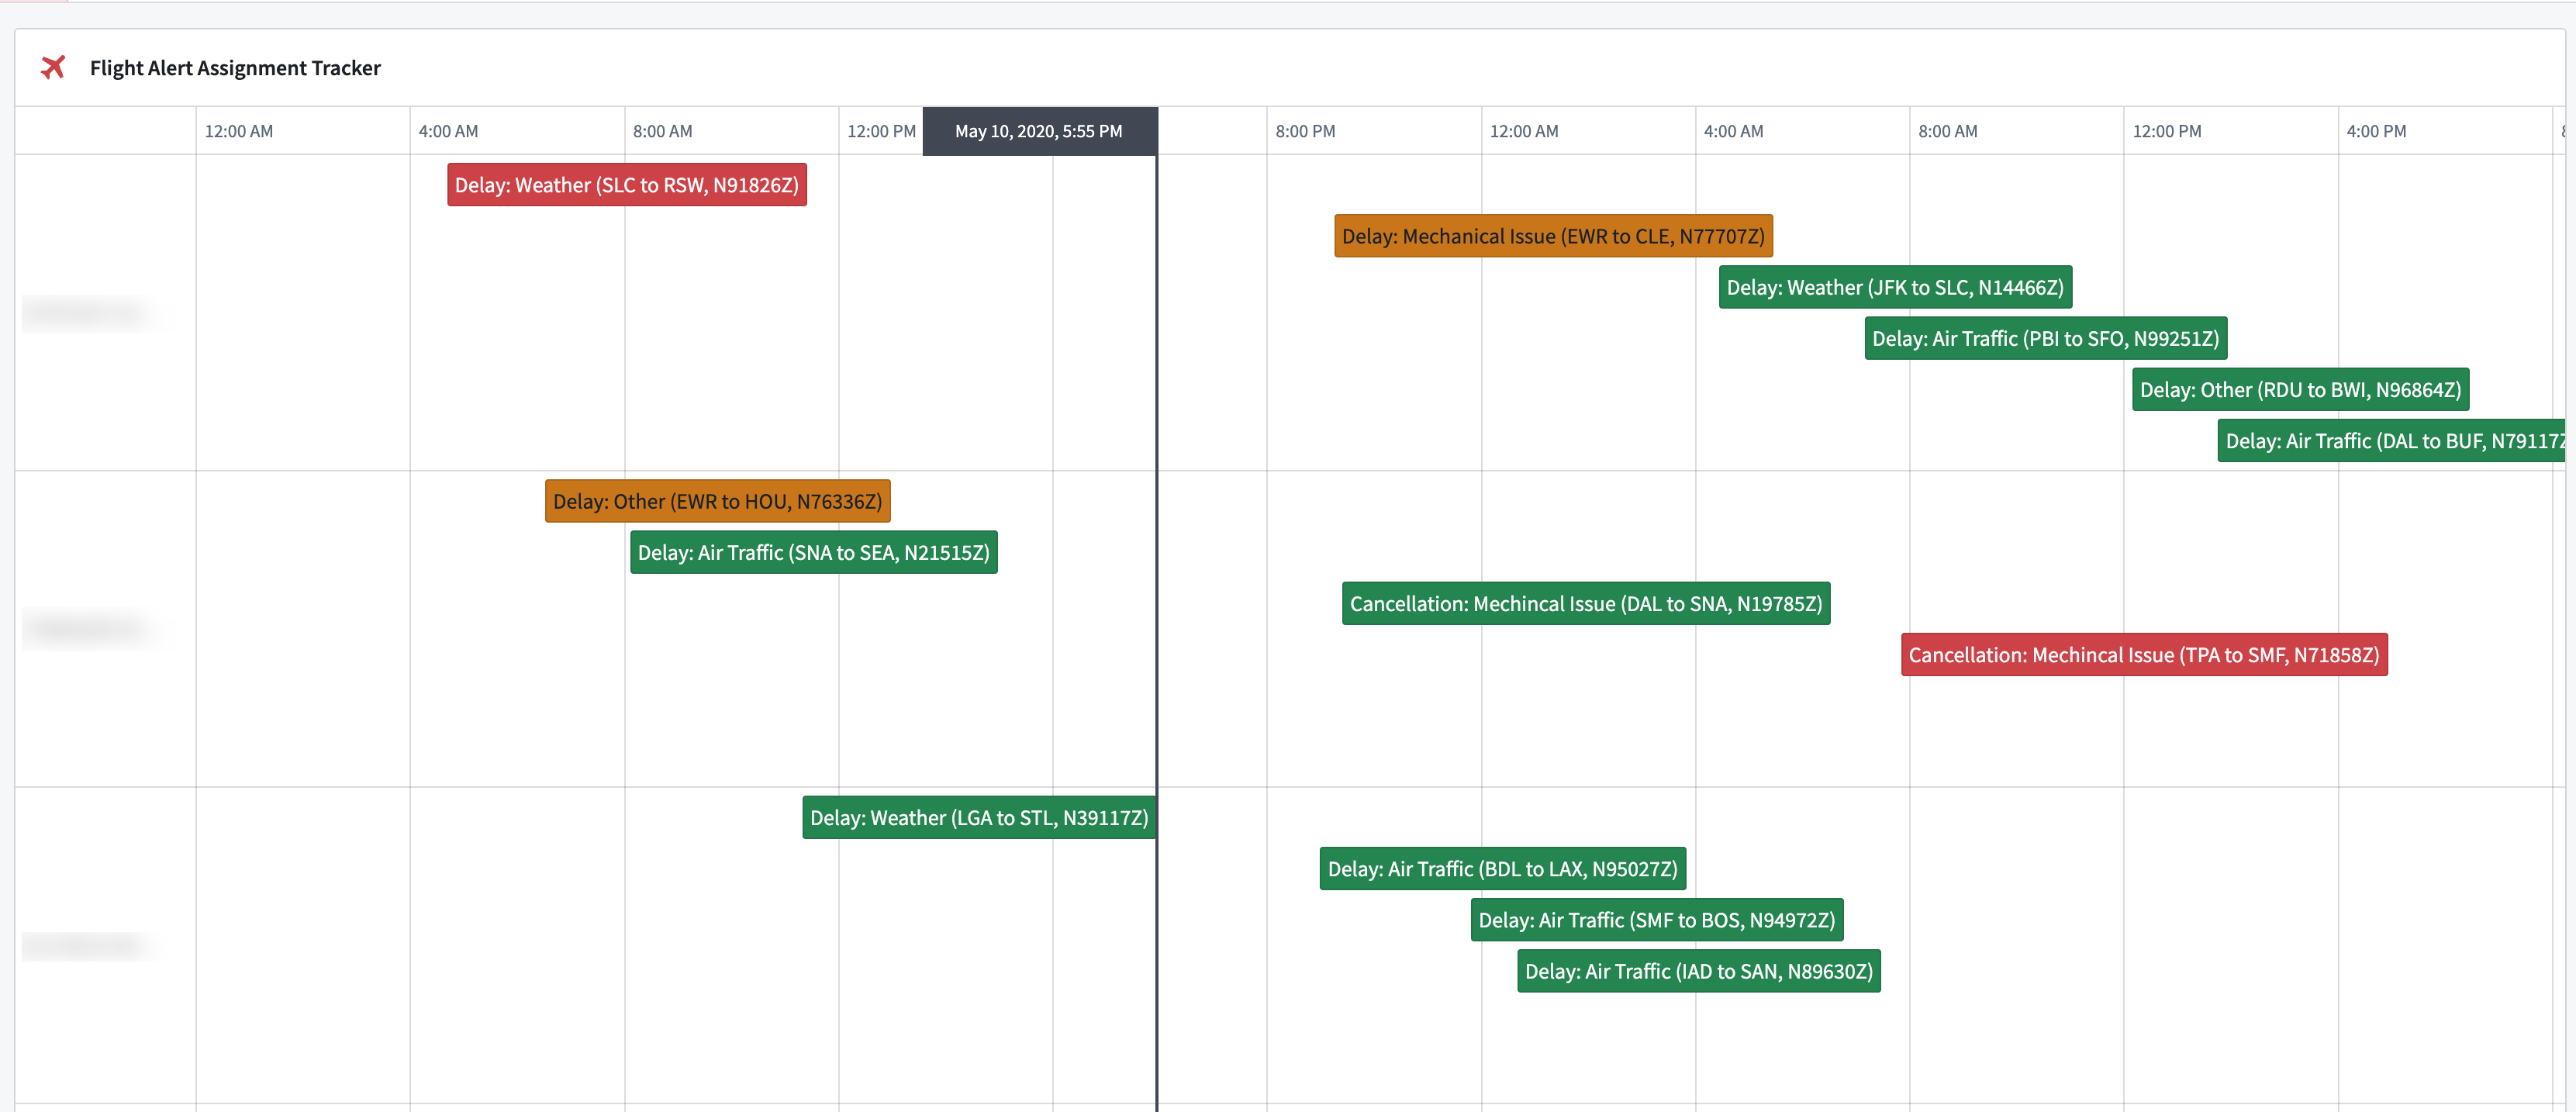
Gantt Chart
Use the Gantt Chart widget to display objects as timed events in an interactive Gantt chart view to help with scheduling or resource allocation workflows.
Configuration options
- Data layers
- You can use multiple layers to aggregate temporal data across multiple object types as events on a single Gantt chart.
- Layer name: The name of the layer to help differentiate between different layers during configuration. This value is not displayed in the chart itself.
- Input
- Object set: The inputted object set definition that will display for a chart layer.
- Load data from scenario: Select the Scenario to load data for a chart layer.
- Event type:
- Time range: Display events as a range with a specified start and end time.
- Event start date property: Select a date or timestamp property to use as the start time of the events.
- Event end date property: Select a date or timestamp property to use as the end time of the events .
- Event label property: Select a property to use as the displayed label value for the event.
- Handling events with no end time: Select how to handle events with no end time value.
- Exclude: Do not display the event on the chart.
- Draw as point: Display the event as a single point on the chart.
- Use specific timestamp as end time: Set a fallback timestamp variable to be used as the end time.
- Discrete: Display events as a single point on the chart using a single date or timestamp property.
- Time range: Display events as a range with a specified start and end time.
- Display and formatting
- Group by properties: Group objects together on the Gantt chart by common property values.
- Event color: Select the color(s) to use when displaying events in the chart.
- Static: Select a single color for all events.
- Property: Select an object property with pre-configured conditional formatting rules through the Ontology to determine the color(s) of events.
- Dynamic: Configure conditional formatting rules to apply on events in the chart.
- Properties on hover: Select object properties to display on hover over the object event in the chart.
- Output
- Enable selection: Toggle to enable/disable a selection of objects on the chart.
- Enable multiselect: Toggle to enable/disable a selection of multiple objects on the chart by using
Ctrl(macOS) orCmd(Windows) plus click. - Selected object set: The object set variable of the selected objects.
- On selection: Set a Workshop event to trigger on selection of an object on the chart.
- You can use multiple layers to aggregate temporal data across multiple object types as events on a single Gantt chart.
- Display options
- Show current time indicator: Display an indicator for the current date directly on the chart.
- Timezone rendering:
- Static: Manually select a timezone for the chart.
- Dynamic: Dynamically set a timezone with a string variable.
- Local: Set the chart timezone to the user’s local timezone.
- Enable grid unit markers: Grid unit markers can be set to yearly, quarterly, monthly, weekly, daily, or hourly. Depending on the selected option, you may need to specify a starting month, day, or hour.
- Stacking options
- New rows: Each event will be displayed in its own row.
- Overlap: Events will be displayed on the same row and may overlap with each other.
- Smart rows: Events will be displayed so they do not overlap by shifting them onto new rows as needed. Non-overlapping events will be displayed on the same row, and overlapping events will be displayed on separate rows.
- Row ordering: If property grouping is configured, set how row groupings are ordered. Options include sorting alphabetically by property or by first event start time.
- Row-level grouping width: Set the width of the property grouping column in the chart.
- Timeline start: Manually set the start time for the chart’s display using a timestamp variable.
- Timeline end: Manually set an end time for the chart’s displaying using a timestamp variable.