- Capabilities
- Getting started
- Architecture center
- Platform updates
View application dependencies
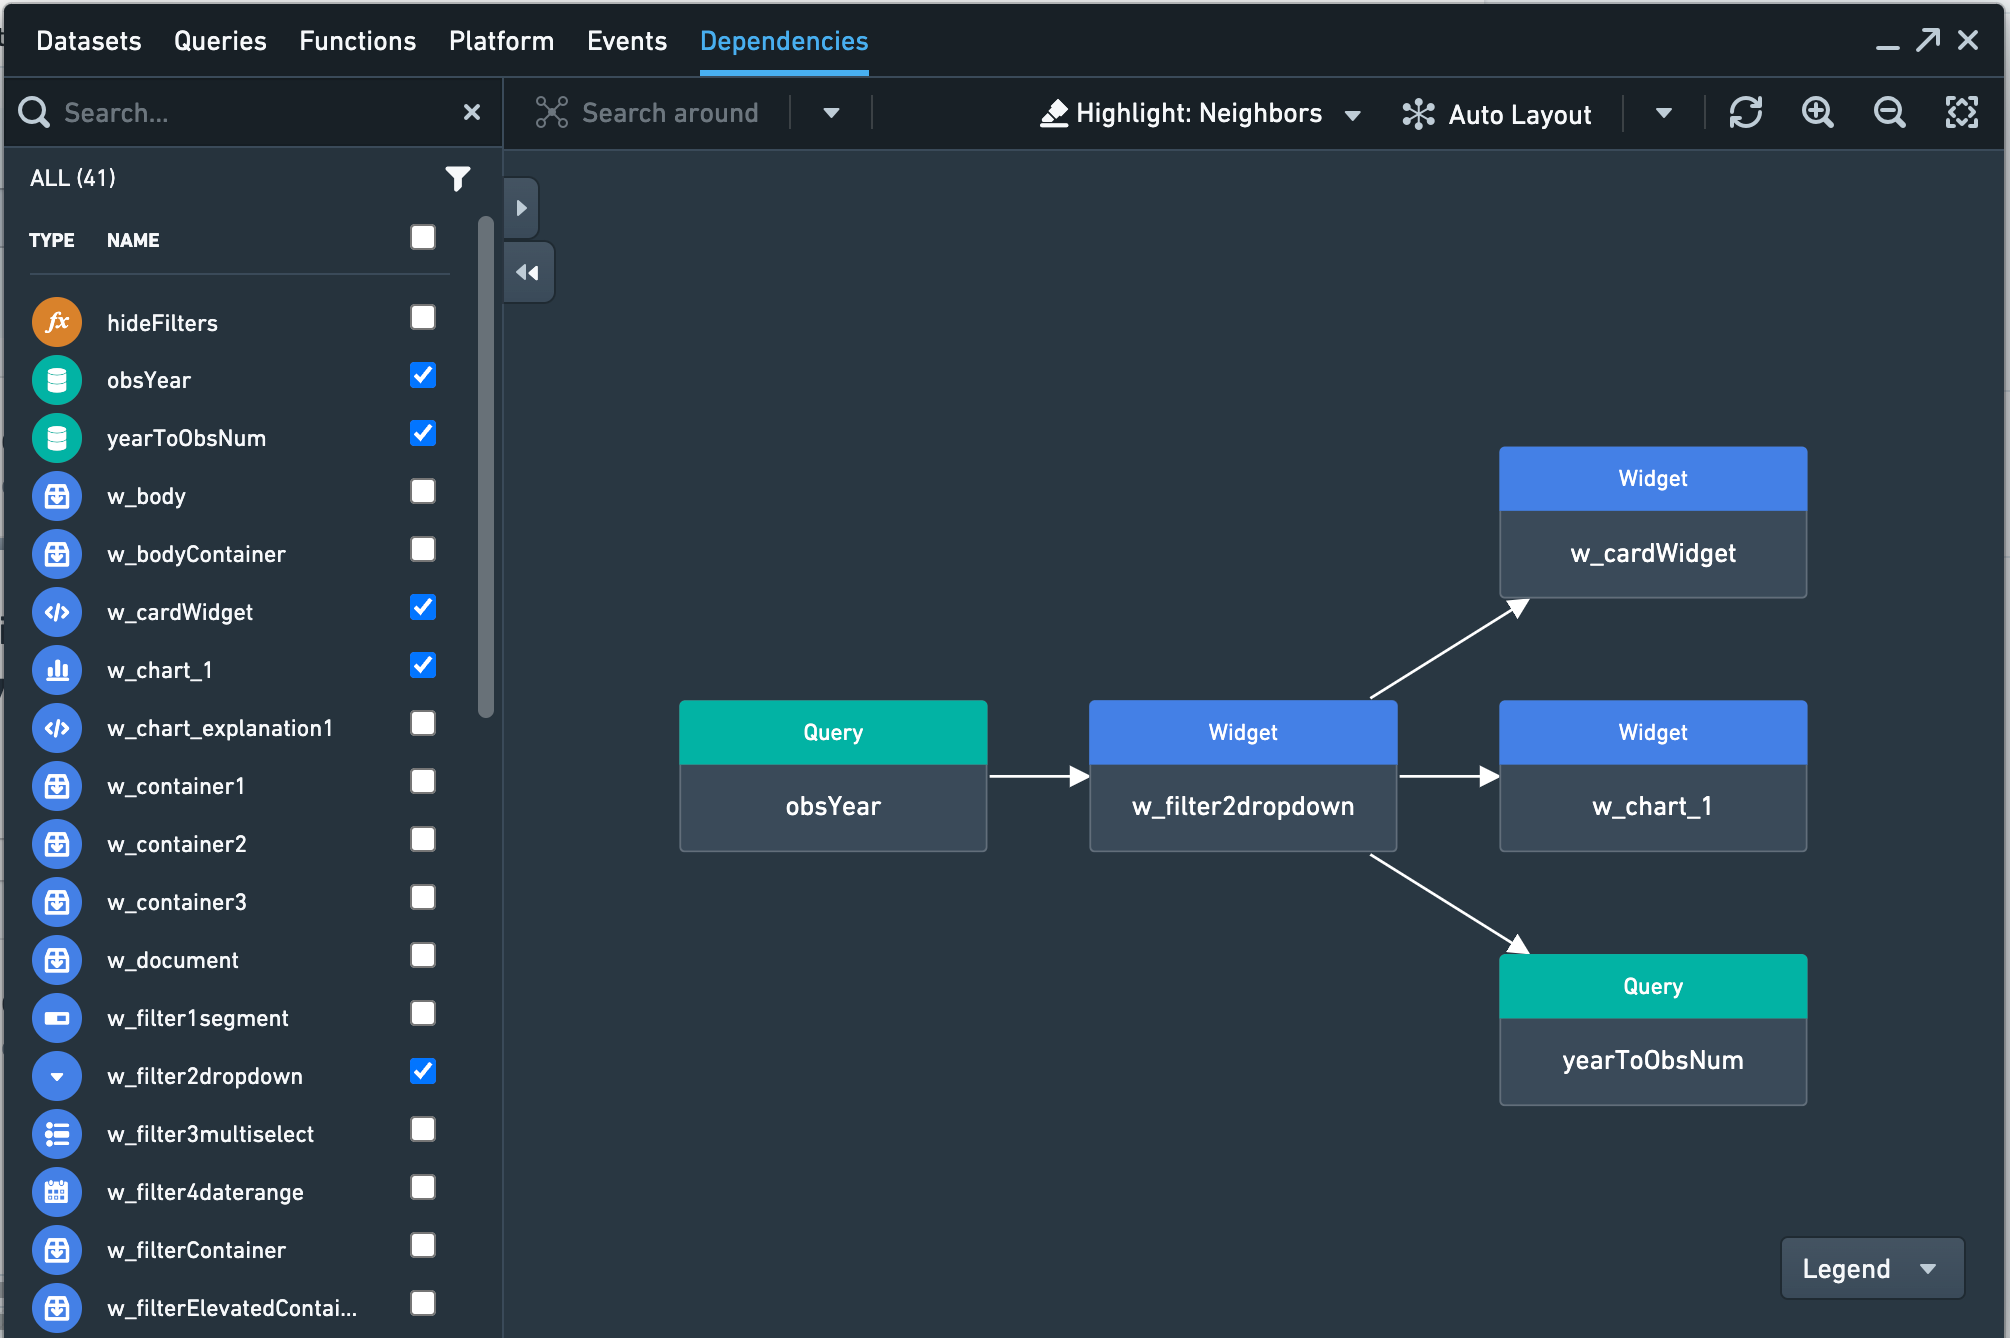
The Dependencies viewer lets you see how elements in your application are related, including widgets, queries, functions, and variables.
Your application is displayed as a graph, with elements as nodes and dependencies as directed edges. The dependency graph does not include information about Function libraries and styles.
To add an element to the graph, tick or double-click the checkbox next to the entry in the list. Once an element is added to the graph, its dependencies can be explored by clicking the chevrons on the right or the left of the element. If no chevron is displayed, there are no elements for the graph to expand.
Use the graph icon displayed in the top right of every element in the graph when hovering over it to navigate to the element, allowing for an easy way to investigate the element in more detail. Select a node or an item in the list to highlight other elements that element depends on (or vice versa).
For example, in the screenshot below, the Dropdown widget named w_filter2dropdown depends on data from a query obsYear. The value selected in that dropdown in turn feeds two other widgets and a query.
You can configure which related nodes are highlighted with the Highlight dropdown. Choose from:
- Selected only: Highlight the selected node.
- Neighbors: Highlight the selected node as well as nodes with an immediate dependency on the selected node (either upstream or downstream).
- Upstream: Highlight the selected node as well as all nodes “upstream” of the selected node (nodes on which the selected node depends, and upwards in the chain of dependencies).
- Downstream: Highlight the selected node as well as all nodes “downstream” of the selected node (nodes that depend on the selected node, and downwards in the chain of dependencies).
The nodes are arranged automatically, but you can click-and-drag nodes to rearrange them on the graph. You can also use the Hierarchy layout button with Upstream or Downstream highlights to see the selected node and its upstream or downstream dependencies as a hierarchy. Select the Restore auto layout button to exit the hierarchy layout.
Use the Refresh button to update the graph if you make changes to your application while the panel is open.
Performance Statistics
You can expand the Dependencies Viewer table to see additional columns with performance data. This data can help you identify which parts of a Slate application might be slow.
- Time in node shows the amount of time spend processing that node. Only applies to queries and functions. For queries, this includes time on the server, latency between the Slate server and the browser, and queueing the request. (Queueing might occur if there are too many queries to run concurrently. For example, the Chrome browser lets you run six queries concurrently, so a seventh query would be queued until another query finishes.) For functions, this includes setup and computation time.
- Server time only applies to queries, and shows the amount of time between when the Slate server receives the request and when the server sends the response back to the browser after retrieving data from the data source.
- Load time for a given node is the amount of time between when the first node of the application begins calculation and when the given node finishes calculation.