- Capabilities
- Getting started
- Architecture center
- Platform updates
Debug applications
Slate applications may become very complex, with hundreds of widgets, functions, queries, and events creating a web of dependencies. Performance issues with a Slate application are often first encountered in the user interface, such as a table missing the expected data or a button failing to produce the expected response. However, the root cause for these issues may be located somewhere in the backend.
The Slate health check dialog and the debugger facilitate error investigation and resolution preventing outdated or inaccurate data in widgets.
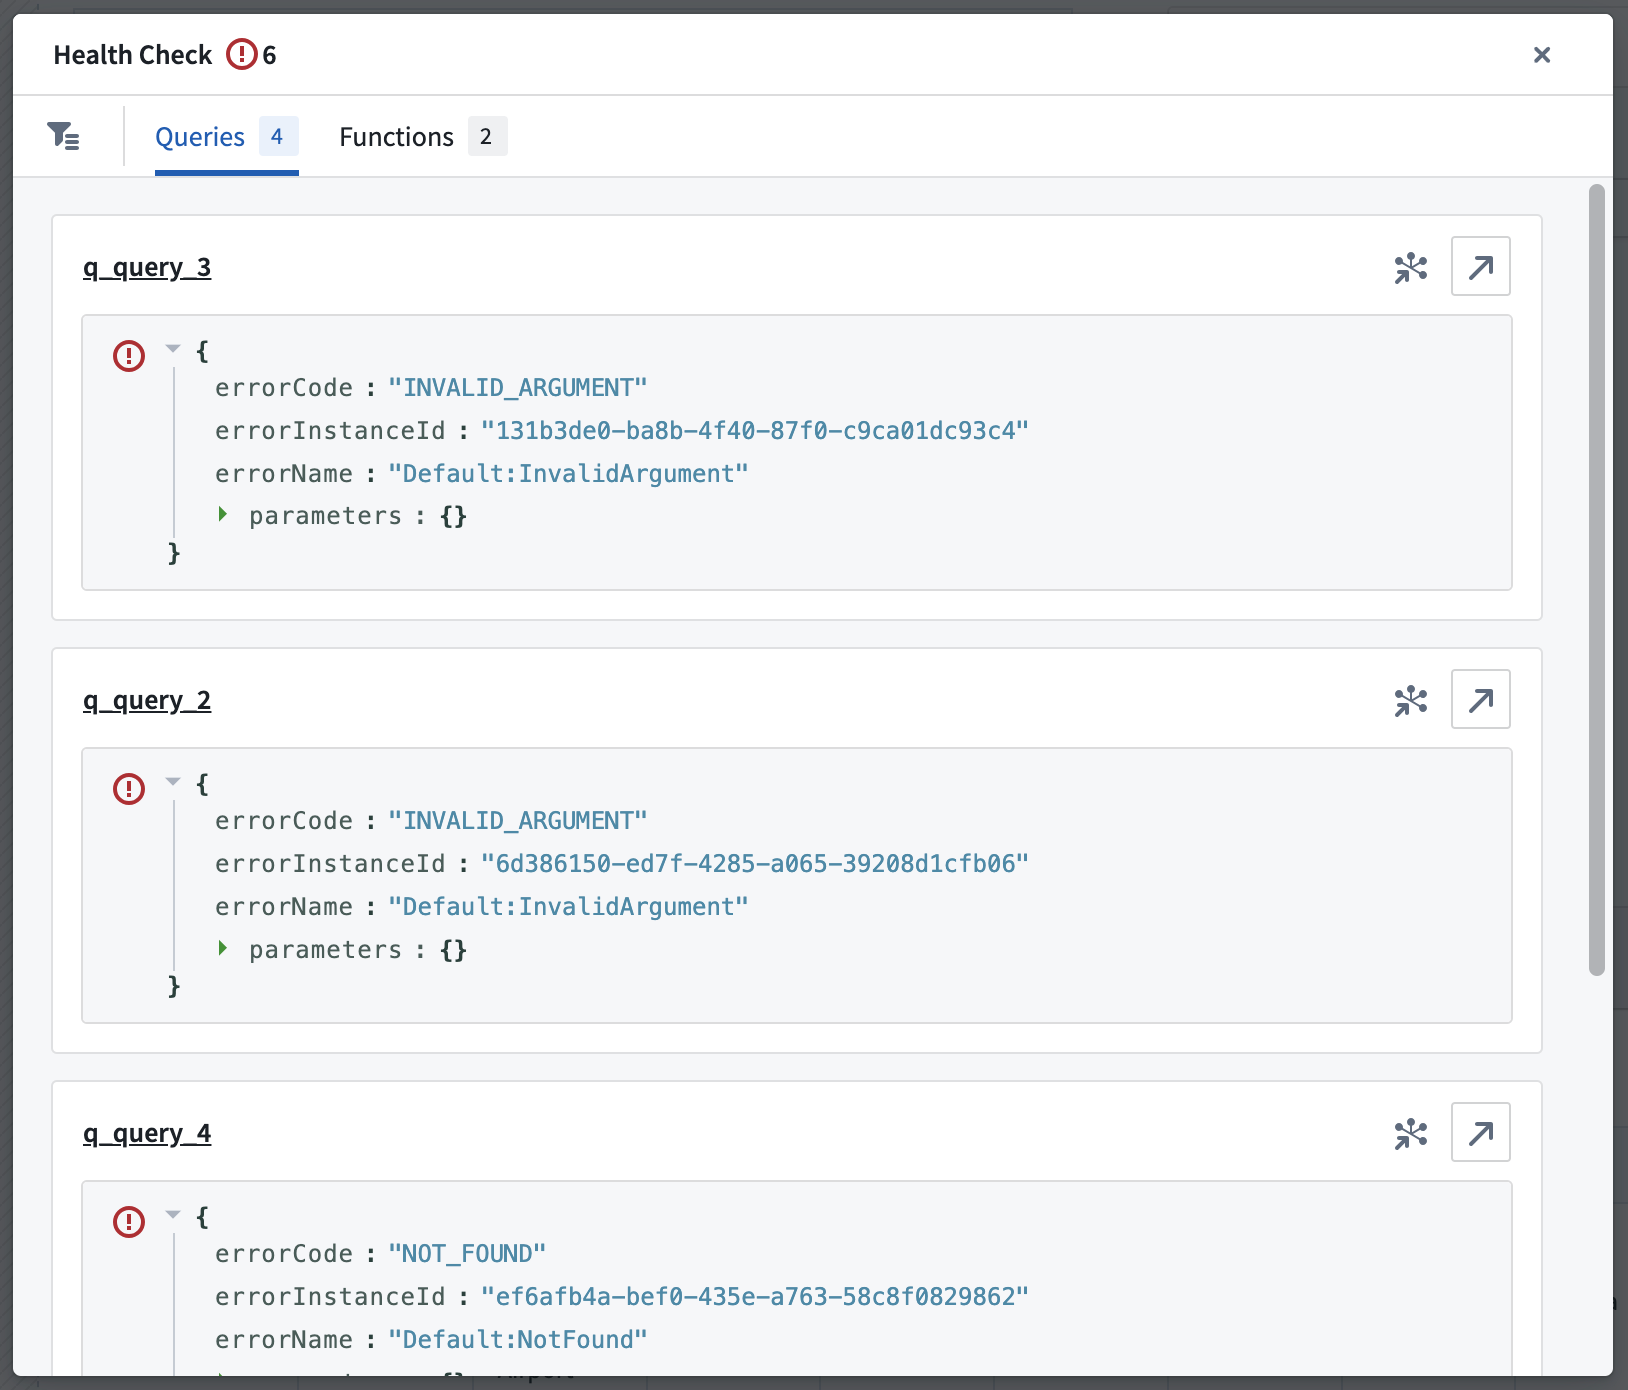
The health check dialog allows application builders to quickly identify and resolve failed queries and functions by consolidating all errors and warnings in a single view.
The debugger enables application testing using breakpoints and makes it easier to discover and address issues across Slate application components. This also helps application builders understand the downstream implications of changes on other application components.
Health check dialog
When a Slate application is opened in edit mode, Slate automatically checks for a successful runtime of all queries and functions upon loading. However, users should note that queries with conditions may not run if the conditions are unmet in the default application state.
Any errors or warnings encountered will appear in the action bar located atop the page.
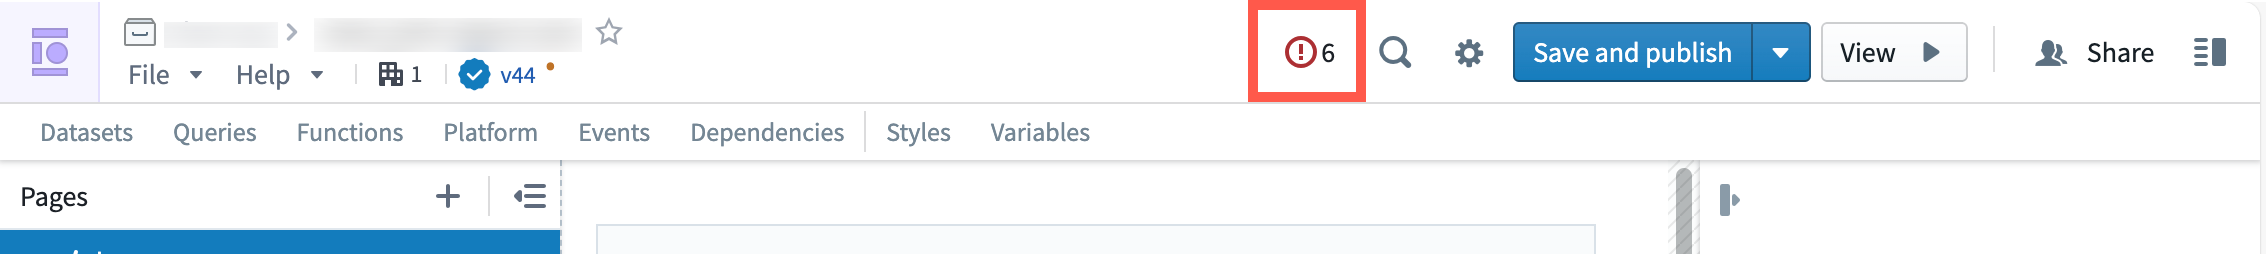
Select the issues icon to open the health check dialog. From here, jump directly to the query or function raising the issue either on the canvas or in the dependency graph view.
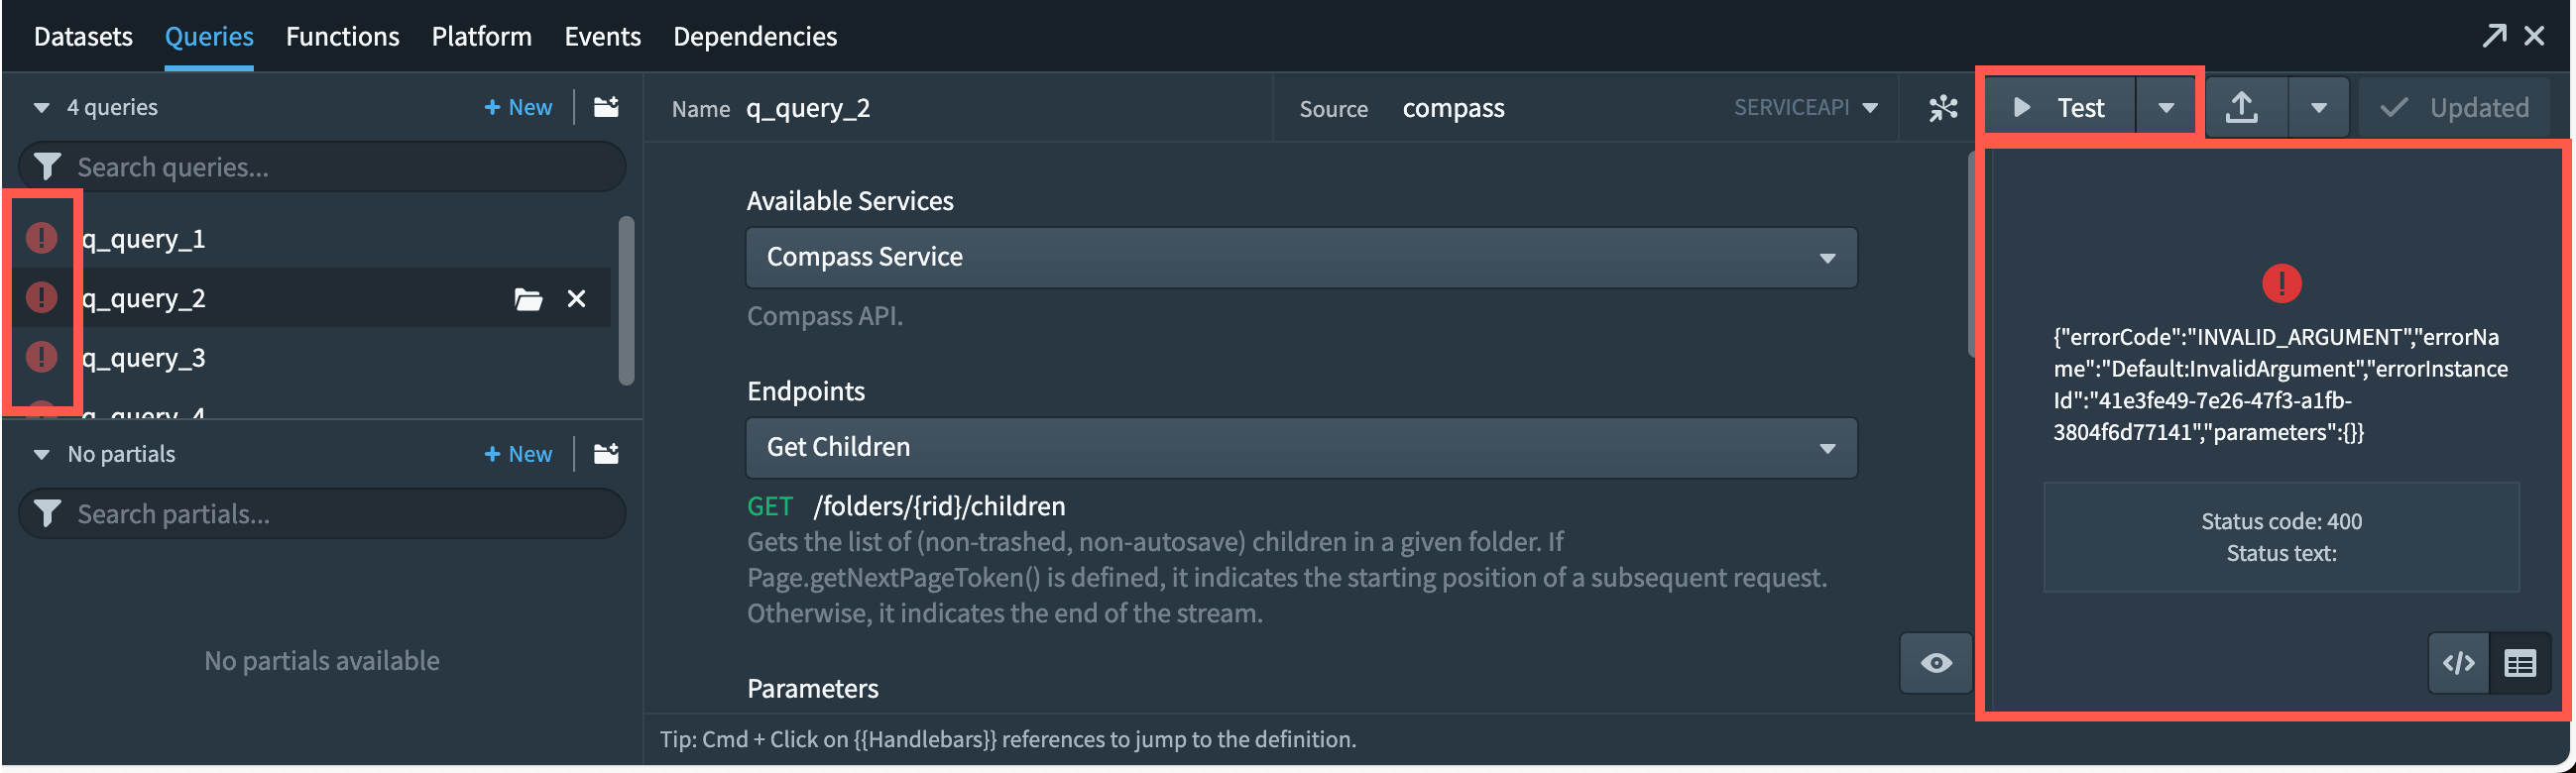
Errors are also visible in the queries or the functions panels. The queries panel will highlight all failed queries. Select Test to run the query and see the detailed error.
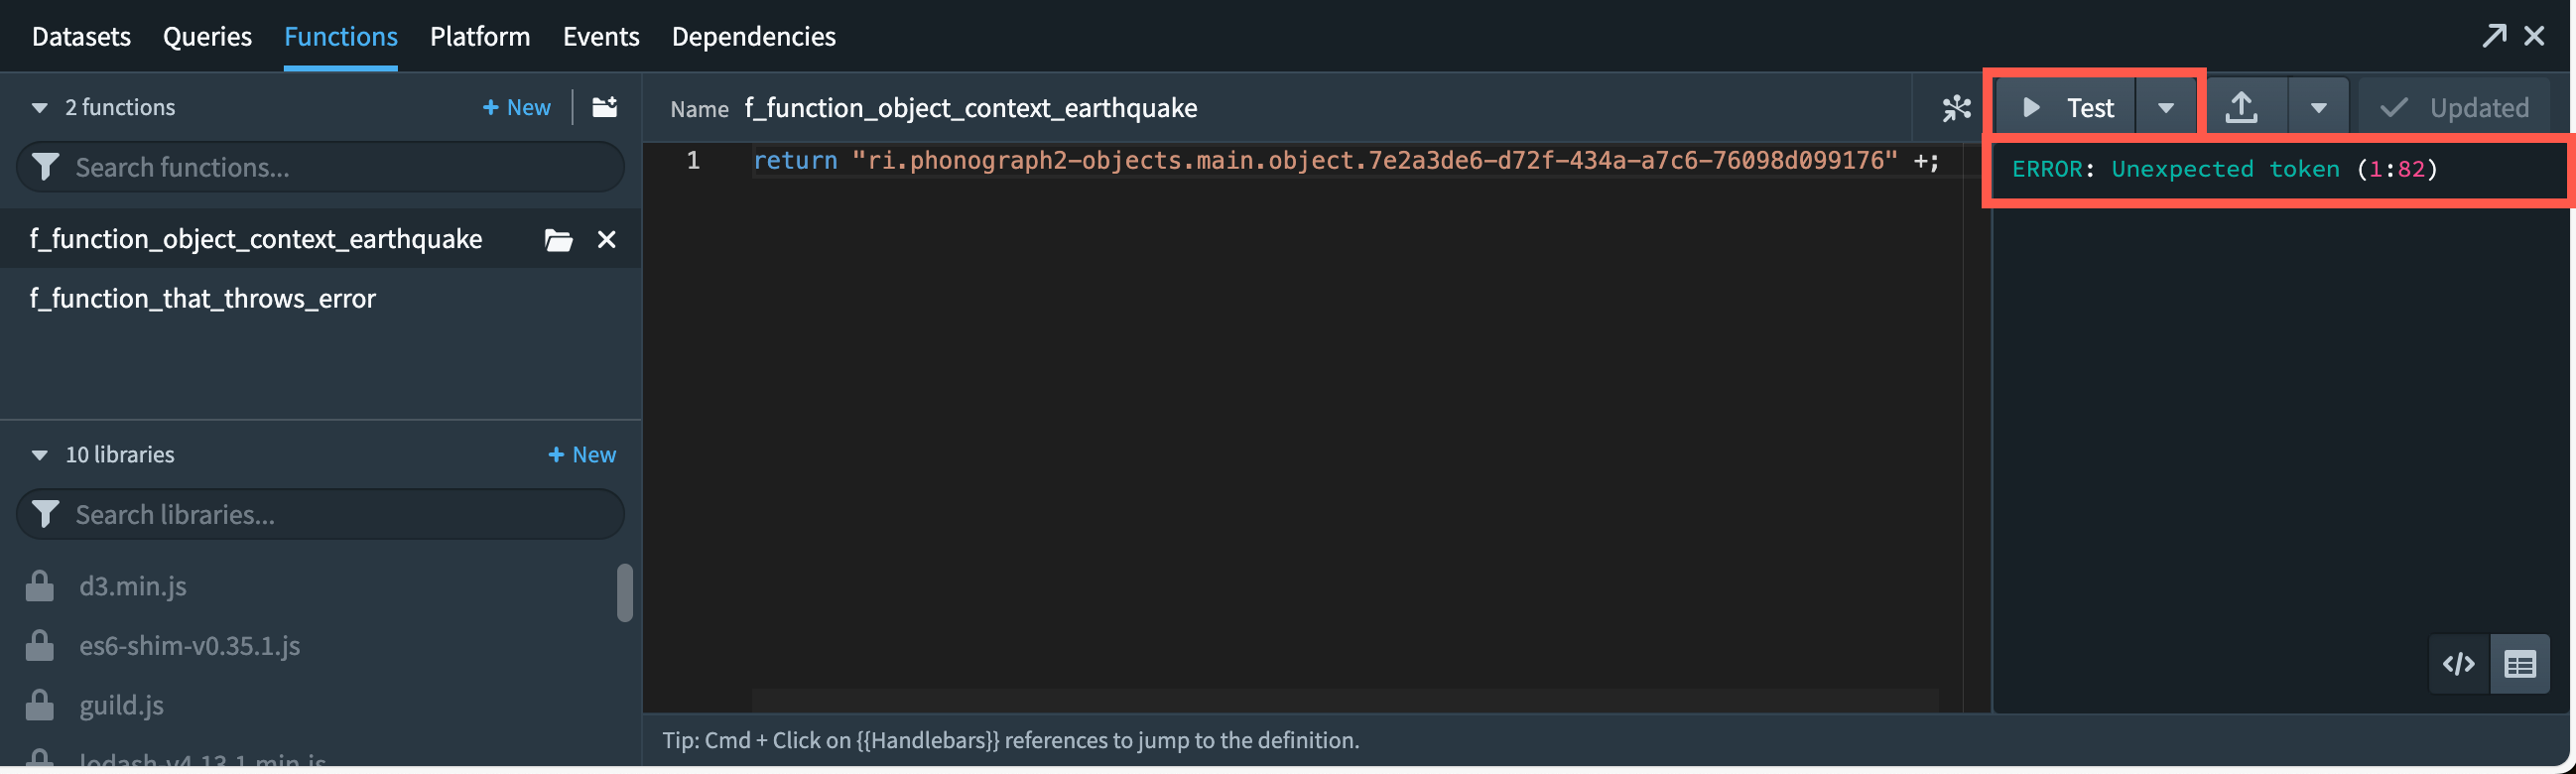
The functions panel will not highlight all failed functions. To run a function, select Test. In the case of failure, this will display a detailed error message for further analysis.
Debugger
The Slate debugger simplifies the process of investigating errors while providing all relevant information in a single view.
Enable debugger
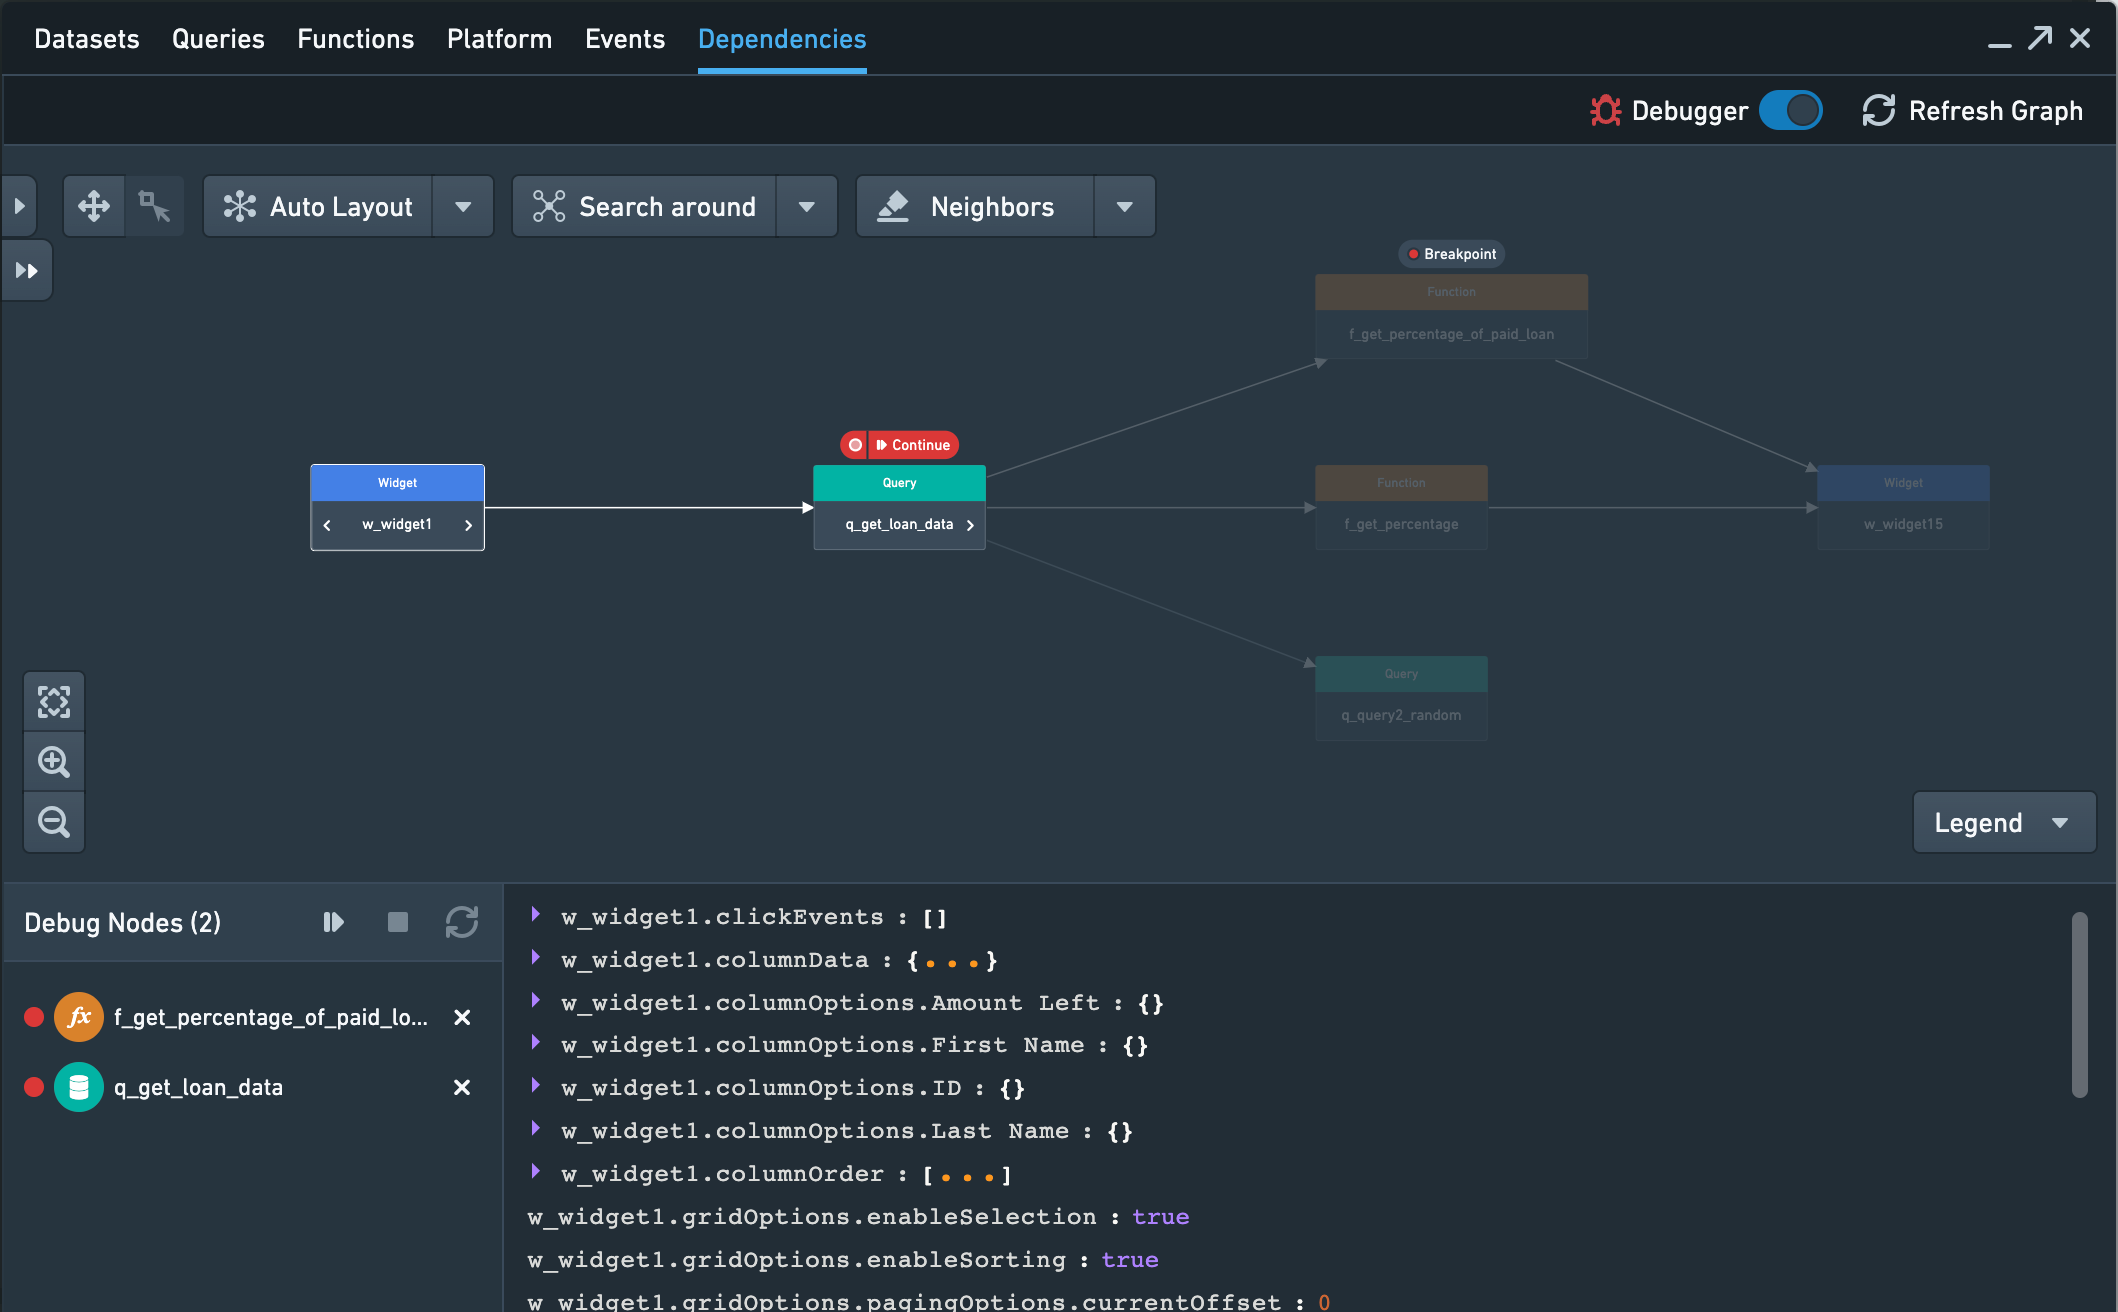
To enable or disable the debugger, toggle on the Debugger in the top-right corner of the dependencies tab.
Enabling the debugger adds a variety of new functionalities to the graph. A new bottom drawer becomes available; on the left side of the drawer, you can see all nodes which currently have breakpoints set. From this drawer, you can run and refresh an application. The right side of the drawer gives a preview of current values of a selected node.
Set a breakpoint
A breakpoint can be set on any component once the component has been added to the graph. To add a breakpoint, hover over the node on the graph and select Breakpoint which will appear above the node. Once a breakpoint has been set, an entry will be visible in the bottom drawer for the node.
When running or refreshing the application, execution will pause before the node with the breakpoint is executed.
Run and refresh nodes
When debugging, you might have to rerun a chain of nodes or components at some point. Nodes can be rerun via different methods. In the debugger, you can select the play button on any node, which executes all nodes starting with the selected one and stops upon reaching the next breakpoint.
You can also refresh the entire application by clicking on the refresh button in the bottom drawer. Refreshing the application will re-trigger all the events without having to reload the page.
Finally, you can trigger nodes manually by performing an action in the Slate application itself. Running a query or selecting a button in the application interface will act like running a node manually in the debugger.