- Capabilities
- Getting started
- Architecture center
- Platform updates
Configure logging [Beta]
Log exporting is in the beta phase of development and may not be available on your enrollment. Functionality may change during active development. Contact Palantir Support for more information.
Applications across Foundry emit logs that provide visibility into their operation, including transform runs, build failures, and other system events.
Foundry logs contain information about:
- Application and function execution events
- Transform and pipeline runs
- Build and deployment activities
- System errors and warnings
Additionally, any user-added logs written in Code Repositories will also be emitted.
These logs can be exported to a Foundry streaming dataset for real-time monitoring and analysis. This feature is only available to Organization Administrators, who can configure a destination where logs from Foundry applications will flow into a Foundry streaming dataset.
Along with log export management, Ontology and AIP in platform log access is managed by Organization Administrators and Information Security Officers.
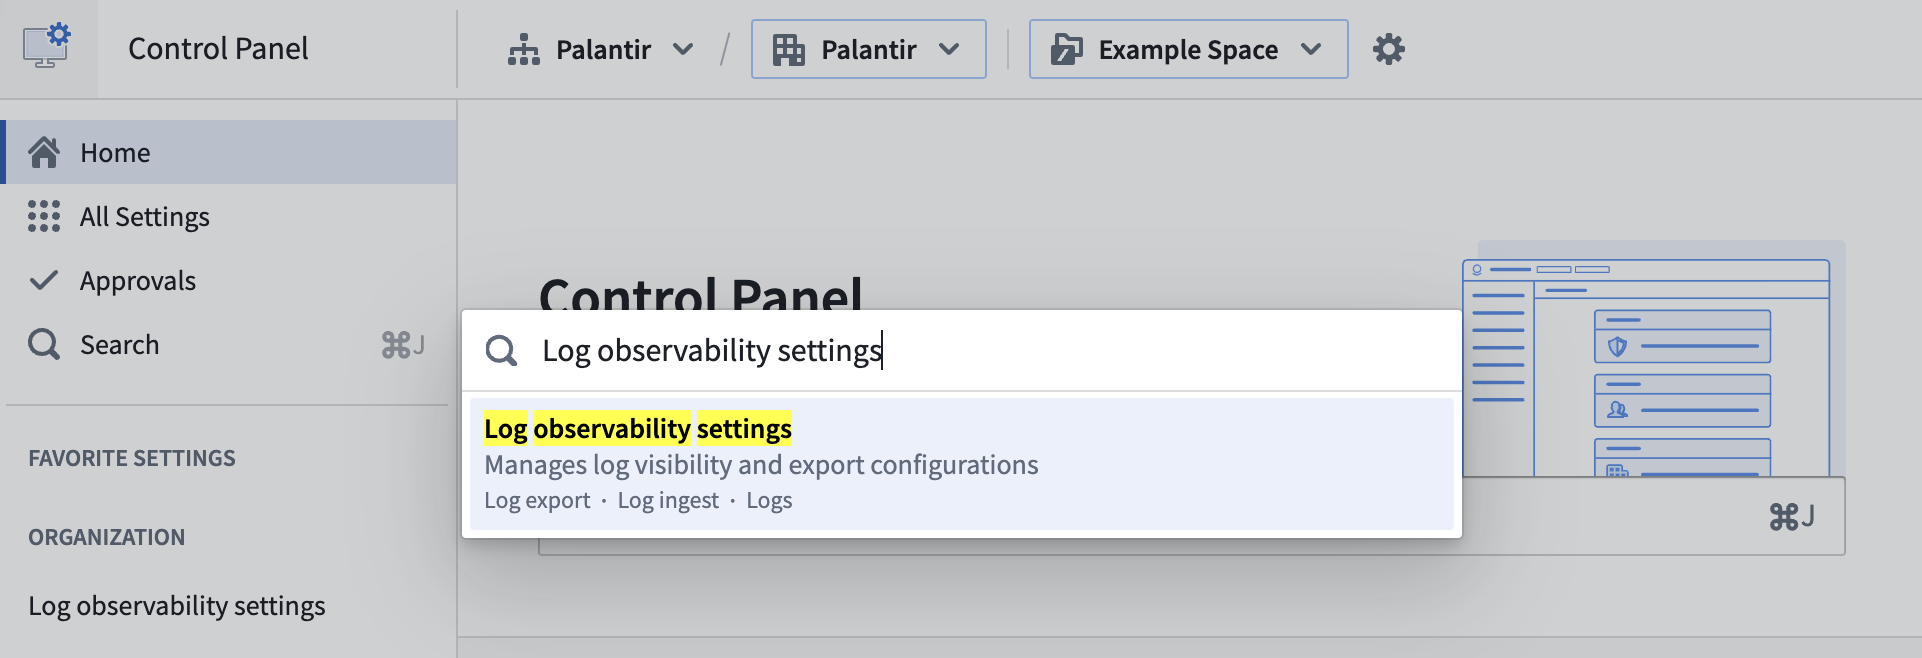
To start managing the log observability settings for your organization:
- Navigate to the Control Panel application.
- In the top banner, select the relevant organization from the dropdown.
- In the left-hand sidebar, select Log observability settings under the Organization section. Alternatively, in the home page, search for
Log observability settingsand select the relevant page in the search results.
Export Foundry logs
Foundry logs can be exported, per-organization, directly into a Foundry streaming dataset.
After defining an export configuration, log entries will be continuously written to the streaming dataset from the time the configuration is created. You can process and analyze the data in real-time using Foundry's extensive suite of data transformation and visualization tools or export the logs to external monitoring systems.
Export permissions
To export Foundry logs, a user must be an Organization Administrator. This role provides the necessary permissions to configure log exporting destinations for the organization. See organization permissions for more details about organization-level permissions.
Log data might contain sensitive information. We recommend applying security markings to the output streaming dataset to control access to this data. You can apply markings directly during export creation or add them to the dataset afterward.
Requirements and limitations
Log exports operate on a per-source executor basis. A source executor is the resource that emits the logs, such as a function, action, or automation. When you configure an export, Foundry collects logs from the source executors that reside in the projects you select and evaluates the constraints below against those source executors rather than against the export dataset alone.
Before you can set up a log export, the following requirements must be met:
- Organization markings must match: The organization marking set of each source executor must match the organization marking set of the export dataset. If the two marking sets differ, logs from that source executor cannot be exported. Ensure that the export dataset lives in a location whose organization markings match those of the source executors you intend to export logs from.
- Actions must use project-based permissions: Any action type included in the export scope must be migrated to Ontology project-based permissions before a log export can be set up for it. Action types still managed by legacy Ontology permissions must first be migrated to project-based permissions.
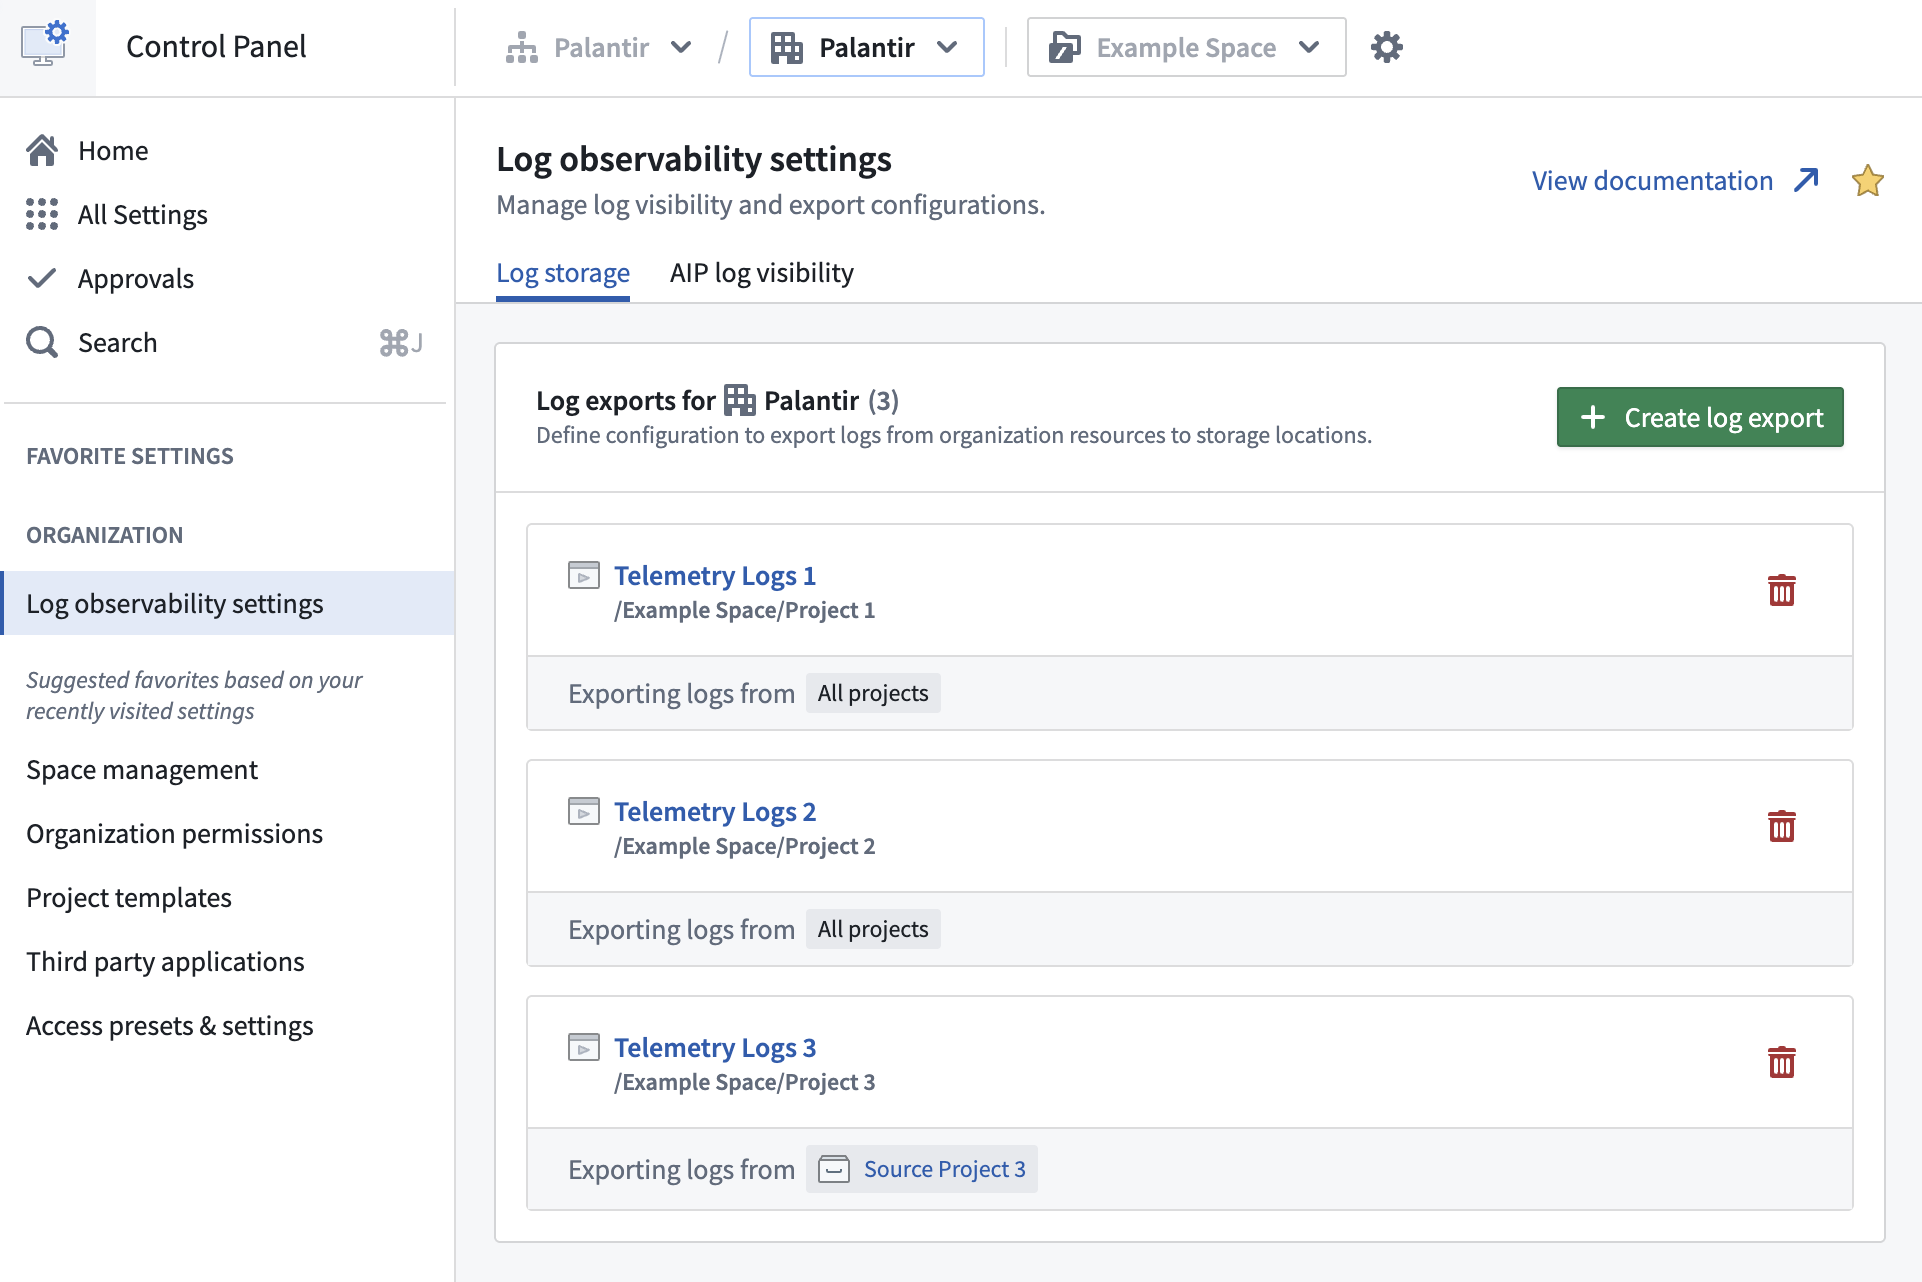
Define an export configuration
Foundry logs can be exported from resources belonging to a set of projects, or from all resources in the organization. Some limitations apply when defining an export configuration:
- Each organization can have a maximum of 50 export configurations.
- Each project can be included in at most three export configurations.
- This limit includes configurations that export logs from all projects.
- When selecting a set of projects for a configuration, you can include up to 100 projects per configuration.
We recommend exporting logs from resources in specific projects rather than all organizational resources. This will simplify access control for the resulting dataset.
Follow the steps below to define an export configuration:
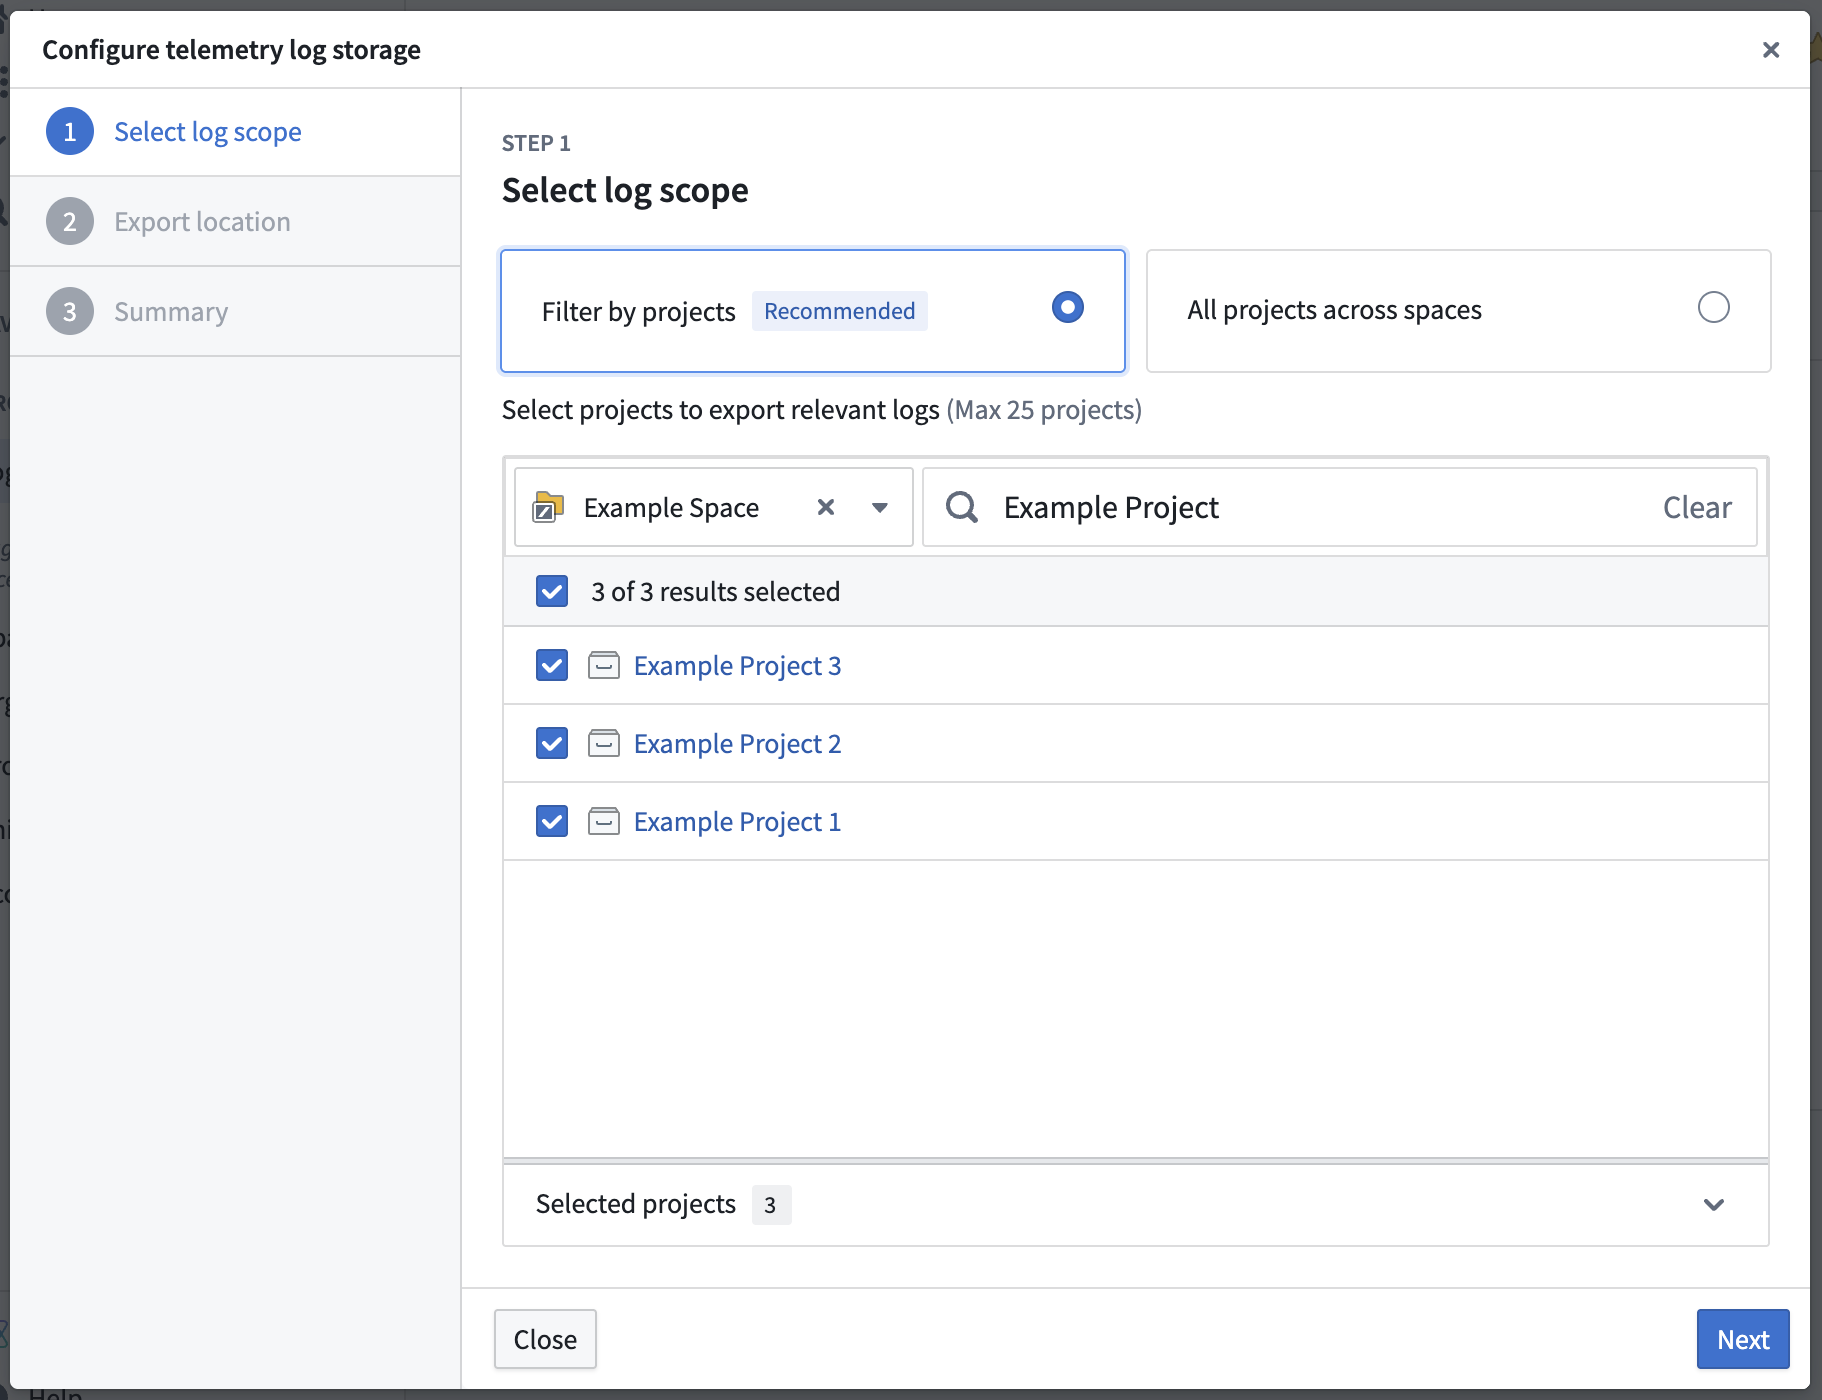
- Select Create log export, which will open a dialog to define a configuration.
- Select the projects to export relevant logs from. You can filter the project list by space using the dropdown, or search for projects by name. Projects that are already included in other export configurations display a count indicating the number of existing exports.
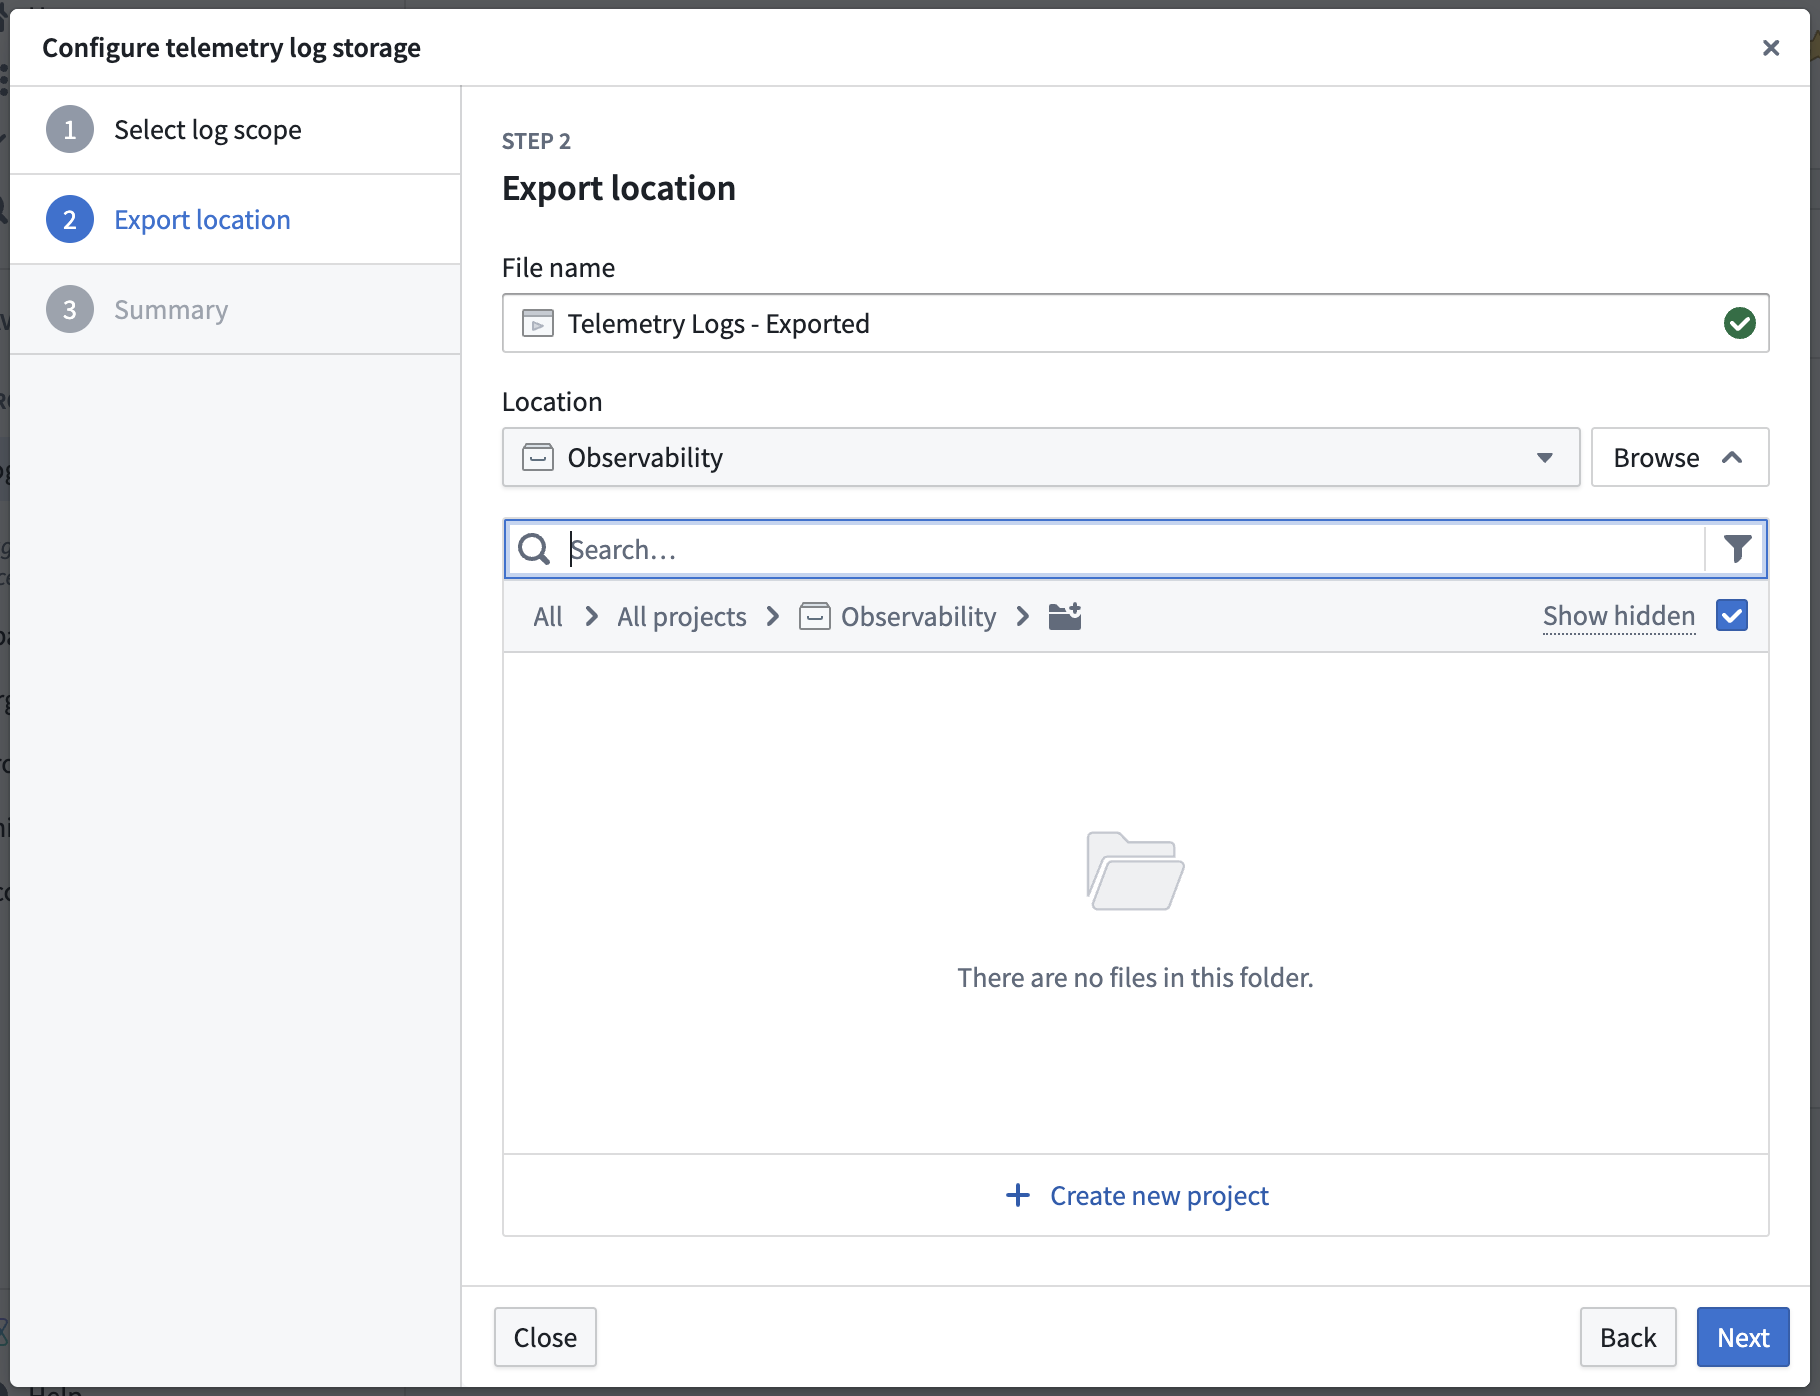
- Specify the name and location of the streaming dataset where logs will be exported. The location must be within the Foundry file system and cannot be a user-created folder.
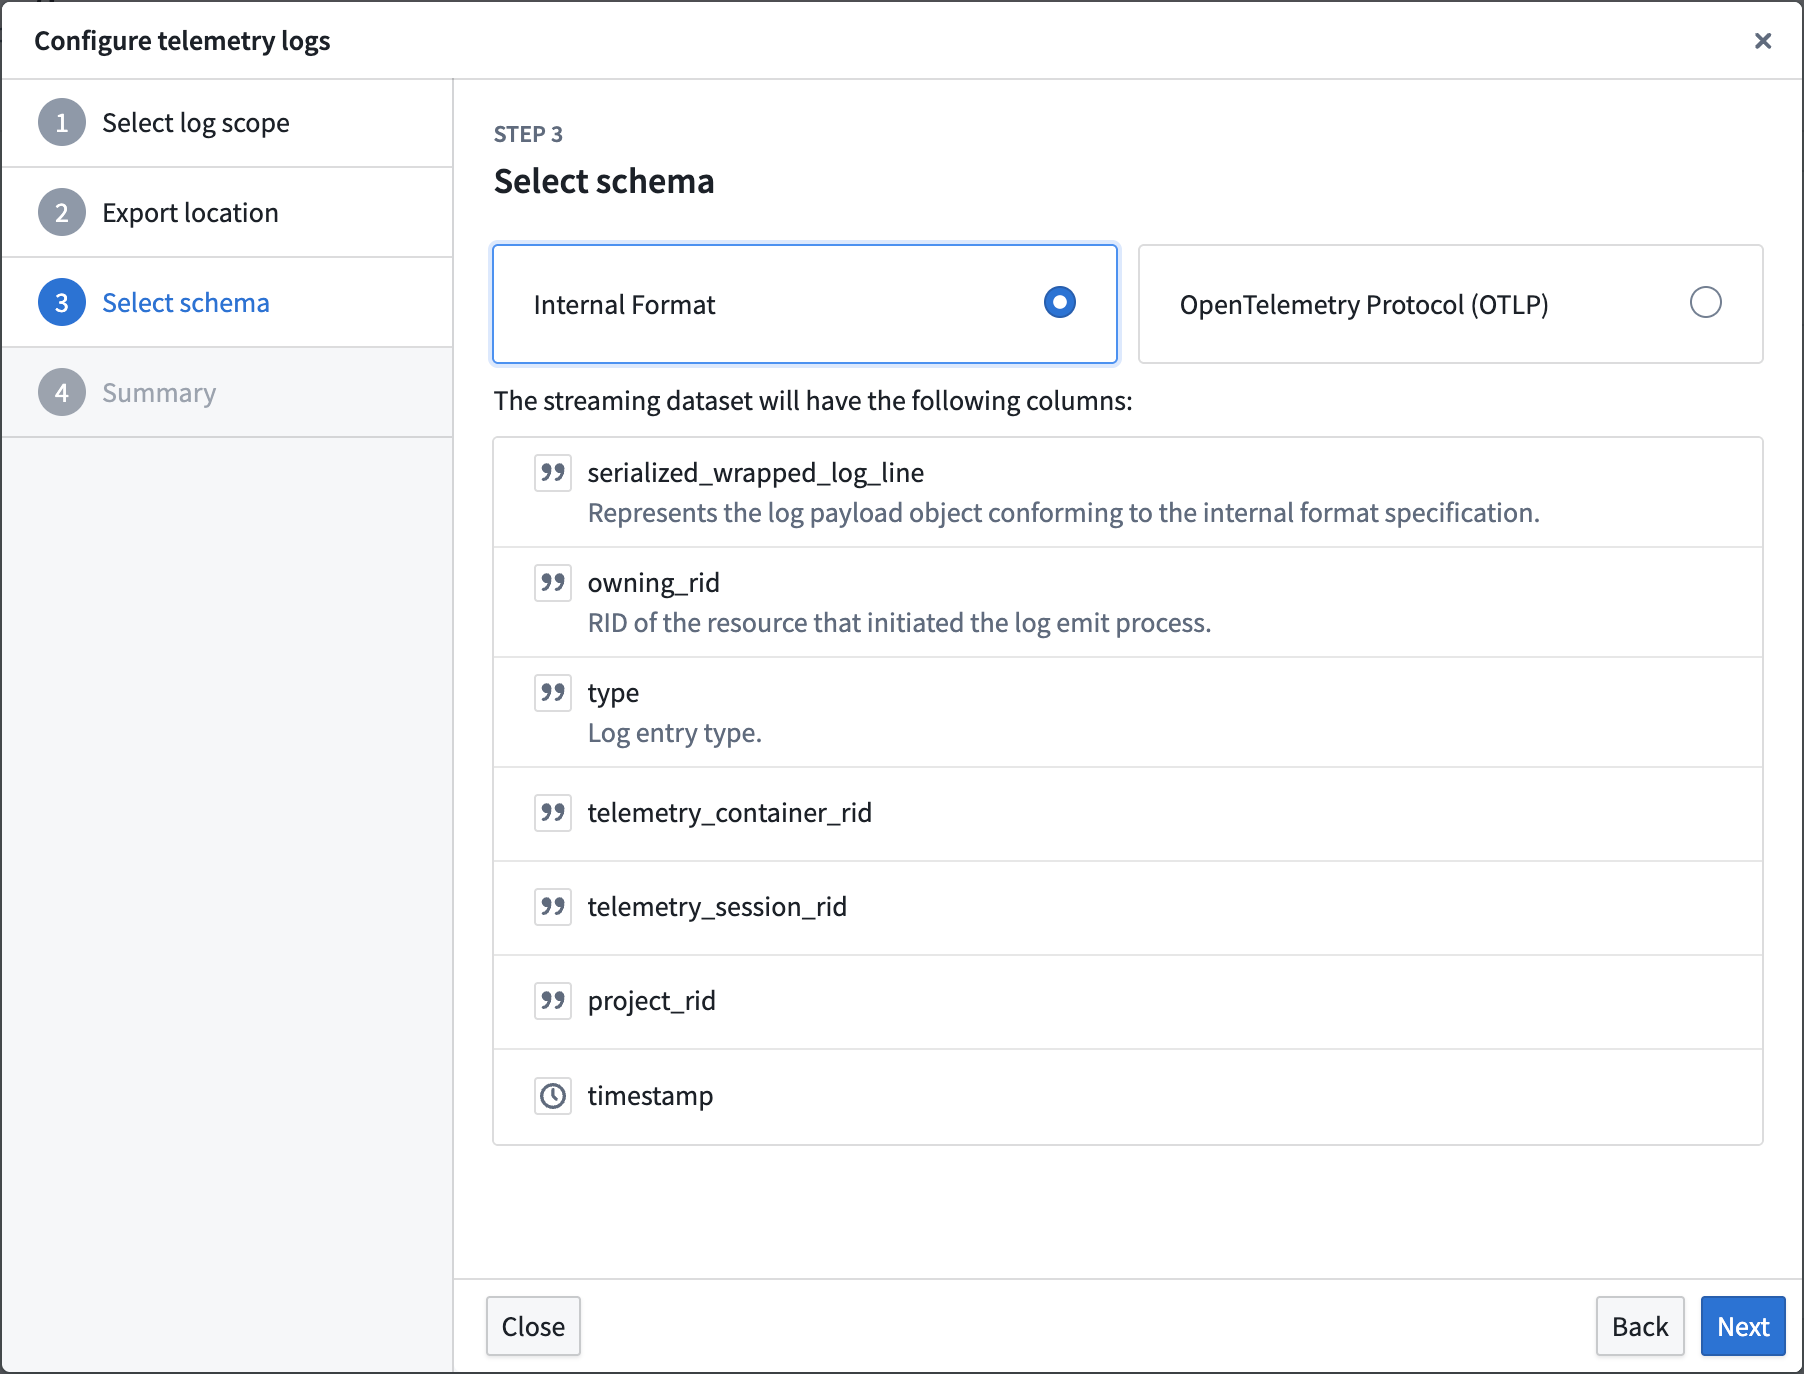
- Select a log schema format. Foundry provides two schema types: an internal Palantir format that provides the payload as a serialized JSON string, or the OpenTelemetry (OTel) protocol format with the payload serialized as a protocol buffer binary. In the same step, use the Unredact user IDs toggle to control whether user IDs are redacted in exported logs. User IDs are redacted by default.
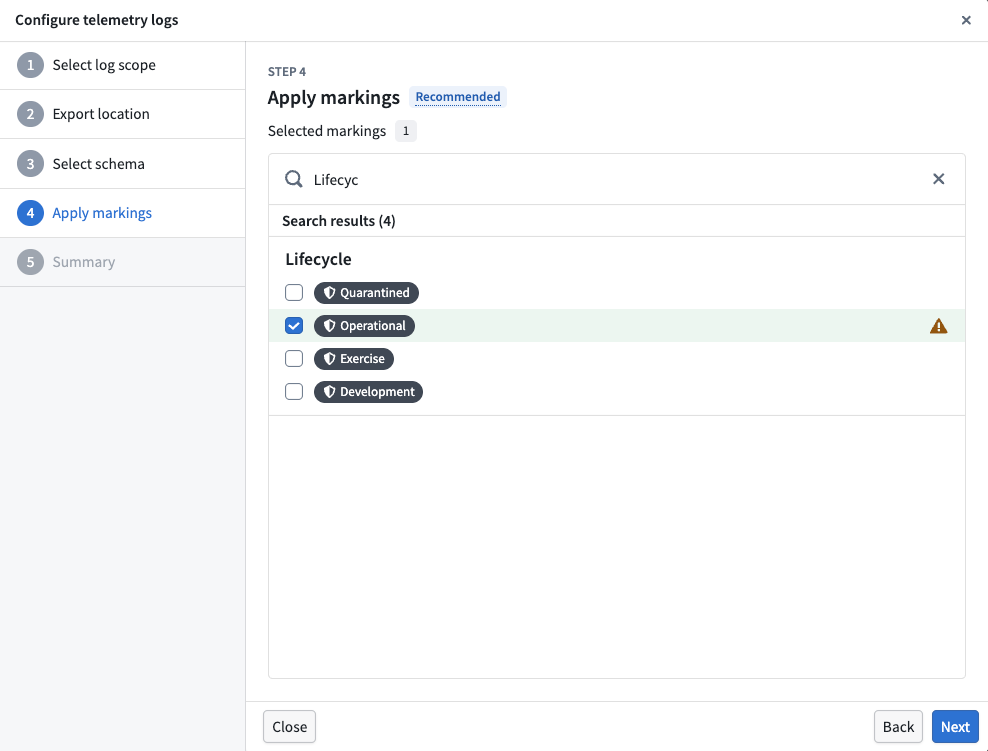
- In the Apply markings step, select the security markings to apply to the output streaming dataset. This step is optional but recommended to control access to log data, as that data may contain sensitive information. Selected markings will be applied to the resulting log dataset after the export configuration is created.
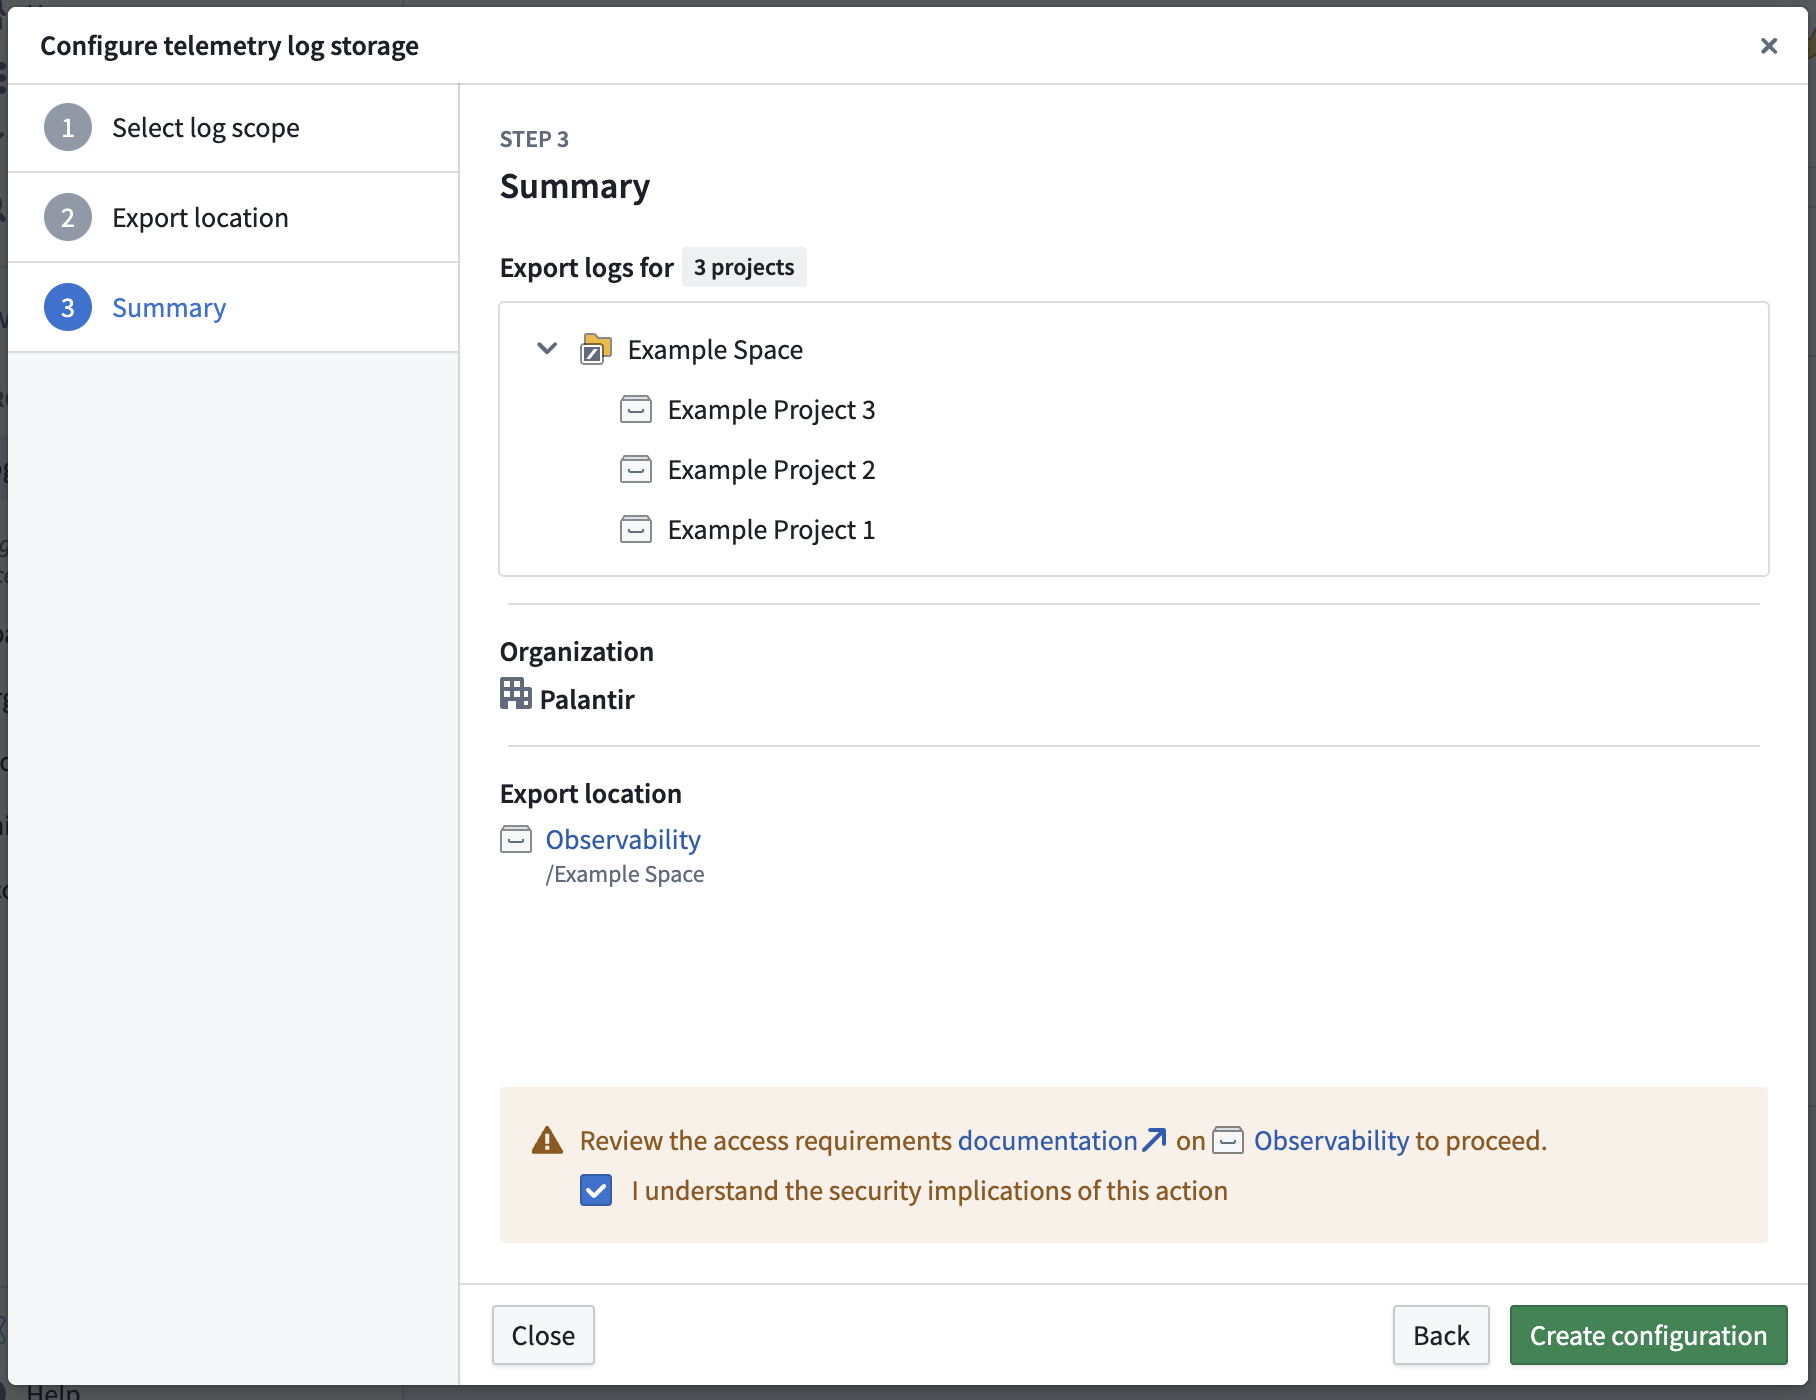
- Select Create configuration after reviewing the summary and access requirements. The summary displays the selected markings along with the other configuration details, so you can confirm your choice before creating the export.
- After the configuration is created, it will appear in the list of existing configurations. Any applied markings are displayed alongside the export configuration details.
Note that when first configuring a log export, it may take up to five minutes for logs to begin streaming into the dataset at the export location.
Disable log exporting
To disable log exporting, delete any listed log storage configurations by selecting the trash icon on the right side of the configuration. The resulting dataset will continue to exist, but no new logs will be exported to it. Additionally, if the streaming dataset is in the trash or permanently deleted, logs will stop being exported.
Analyze log data
Log storage datasets can contain high volumes of streaming data, so we recommend filtering the dataset appropriately before performing analysis. Consider time-based filtering to focus on relevant log entries for your monitoring and troubleshooting needs.
Foundry provides many powerful tools for performing log analysis, such as Transforms and Pipeline Builder.
Log schema
Foundry application logs are structured logs that follow a consistent schema, making them suitable for programmatic analysis and monitoring.
Specifically, Foundry logs contain information about various application events, including transform executions, build processes, system errors, and other operational activities. The log structure varies depending on the type of application or service that generates the log entry.
Application-specific information is captured within structured fields that provide context about the operation being performed, including execution details, error information, and performance metrics.
Foundry provides two schema types:
- An internal Palantir format that provides the payload as a serialized JSON string
- The OpenTelemetry (OTel) protocol provides logs in OTel protocol ↗ format, with the payload serialized as a protocol buffer binary for ingestion downstream to an OTel collector.
Log attribution
Foundry application logs are generated by various services and applications within the platform. When logs are streamed to the configured dataset, they are filtered to include only logs relevant to the organization that configured the log storage configuration.
Log exports configured for a given organization will receive logs from applications and services used by that organization. This includes transform executions, builds, and other activities performed within the organization's context.
The RID of the resource that generated the log is included in the log entry and can be used to trace the log back to the resource.
Log guarantees
Foundry logs are not audit logs. There is no guarantee of 100% reliable log delivery.
Log contents produced by Foundry are subject to change without notice.
In platform log access for Ontology and AIP workflows
Ontology and AIP in platform log access is managed at the project level. The log access controls for in platform viewing are distinct from the permissions configured for the export streaming dataset. These controls pertain specifically to functions, actions, automation workflows, and language models called from enabled projects.
Service and trace logs can contain sensitive content from any data source a workflow reaches, including language model prompts and completions, object property values, and user-supplied inputs. The platform does not propagate markings from the source executor's resource or from any data the execution accessed; only the markings you select when enabling log access are enforced on viewers. Select markings that reflect the maximum sensitivity of any data the workflow may touch, and review the resulting access scope before enabling.
You can configure in-platform log access from Control Panel or directly from a resource node in Workflow Lineage.
A user must have the following to view logs (with 30-day retention) they did not invoke:
- Log reading enabled for the project the source executor resides in, or through a resource-level override.
- Markings access to any markings configured in the project log access settings or on a resource-level override.
- Edit permission on the source executor the logs were emitted under.
Specifically, the Edit permission requirement corresponds to the foundry-telemetry-service:view-execution-history operation, which the Editor role grants by default. You can grant this operation through a different role using custom roles.
Independent of the log access status managed by the administrator, users are able to see logs of executions they ran within the past 24 hours. This exception does not apply on CBAC stacks.
For the authoritative list of viewing requirements and the roles they map to, see Log permissions.
Configure log access from Control Panel
To manage the in platform log access controls by project:
- Navigate to the Log access tab. This tab displays the projects with log reading enabled for your organization, if any. By default, log access is disabled for all projects within an organization.
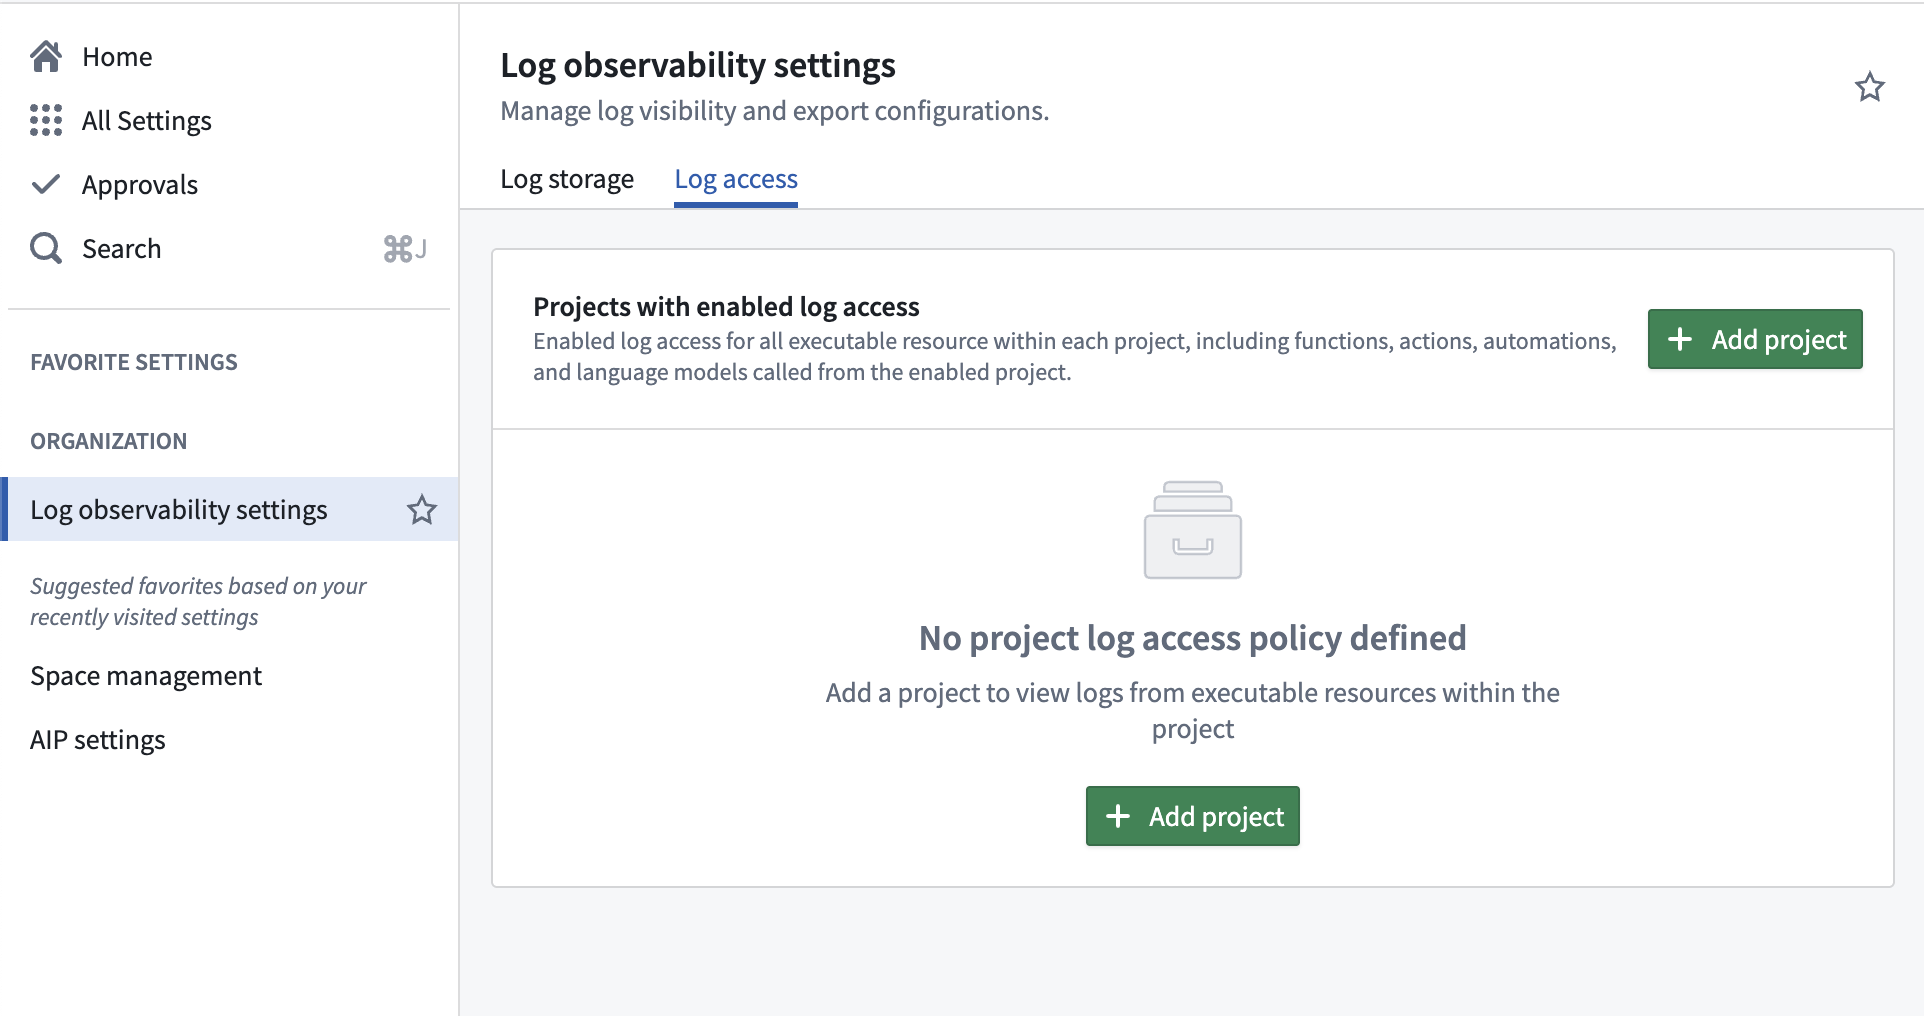
- To enable log access for a project, select Add project, which will open a dialog to configure telemetry log visibility for a project.
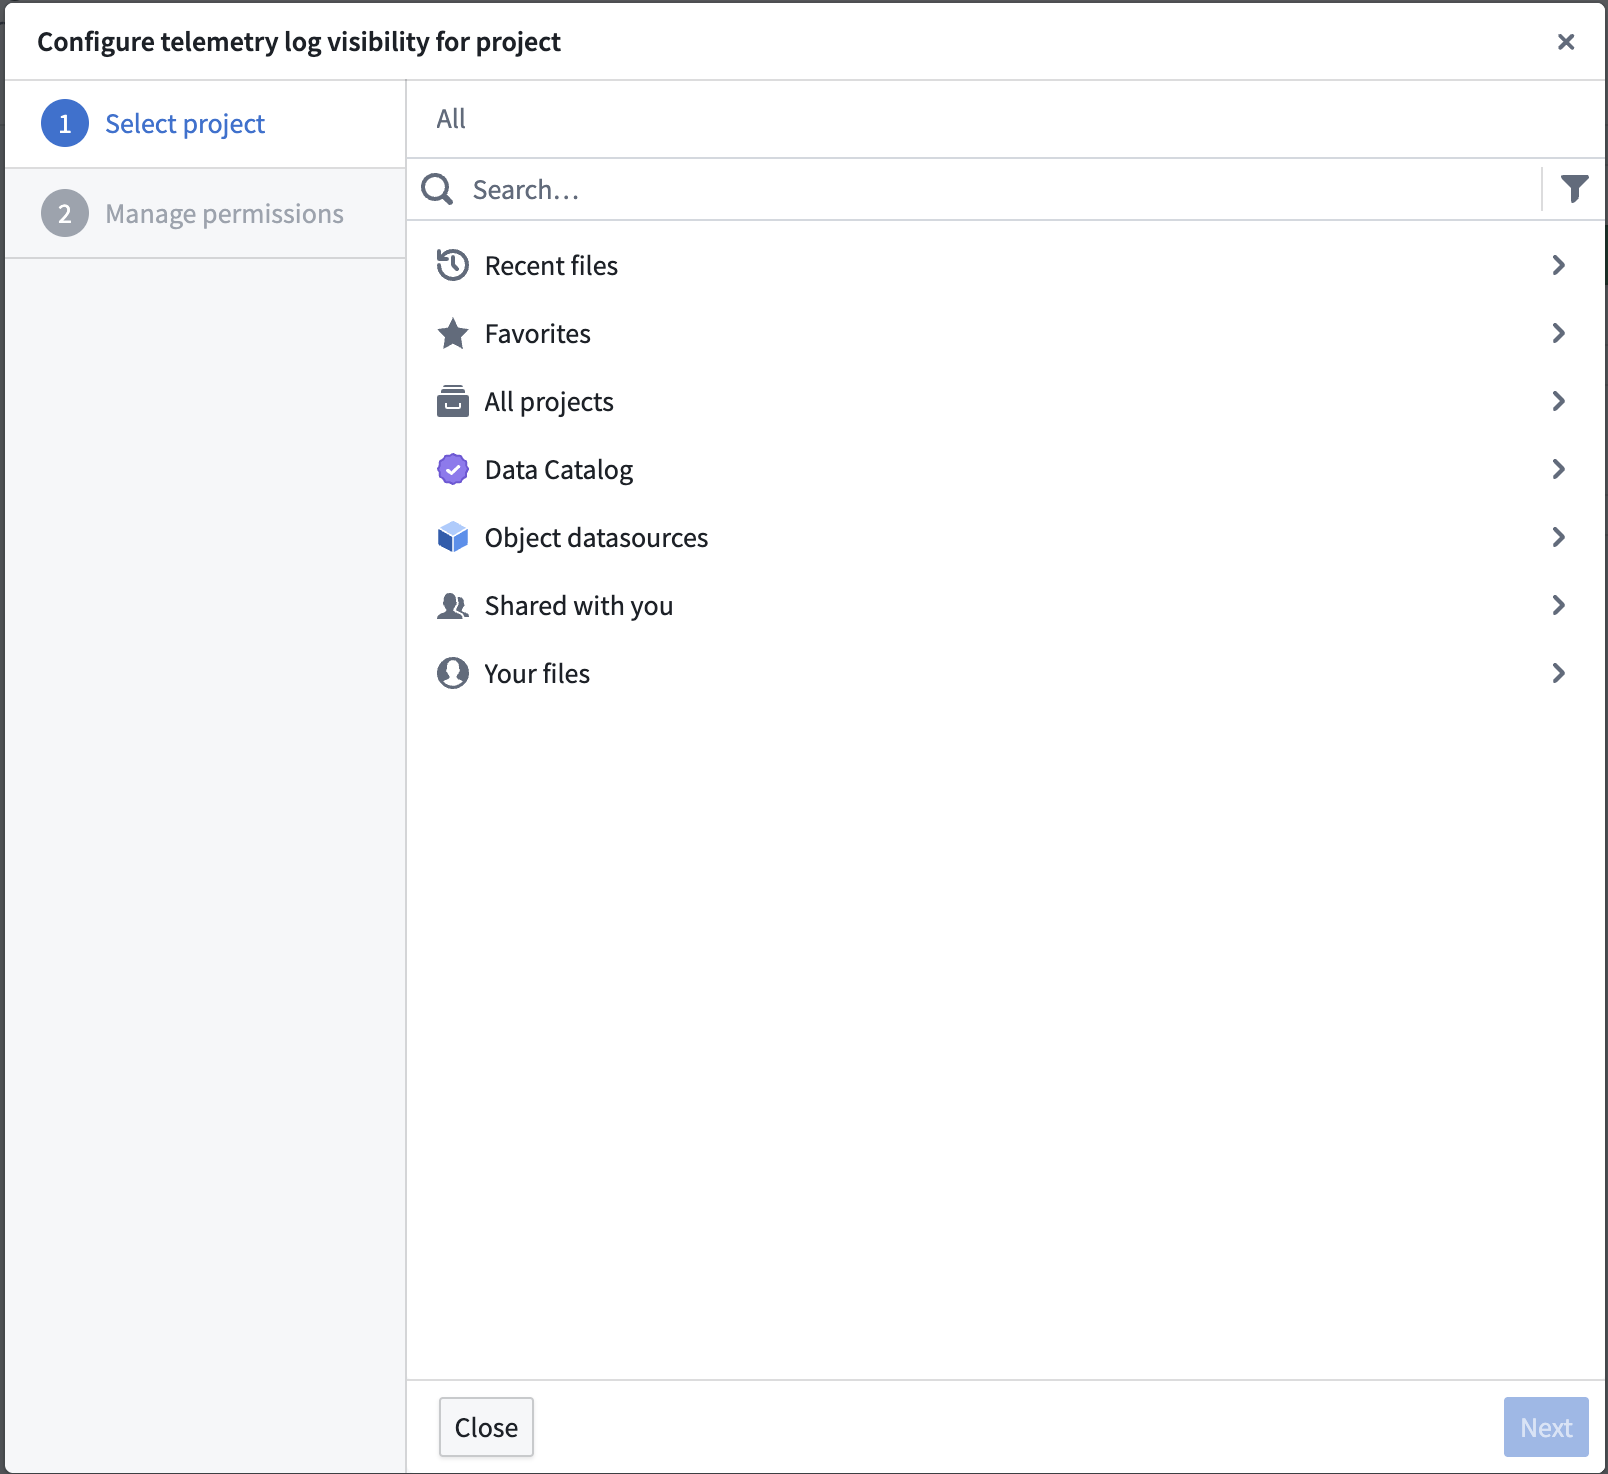
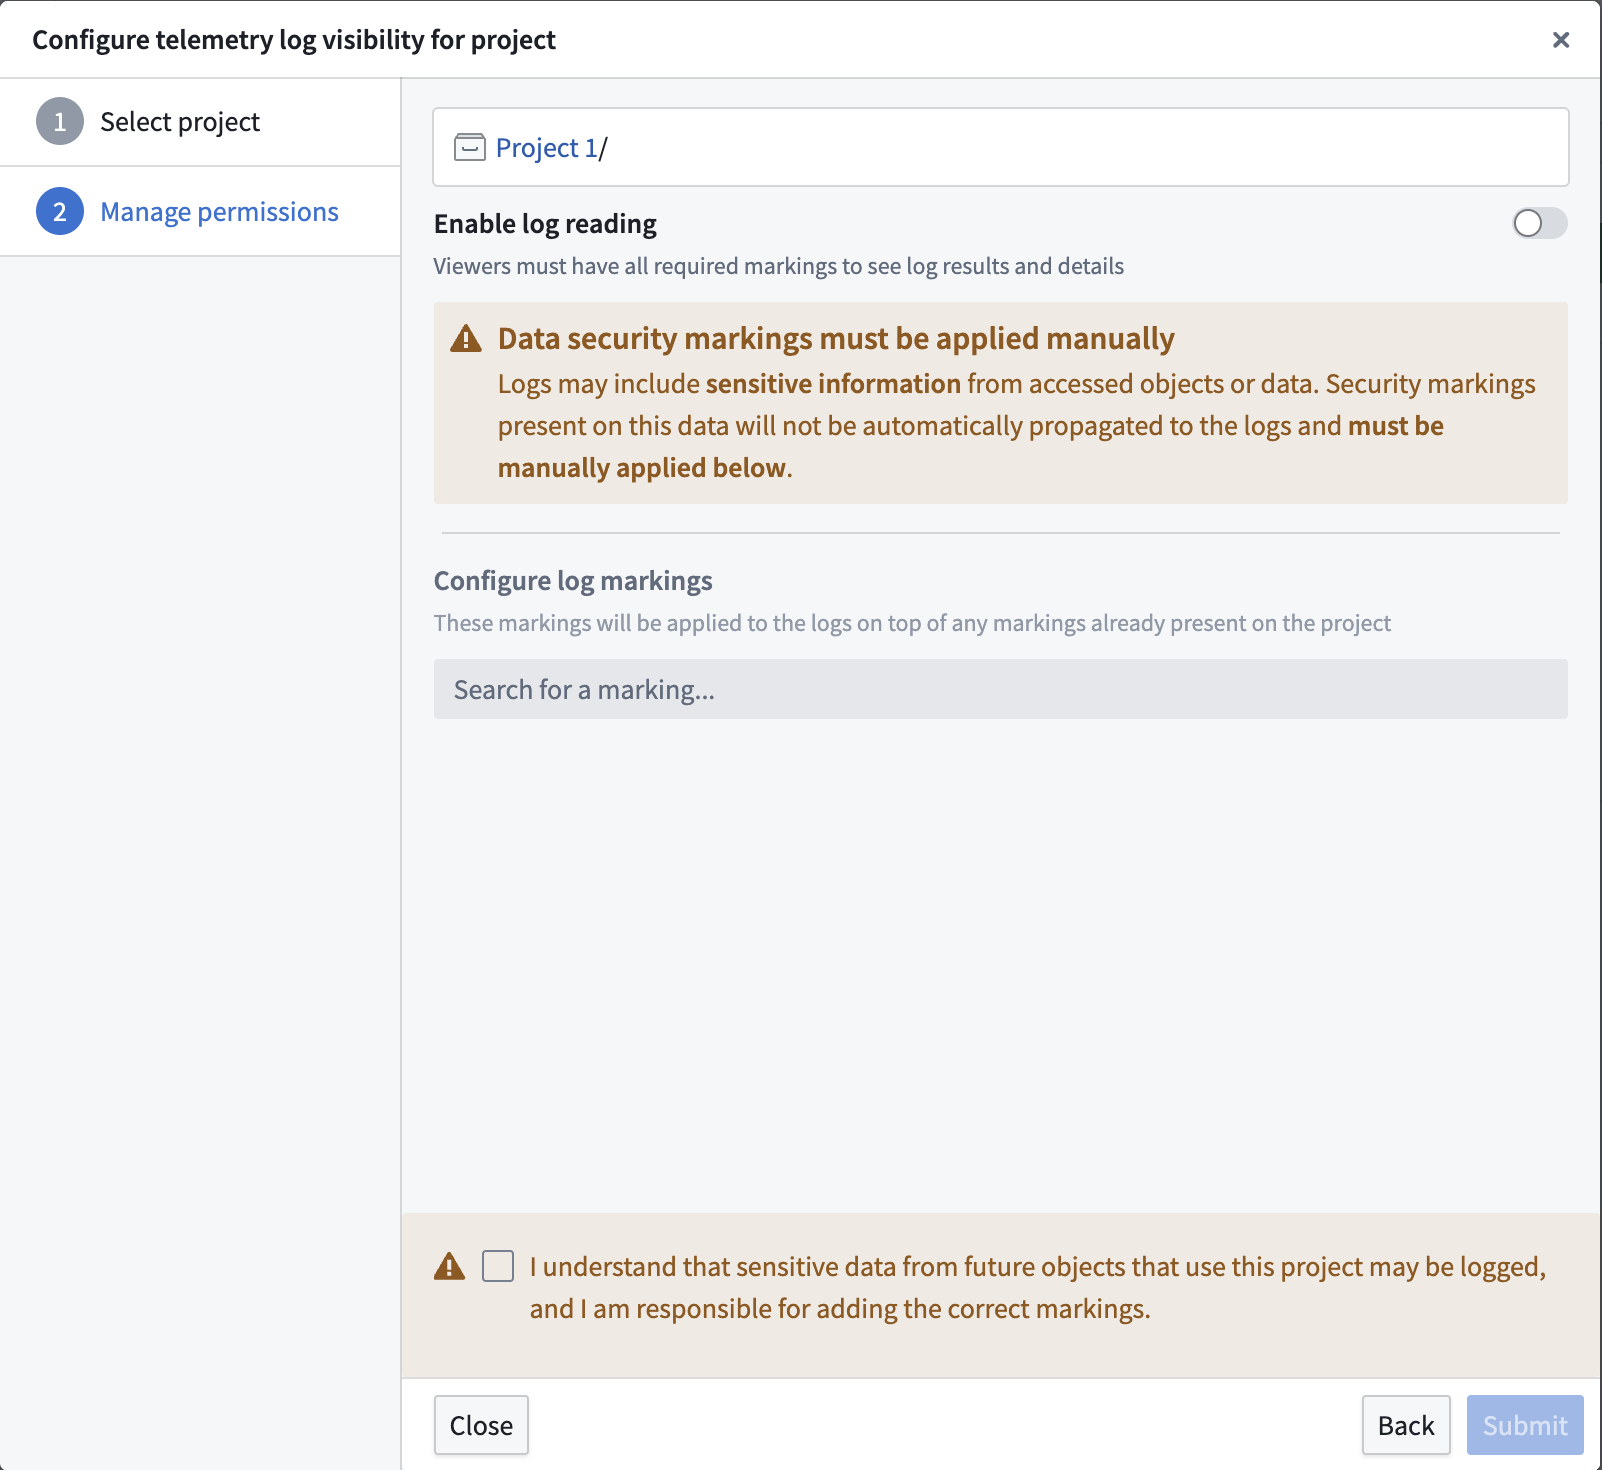
- Once a project is selected, a second dialog will appear to enable log reading for the project and apply necessary markings.
- After log access is enabled for the project, it will appear in the list of enabled projects.
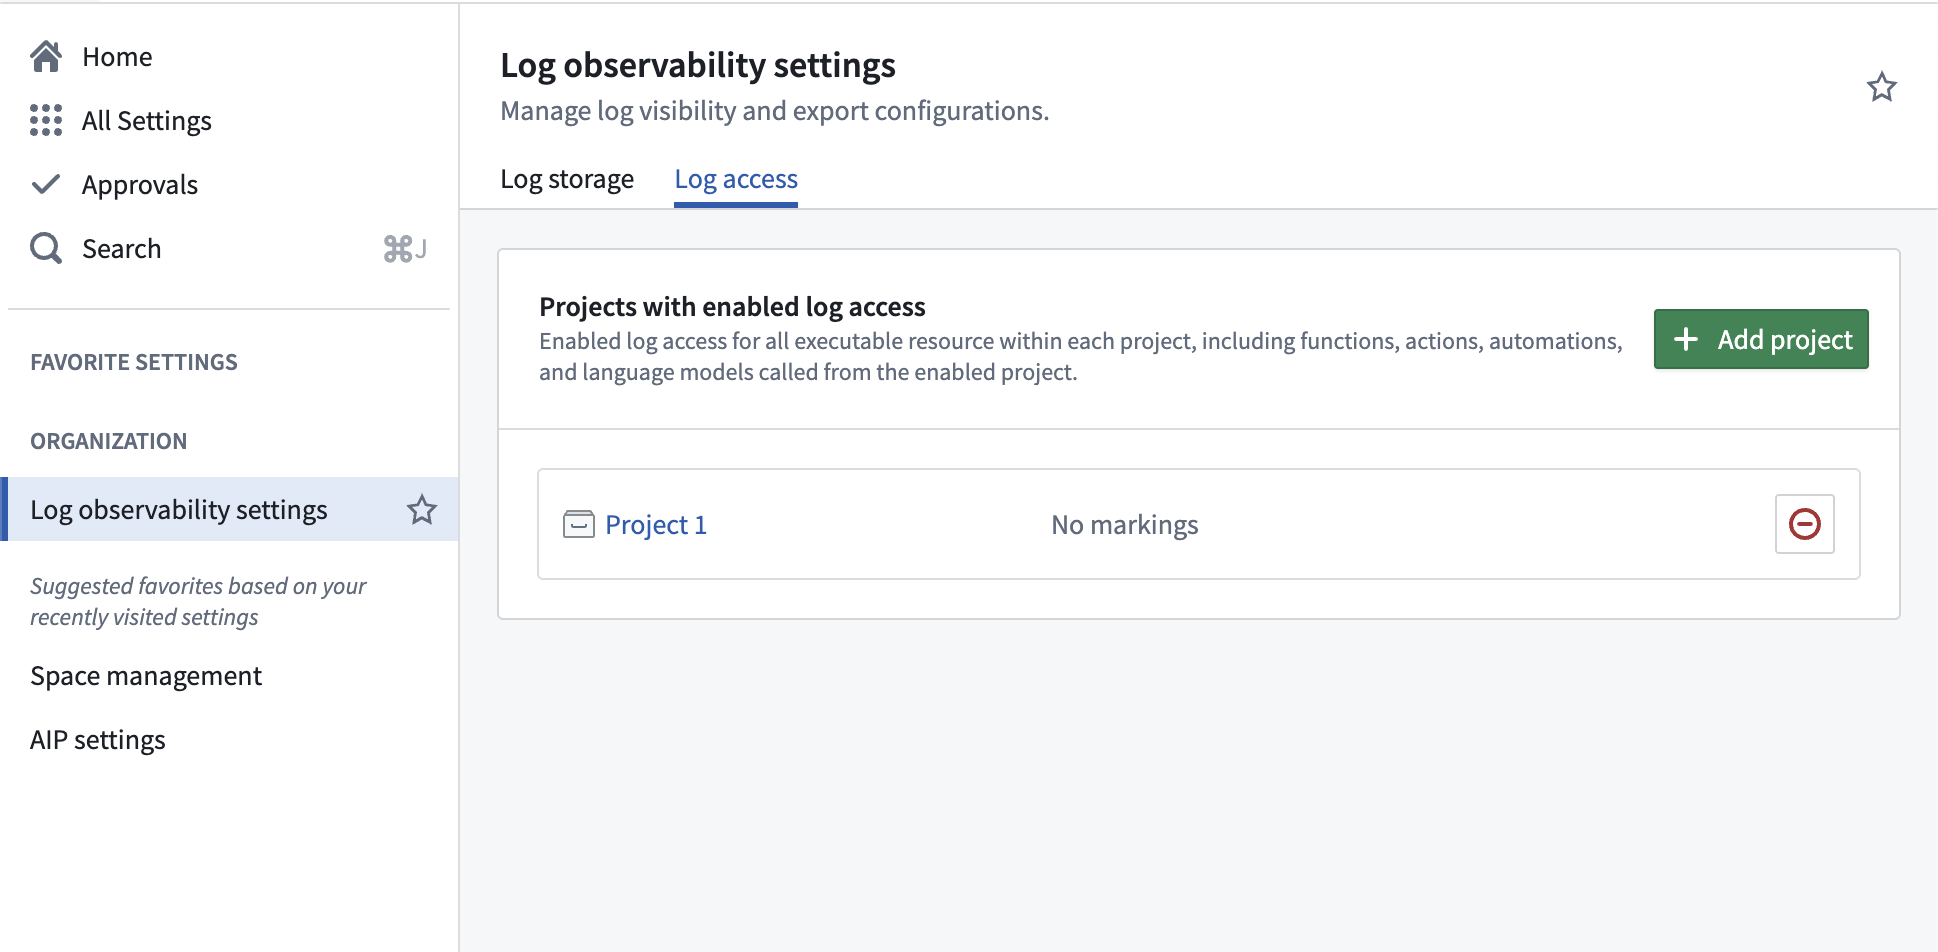
- You should then see the updated policy reflected throughout the platform, with log viewing enabled for all source executor resources residing in the project.
Configure log access from Workflow Lineage
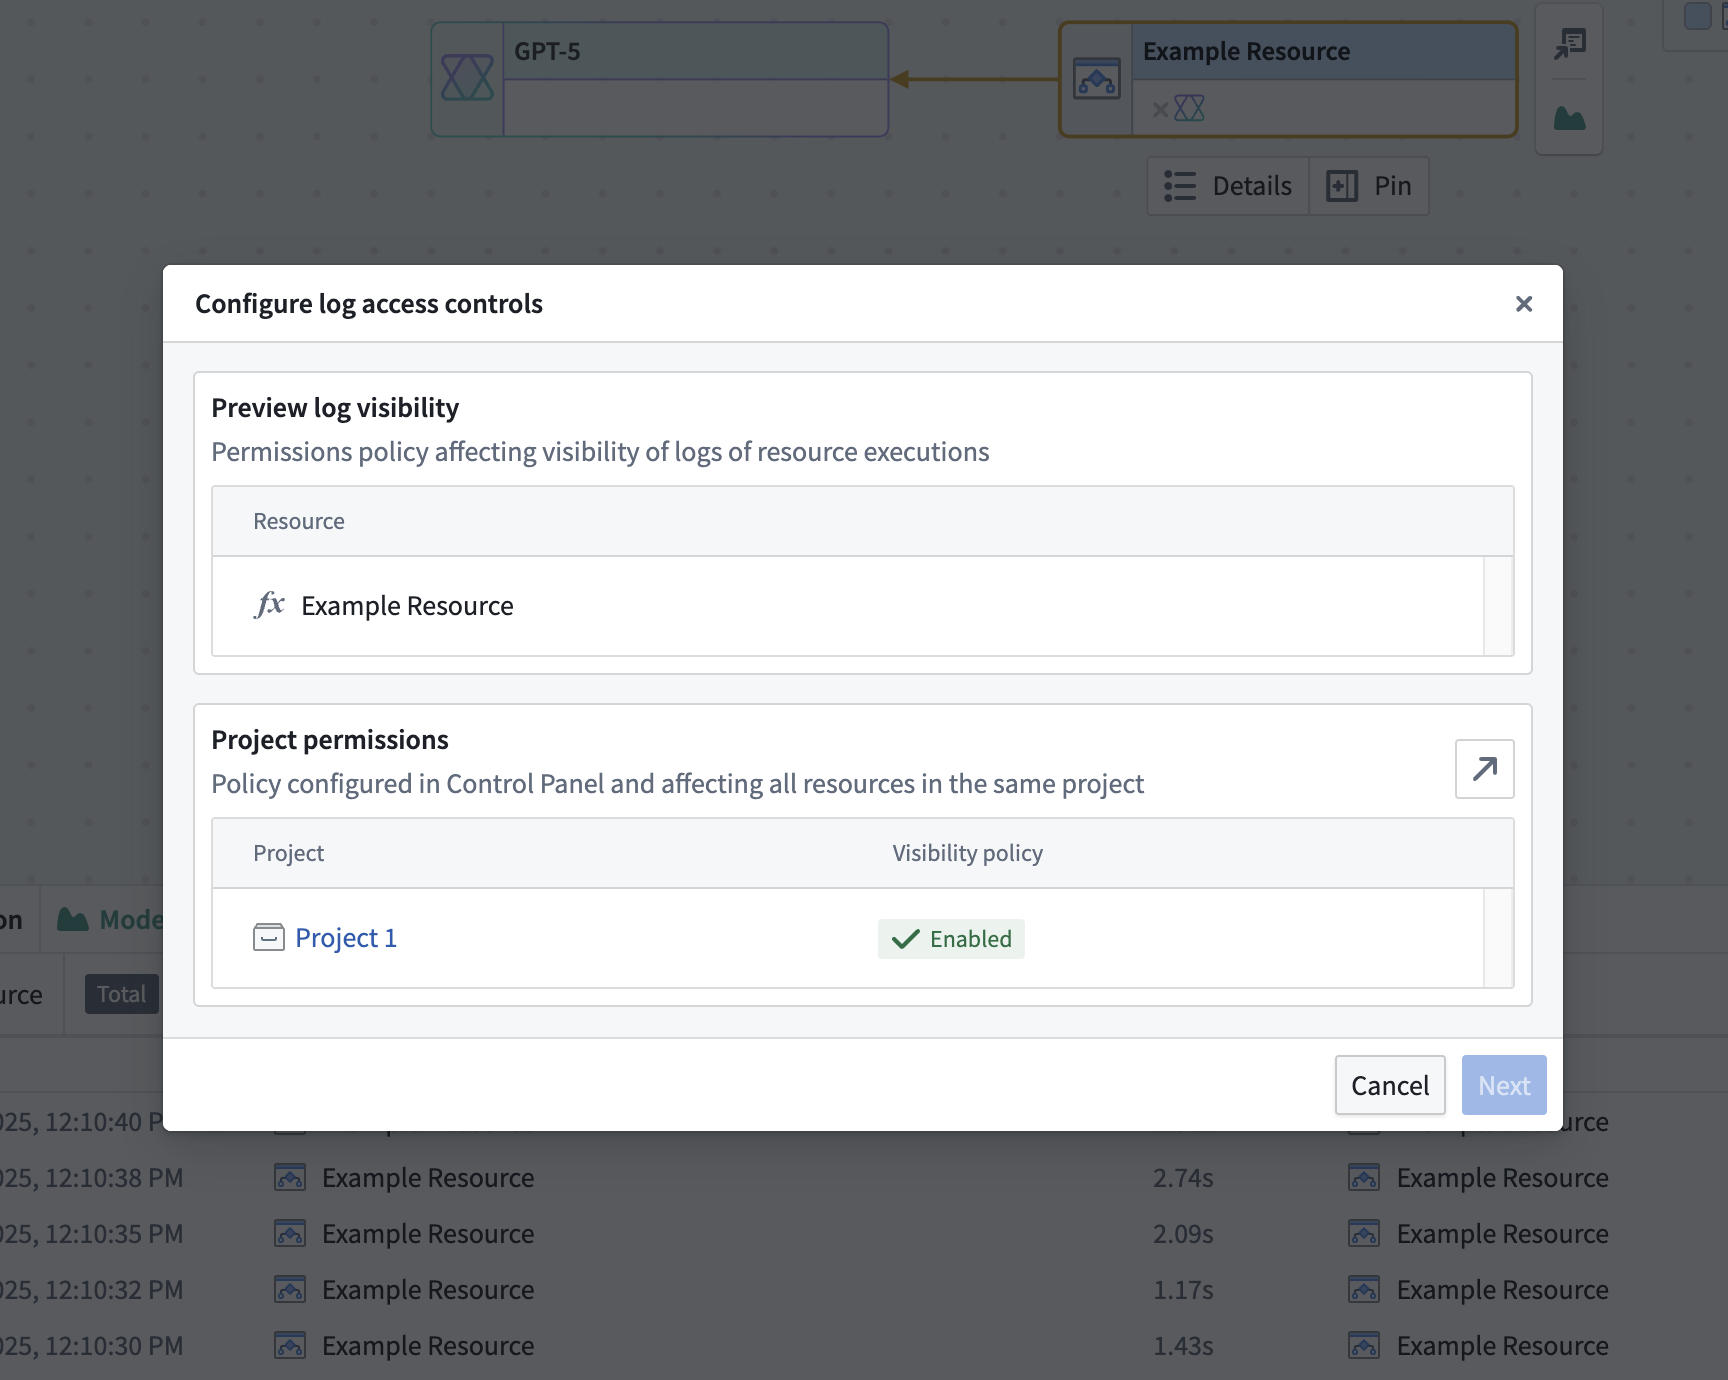
In addition to the Control Panel flow, an administrator can review and adjust a resource's log access from the Log access overview dialog in Workflow Lineage. Open the dialog as described in Log permissions, then select Edit on the Log access policy requirement to open the configuration step.
We recommend project-level log access. Select Configure in Control Panel to enable it using the Control Panel flow.
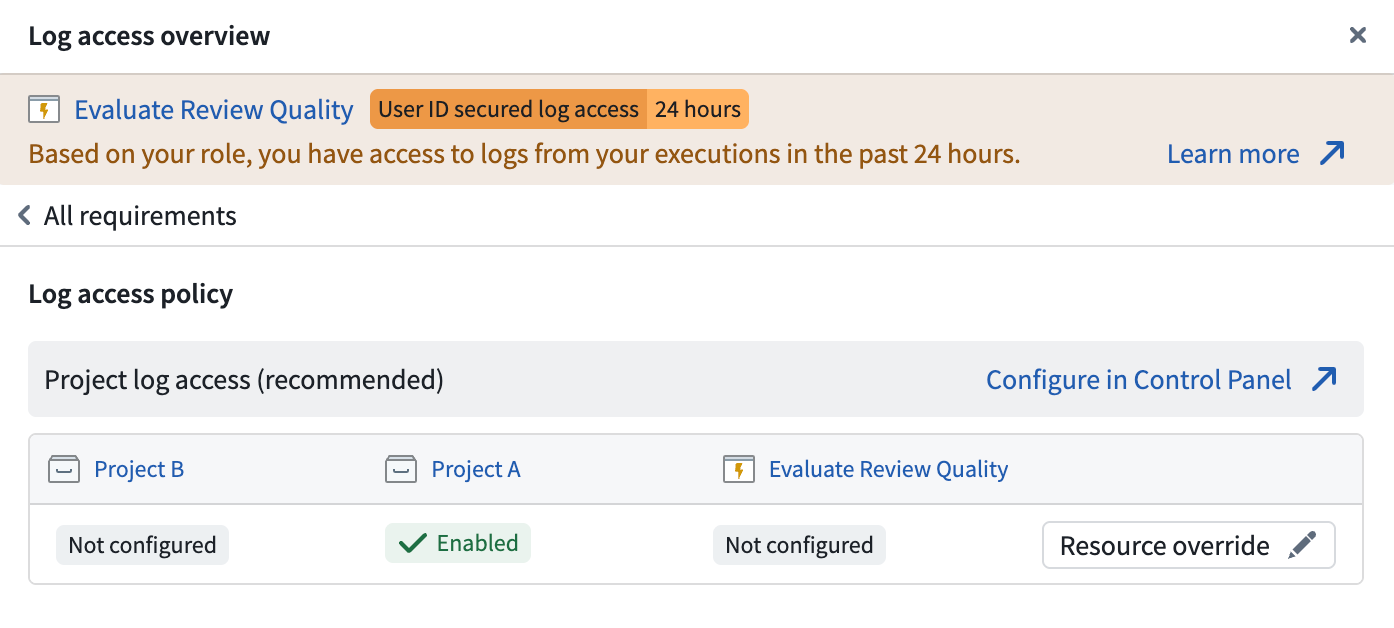
The configuration step shows a table summarizing where log access is resolved for the resource:
| Column | Meaning |
|---|---|
| Current project | The project that currently contains the resource. Shows Enabled or Not configured. |
| Attributed project | The project the resource is attributed to for log access — the project the resource first emitted telemetry under. Shown only when it differs from the current project. Shows Enabled or Not configured. |
| Resource override | A resource-level override, shown when one is active or when a project has log access disabled. Shows Enabled, Disabled, or Not configured. |
Update project attribution
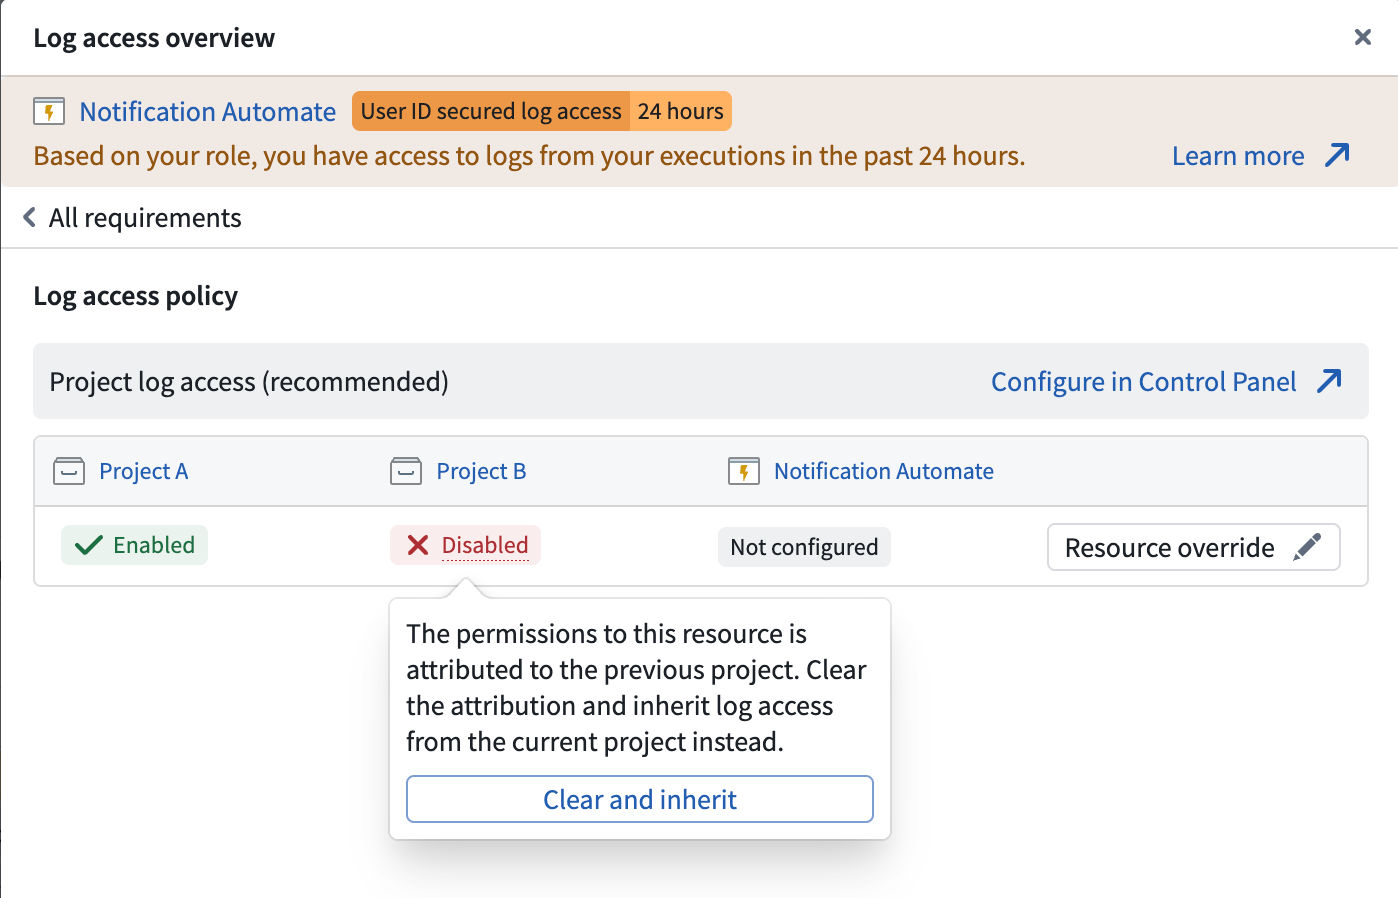
A source executor is attributed to a project for log access purposes. By default, the attributed project is the project where the source executor was located when it first wrote a log. If a resource is moved after writing its first log, the current project and the attributed project differ, and log access is enforced against both.
When the two projects differ, an administrator can re-point attribution to the current project: hover over the previous project's status tag and select Clear and inherit.
Configure resource overrides for legacy Ontology permissions
You can manage an action at the project level only after migrating it to Ontology project-based permissions. Actions still managed by legacy Ontology permissions must first be migrated to project-based permissions. Once an action is migrated, an administrator updates its project attribution by clearing the legacy Ontology resource identifier.
For an action on legacy Ontology permissions, the configuration step offers two paths: migrate the action to a project (recommended), or configure a resource override. The action's Ontology resource identifier appears in place of the project; administrators cannot enable it and have no access to it through Foundry's project and file system.
Until the action is migrated, you can enable log access by activating a resource override and applying the Required markings that viewers must hold to read the resource's logs. The markings are applied to the logs on top of any markings already present on the resource and project log settings.
Logs may include sensitive information from accessed objects or data. Security markings present on this data are not automatically propagated to the logs and must be manually applied.
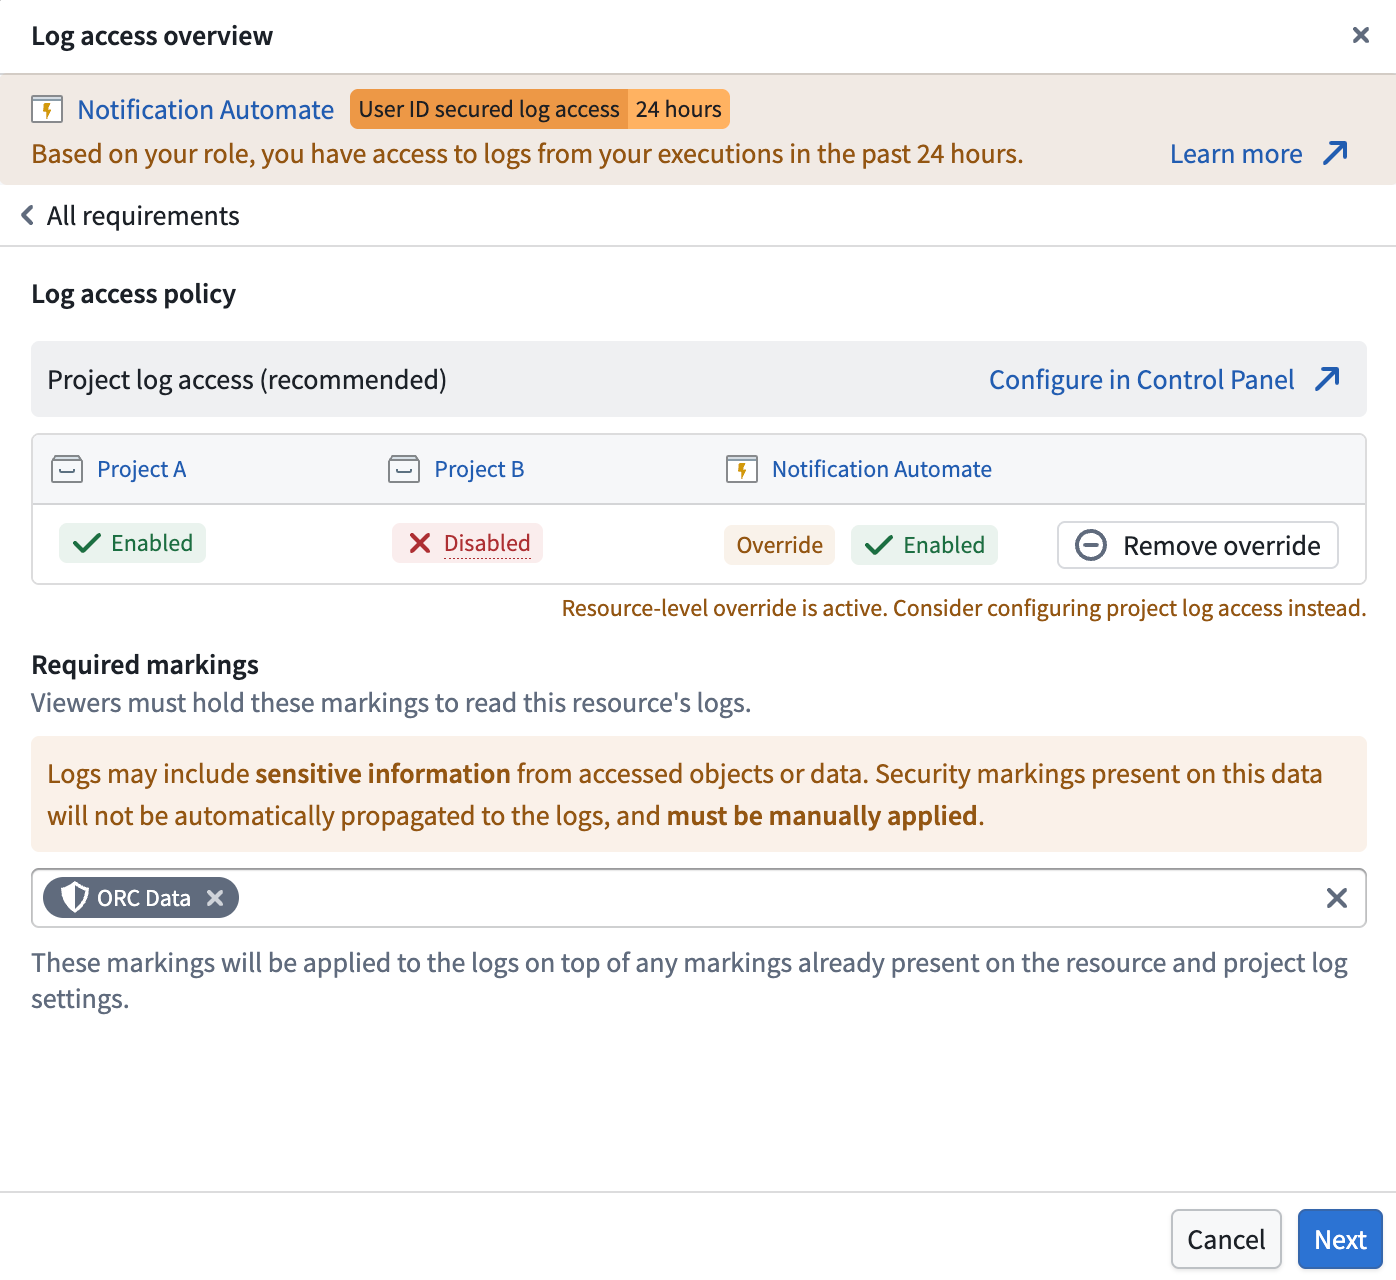
Disabled resource overrides are deprecated. If the table shows a disabled override, remove it and rely on the project-level policy; the dialog blocks Next until you do.
After configuring the policy, select Next to continue to the acknowledgment step.
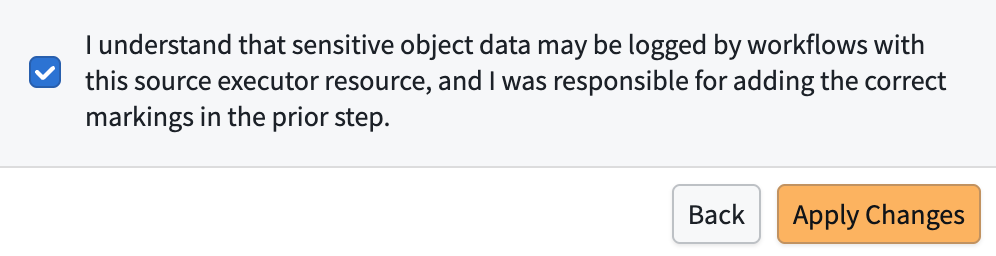
Acknowledge changes
Before changes take effect, you must select an acknowledgment checkbox confirming the security trade-off. When enabling an override, you confirm that sensitive object data may be logged and that you applied the correct markings. When clearing an override, you confirm that the resource reverts to project-level log visibility. After selecting the checkbox, choose Apply Changes to save.
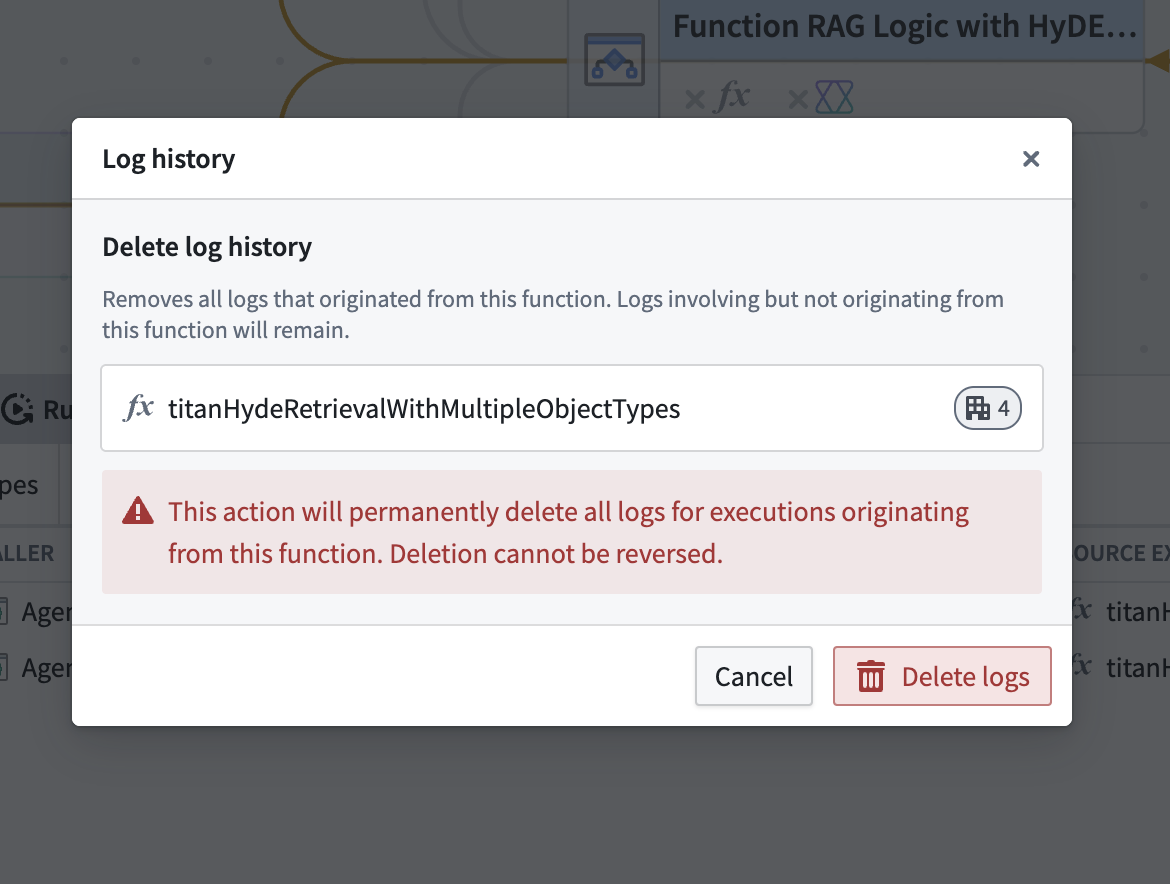
Delete log history
Users with the Information security officer or Enrollment administrator role can delete logs at any time. From the Run history or Log search panel in Workflow Lineage, select Edit permissions > Delete log history > Delete logs.

Log history deletion is irreversible and will permanently delete all logs for executions originating from this resource.