- Capabilities
- Getting started
- Architecture center
- Platform updates
Reducing cost from health network providers through alerting and understanding provider performance
Industry Sector: Health Care
Business Function: Operations
Analyzing provider performance for contract negotiation is a very manual process that typically provides limited indication on what factors are driving holistic provider performance. A Foundry application enabled alerts and a drill-down workflow where analysts could investigate providers from the highest to most granular level across multiple dimensions and timescales, surfacing hundreds of millions of dollars in potential opportunities.
Challenge
Contracting and Network Development analysts investigate provider inefficiency for the purpose of re-negotiating future provider contracts, and contact providers to address immediate concerns. Prior to Foundry, analysts reviewed provider performance through a completely manual and limiting process. They submitted requests to their data analytics team to retrieve the relevant claims for a given provider, dug into these claims in Excel, and generated metrics manually to identify opportunities.
In addition to not being scalable, this workflow provided one entry point, no aggregated metrics, limited understanding of how providers are performing in their peer group, and no way to automatically surface alerts.
Solution
A Foundry operational dashboard provided multiple entry points that can be used to analyze provider utilization data and make decisions around provider network and contracting. It enabled users to analyze their network of providers by various metrics across different dimensions (cost, quality, utilization, etc.) and also allowed them to perform this drill-down exercise from the highest level (state/plan/service type) down to the individual claim lines.
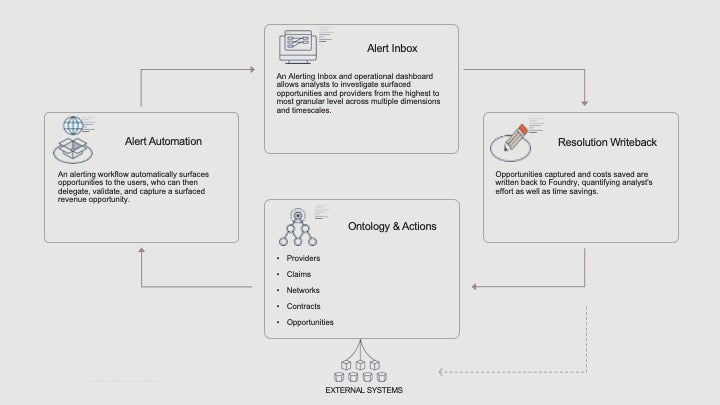
An alerting workflow encoded several drill-down patterns and automatically surfaced opportunities to the users, who can perform their entire analysis within one object view, then delegate, validate, and capture a surfaced revenue opportunity.
Stakeholders and user groups
- Primarily analysts responsible for contracting and network development
- Additional user groups may including anyone looking to analyze provider performance
Impact
- Surfaced multi-million dollars in projected opportunities.
- Significant time savings for operational users.
- Aggregate revenue metrics quantifying analysts’ effort.
How it’s made
Ontology Structure
The ontology was composed of the objects in bullets below, with 70+ aggregated provider utilization metrics computed on the claims and claim lines.
- Claim line
- Claim
- Attending Provider
- Attending Professional
- Attending Provider Yearly Metric
- Opportunities (alerts generated by rules on any of the objects above)
Applications
- Drill-down object views
- Alerting Inbox surfacing opportunities for review, validation, and capture
- Dashboard to track opportunities captured and associated cost savings
Implement a similar use case
This use case implements the following Pattern. Follow the link below to read more about a particular Pattern and learn how it is implemented within Foundry.
- Alerting workflow (used for 7 other use cases)
Want more information on this use case? Looking to implement something similar? Get started with Palantir. ↗