Warning
注: 以下の翻訳の正確性は検証されていません。AIPを利用して英語版の原文から機械的に翻訳されたものです。
Copied!1 2 3 4 5 6 7 8 9 10 11 12 13 14 15 16 17 18 19 20 21 22 23 24 25 26 27 28 29 30 31 32 33 34 35 36 37 38 39 40 41 42 43 44 45 46 47 48 49import palantir_models as pm from palantir_models_serializers import * class SklearnClassificationAdapter(pm.ModelAdapter): # Sklearnの分類モデルをラップするアダプタークラス @pm.auto_serialize( model=DillSerializer() ) def __init__(self, model): # コンストラクタ、モデルを引数として受け取り、自身のmodel属性にセット self.model = model @classmethod def api(cls): # APIの定義を行うクラスメソッド # 入出力のカラム情報を設定する columns = [ 'mean_radius', 'mean_texture', 'mean_perimeter', 'mean_area', 'mean_smoothness', 'mean_compactness', 'mean_concavity', 'mean_concave_points', 'mean_symmetry', 'mean_fractal_dimension', 'radius_error', 'texture_error', 'perimeter_error', 'area_error', 'smoothness_error', 'compactness_error', 'concavity_error', 'concave_points_error', 'symmetry_error', 'fractal_dimension_error', 'worst_radius', 'worst_texture', 'worst_perimeter', 'worst_area', 'worst_smoothness', 'worst_compactness', 'worst_concavity', 'worst_concave_points', 'worst_symmetry', 'worst_fractal_dimension' ] inputs = {"df_in": pm.Pandas(columns=columns)} outputs = {"df_out": pm.Pandas(columns= columns + [ ("prediction", int), ("probability_0", float), ("probability_1", float) ])} return inputs, outputs def predict(self, df_in): # 入力データに対する予測を行うメソッド X = df_in.copy() predictions = self.model.predict(X) probabilities = self.model.predict_proba(X) df_in['prediction'] = predictions for idx, label in enumerate(self.model.classes_): df_in[f"probability_{label}"] = probabilities[:, idx] return df_in
Copied!1 2 3 4 5 6 7 8 9 10 11 12 13 14 15 16 17 18 19 20 21 22 23 24 25 26 27 28 29 30 31 32 33 34 35 36 37 38 39 40 41 42 43 44 45 46 47 48 49 50 51# 必要なライブラリをインポートする from transforms.api import transform from palantir_models.transforms import ModelOutput from main.model_adapters.adapter import SklearnClassificationAdapter from sklearn.datasets import load_breast_cancer from sklearn.compose import make_column_transformer from sklearn.impute import SimpleImputer from sklearn.pipeline import Pipeline from sklearn.preprocessing import StandardScaler from sklearn.ensemble import RandomForestClassifier # トランスフォームを定義する @transform( model_output=ModelOutput("/path/to/model_asset"), ) def compute(model_output): # データセットをロードする X_train, y_train = load_breast_cancer(as_frame=True, return_X_y=True) # 列名のスペースをアンダースコアに置換する X_train.columns = X_train.columns.str.replace(' ', '_') columns = X_train.columns # 数値データに対する前処理を定義する numeric_transformer = Pipeline( steps=[ ("imputer", SimpleImputer(strategy="median")), # 欠損値を中央値で補完する ("scaler", StandardScaler()) # データを標準化する ] ) # 前処理を列に適用する preprocessor = make_column_transformer( (numeric_transformer, columns), # 数値データに対する前処理を適用する列を指定する remainder="passthrough" # 指定されていない列はそのまま保持する ) # モデルのパイプラインを定義する model = Pipeline( steps=[ ("preprocessor", preprocessor), # 前処理を適用する ("classifier", RandomForestClassifier(n_estimators=50, max_depth=3)) # ランダムフォレストを適用する ] ) # モデルをトレーニングデータに適合させる model.fit(X_train, y_train) # モデルをFoundryのアダプターに変換する foundry_model = SklearnClassificationAdapter(model) # モデルをパブリッシュする model_output.publish(model_adapter=foundry_model)
3. モデルの利用
Python トランスフォームで推論を実行する
ユーザーのモデルを Python トランスフォームで推論することができます。例えば、モデルの学習が完了したら、以下の推論ロジックを model_training/run_inference.py ファイルにコピーして、ビルド を選択します。
Copied!1 2 3 4 5 6 7 8 9 10 11 12 13 14 15 16 17 18 19 20 21 22# 必要なライブラリをインポートします from transforms.api import transform, Output from palantir_models.transforms import ModelInput from sklearn.datasets import load_breast_cancer # transformというデコレータを使用して、関数の入力と出力を定義します @transform( # inference_outputは出力データセットのIDを指定します inference_output=Output("ri.foundry.main.dataset.5dd9907f-79bc-4ae9-a106-1fa87ff021c3"), # modelは使用するモデルのIDを指定します model=ModelInput("ri.models.main.model.cfc11519-28be-4f3e-9176-9afe91ecf3e1"), ) def compute(inference_output, model): # sklearnから乳がんデータセットをロードします X, y = load_breast_cancer(as_frame=True, return_X_y=True) # データフレームの列名にスペースが含まれている場合、アンダースコアに置き換えます X.columns = X.columns.str.replace(' ', '_') # モデルを使用して推論を行います inference_results = model.transform(X) # 推論結果を出力データセットに書き込みます inference_output.write_pandas(inference_results.df_out)
モデリングの目的でリアルタイム推論を実行する
Palantirモデルは、以下のためにモデリングの目的に提出することができます:
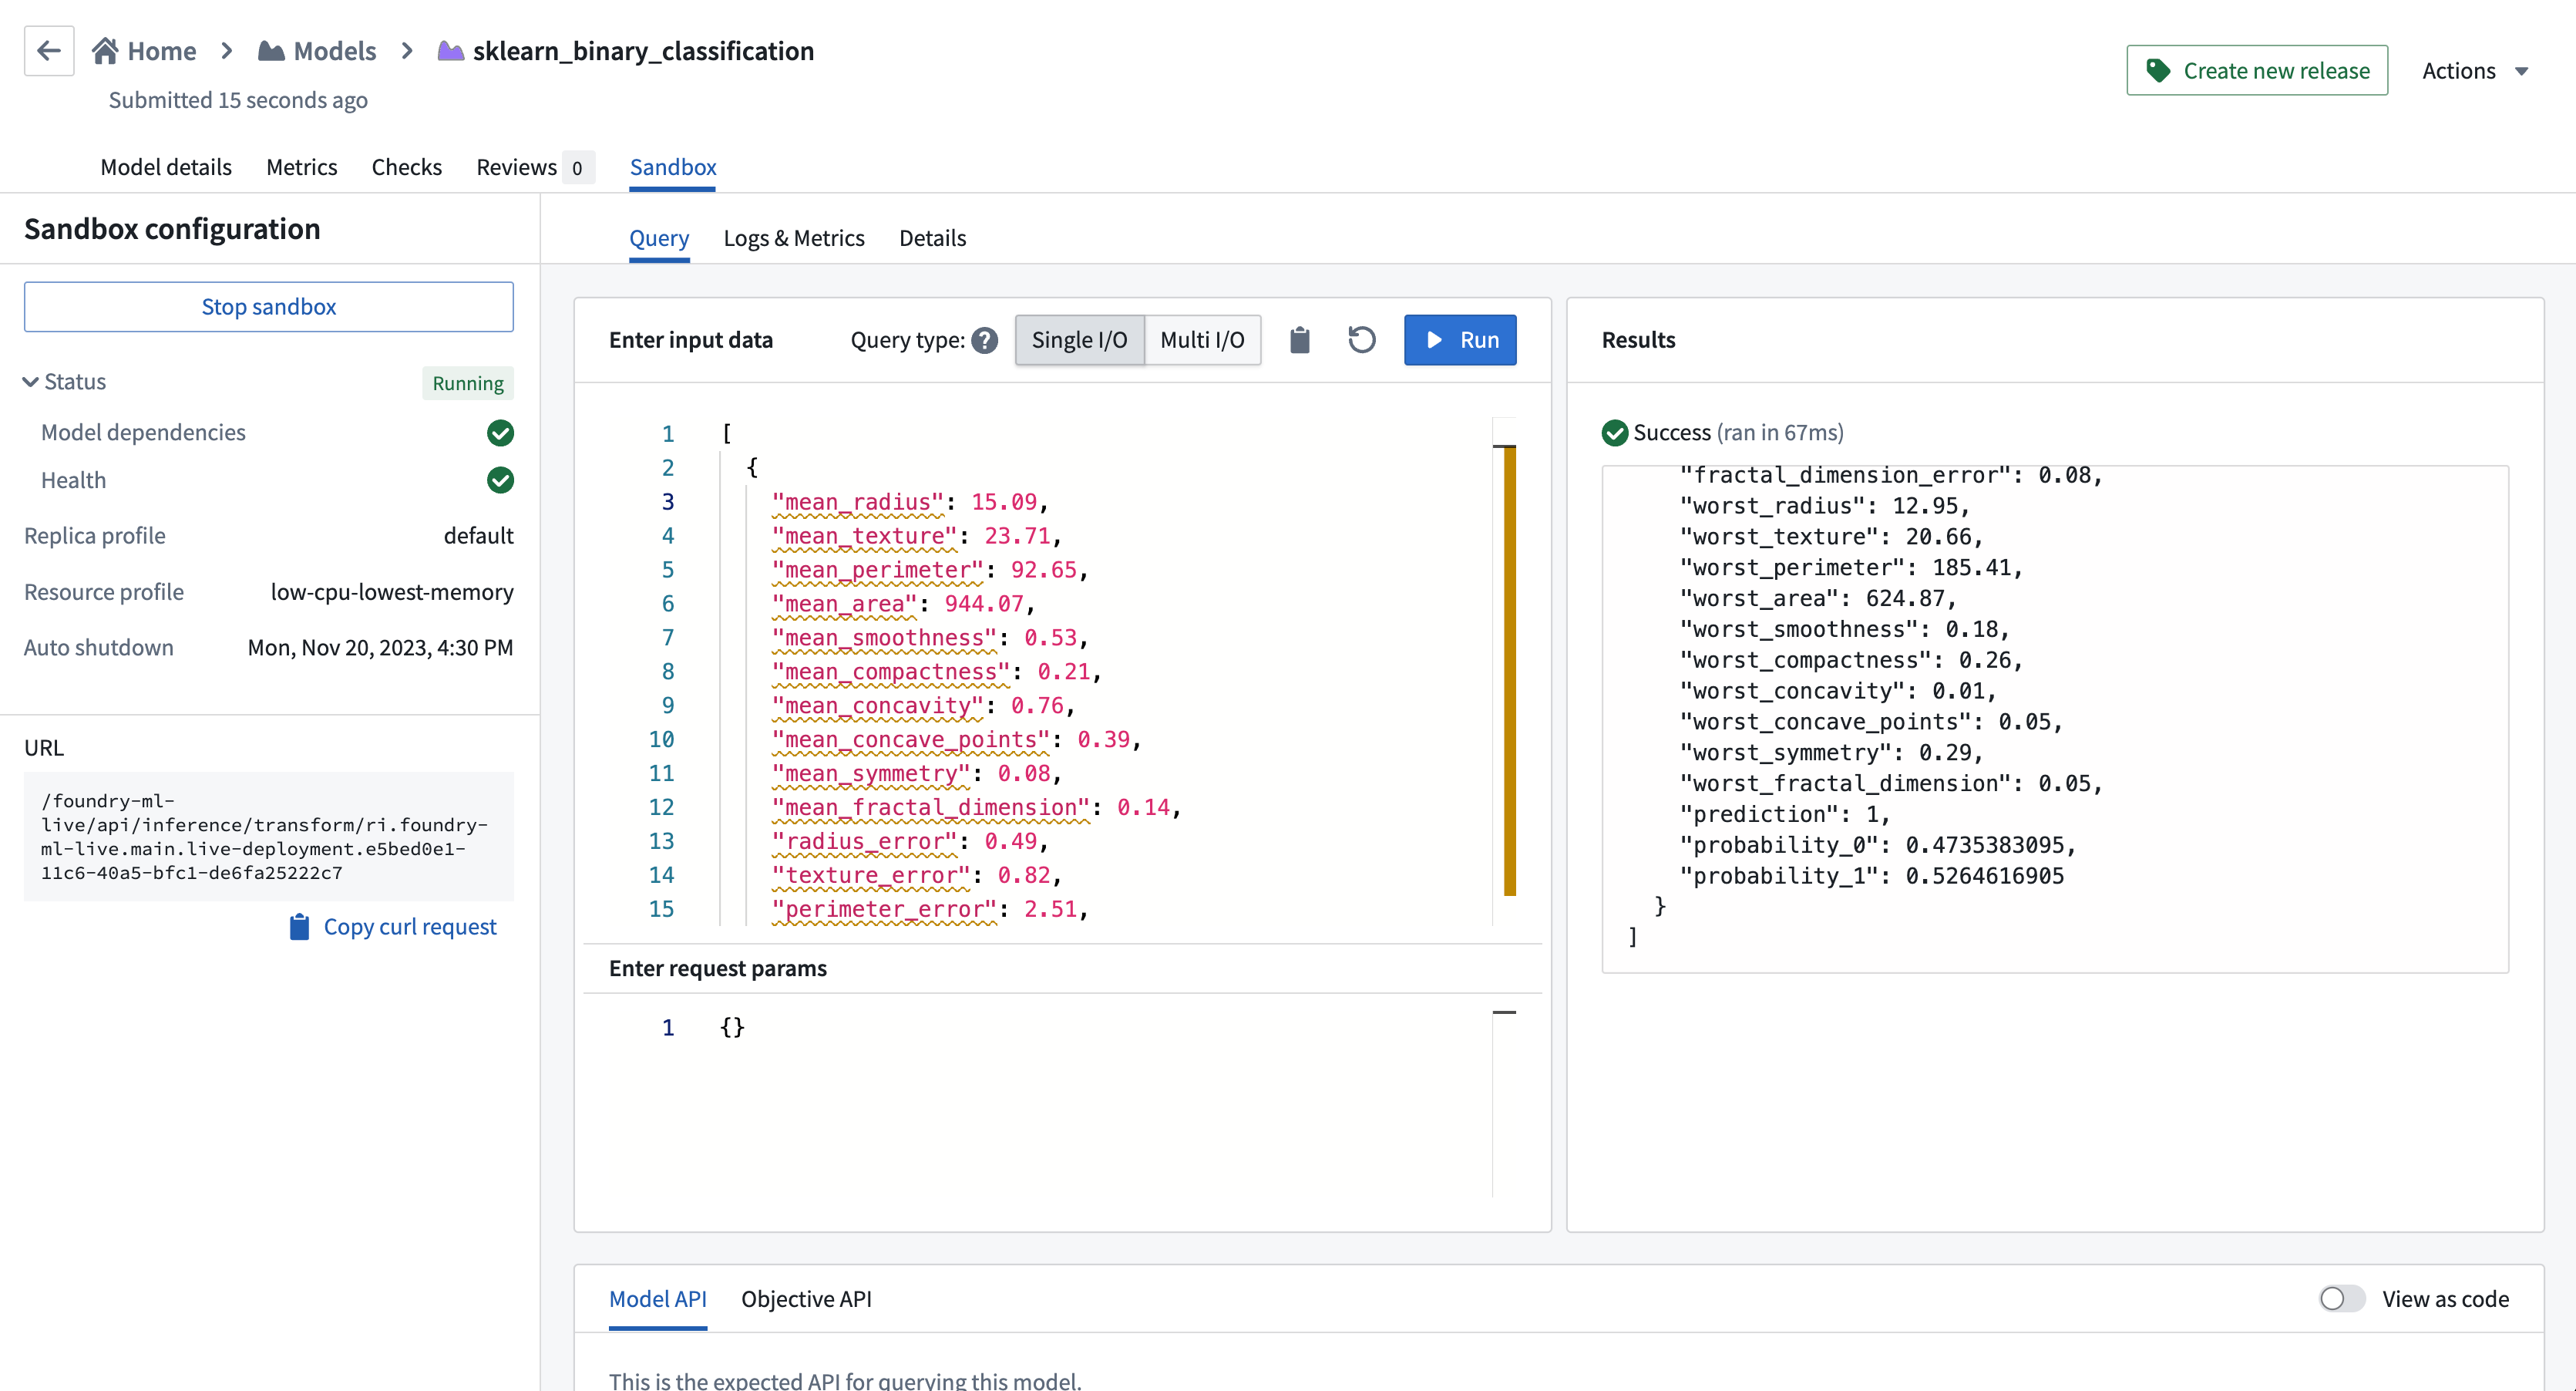
このモデルをモデリングの目的に提出した後、このモデルをリアルタイム推論のためにホストするためにサンドボックスデプロイメントを起動することができます。サンドボックスが起動し準備ができたら、リアルタイム推論を実行し、このモデルを運用アプリケーションに接続することができます。
以下の例は、単一のI/Oエンドポイントを使用して二値分類モデルの入力を示しています: 以下のコードは、乳がんの診断データを表現したJSON形式のデータです。各フィールドは乳がん細胞の特徴を表しています。
[
  {
    "mean_radius": 15.09,  // 平均半径
    "mean_texture": 23.71,  // 平均テクスチャ(グレースケールの値の標準偏差)
    "mean_perimeter": 92.65,  // 平均周長
    "mean_area": 944.07,  // 平均面積
    "mean_smoothness": 0.53,  // 平均滑らかさ(半径の長さの変化の局所的な変化)
    "mean_compactness": 0.21,  // 平均コンパクトさ(面積/半径^2)
    "mean_concavity": 0.76,  // 平均凹面(輪郭の凹みの重大度)
    "mean_concave_points": 0.39,  // 平均凹点の数(輪郭の凹部の数)
    "mean_symmetry": 0.08,  // 平均対称性
    "mean_fractal_dimension": 0.14,  // 平均フラクタル次元(輪郭近くの海岸線の複雑さ)
    "radius_error": 0.49,  // 半径のエラー
    "texture_error": 0.82,  // テクスチャのエラー
    "perimeter_error": 2.51,  // 周囲のエラー
    "area_error": 17.22,  // 面積のエラー
    "smoothness_error": 0.07,  // 滑らかさのエラー
    "compactness_error": 0.01,  // コンパクトさのエラー
    "concavity_error": 0.05,  // 凹面のエラー
    "concave_points_error": 0.05,  // 凹点のエラー
    "symmetry_error": 0.01,  // 対称性のエラー
    "fractal_dimension_error": 0.08,  // フラクタル次元のエラー
    "worst_radius": 12.95,  // 最悪の半径(最大の3つの半径の平均)
    "worst_texture": 20.66,  // 最悪のテクスチャ(最大の3つのテクスチャの平均)
    "worst_perimeter": 185.41,  // 最悪の周囲(最大の3つの周囲の平均)
    "worst_area": 624.87,  // 最悪の面積(最大の3つの面積の平均)
    "worst_smoothness": 0.18,  // 最悪の滑らかさ(最大の3つの滑らかさの平均)
    "worst_compactness": 0.26,  // 最悪のコンパクトさ(最大の3つのコンパクトさの平均)
    "worst_concavity": 0.01,  // 最悪の凹面(最大の3つの凹面の平均)
    "worst_concave_points": 0.05,  // 最悪の凹点(最大の3つの凹点の平均)
    "worst_symmetry": 0.29,  // 最悪の対称性(最大の3つの対称性の平均)
    "worst_fractal_dimension": 0.05  // 最悪のフラクタル次元(最大の3つのフラクタル次元の平均)
  }
]
