Writeback cards
Back to: Index of cards
Action buttons can be added to your Quiver analysis canvas, time series charts, and dashboards to allow users to write data back to the Ontology; for example, by creating objects, updating properties on existing objects, or modifying object links.
- Add and configure an Action button
- Invoke Ontology Actions directly from a time series chart
- Use selection boundary values as input to Ontology Actions
- Customize the button display
Examples
This capability can be used to enhance a variety of workflows, including:
Example 1: Create an Annotation object instance
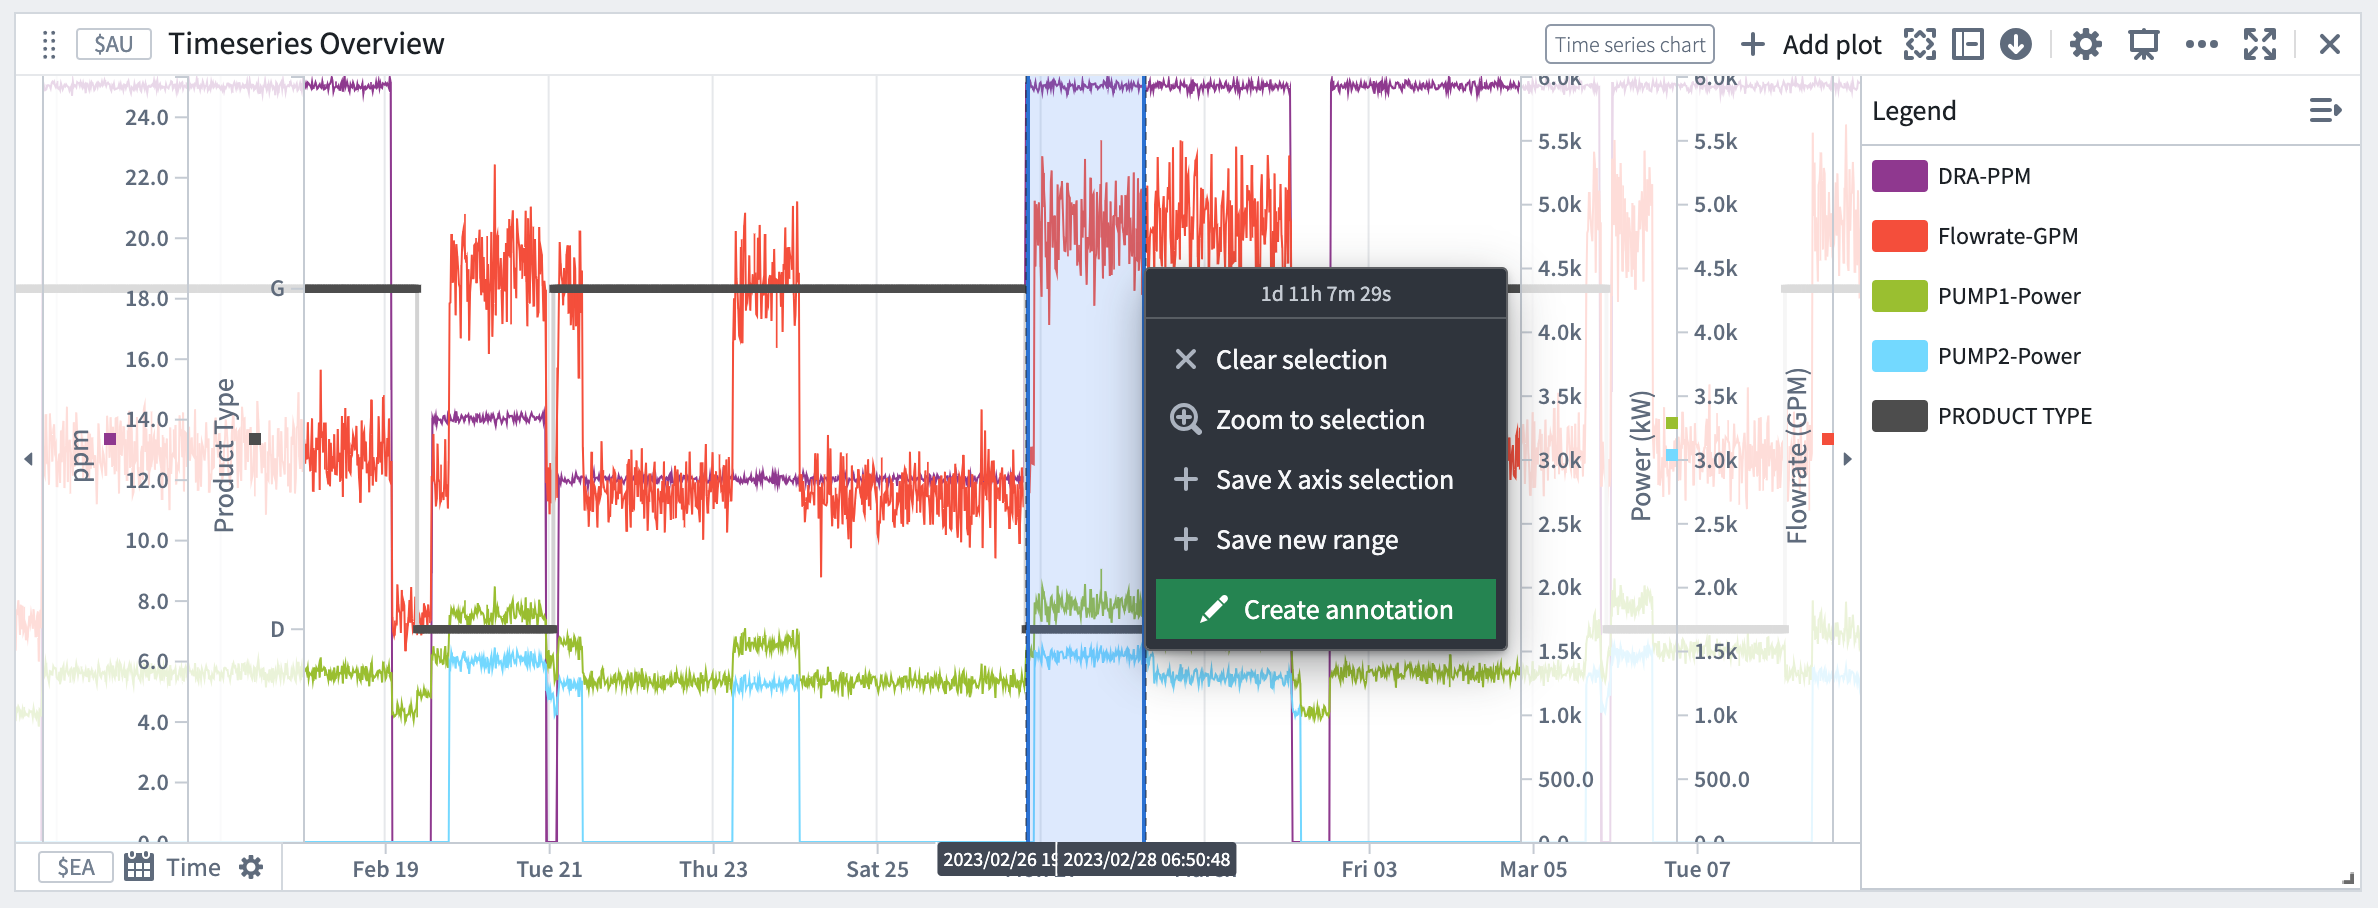
Within a time series chart, you can create an object that captures context on an observed phenomenon, such as reasons for a machinery malfunction or a market macro event that affected a stock index. The start and end temporal values of the x-axis selection are passed as inputs to the Create annotation Ontology Action, resulting in an annotation event. The ability to annotate the plot with multiple events provides greater clarity on the data visuals at hand.
Example 2: Adjust operational values
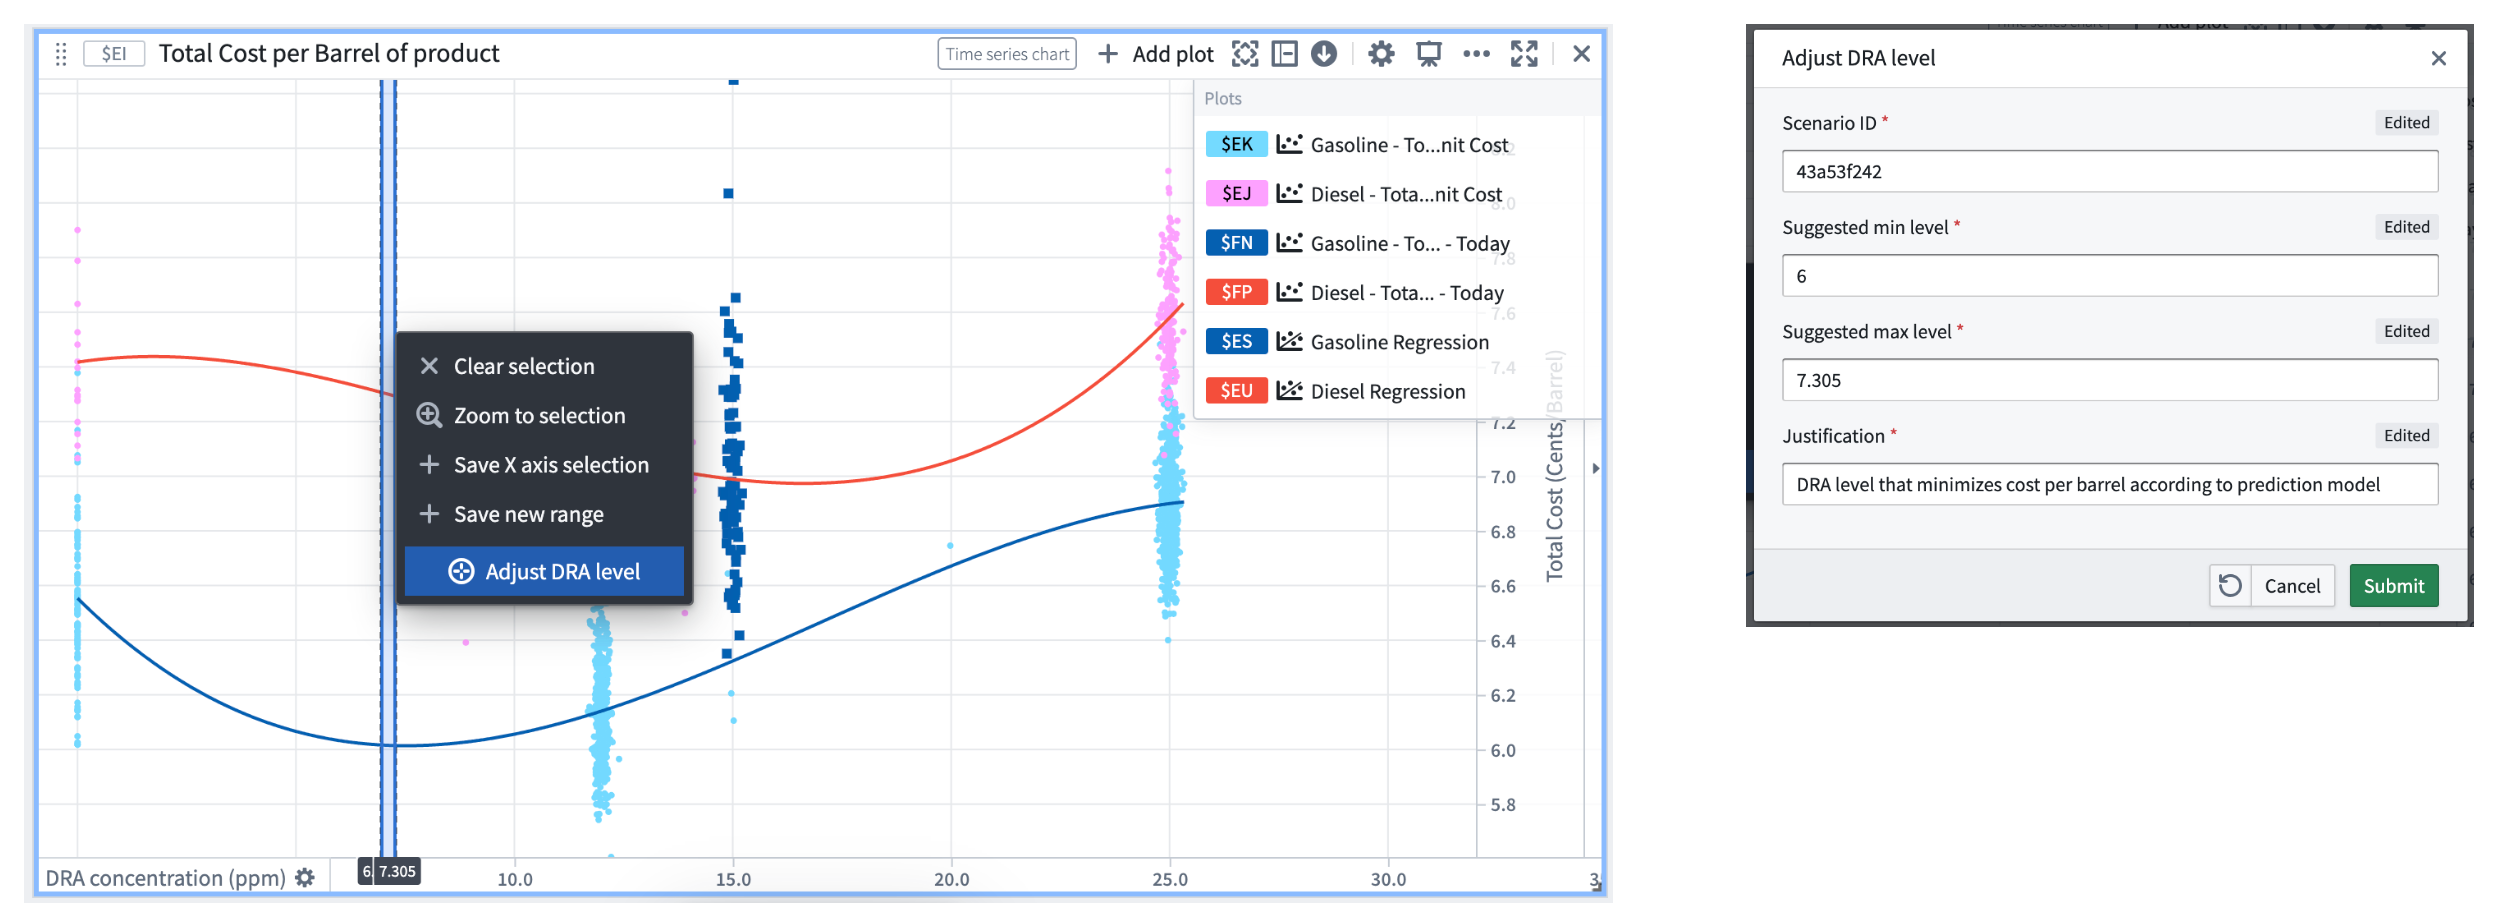
You can also invoke an Ontology Action to update a property value based on an observed phenomenon. For example, the time series chart below displays two curves that show the predicted total cost per barrel for two types of products, Gasoline (in blue) and Diesel (in red). We can note that today’s actual total cost per barrel (y-axis) for Gasoline (dark blue dots) ranges from 6.35 to 8.45 cents/barrel and is far from the minimal predicted total cost which is 6.01 cents/barrel. To lower the production cost we can adjust the DRA concentration rate from 15 ppm to a value closer to 6.5 ppm. By selecting a range around 6 on the x-axis, we can then select the Adjust DRA level Ontology Action which will be set with the selection boundary values automatically.
Add and configure an Action button
To add an Action button to an analysis:
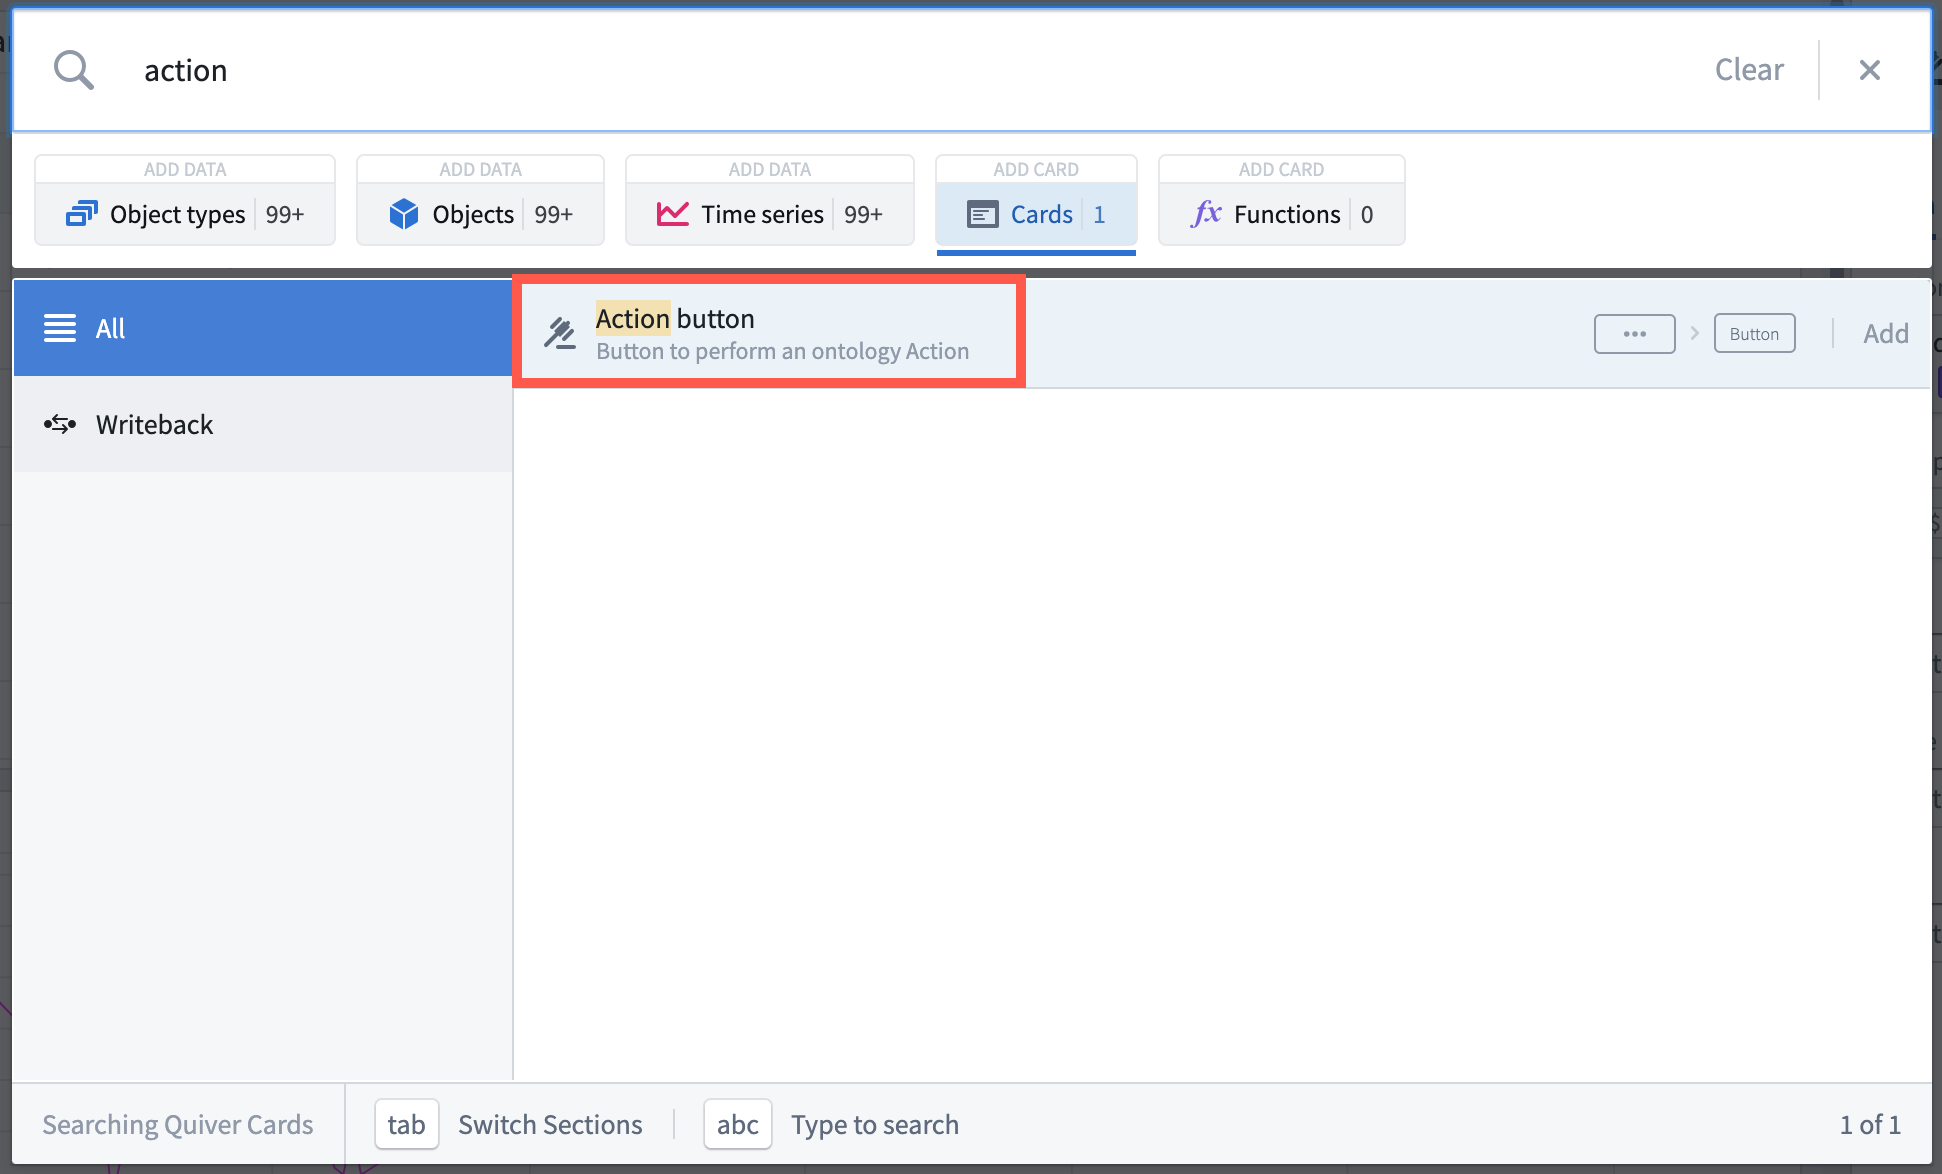
- Open the search bar by selecting Search cards from the analysis top bar.
- Search for
actionor navigate to the Writeback category on the left. - Select the Action button card.
To configure an Action button card:
- Find the Action button in the Parameter panel.
- Open the Action button editor by selecting the Configure cog wheel icon.
- Select an existing Ontology Action from the dropdown list. If the Action does not exist yet, you will need to create a new Action in the Ontology.
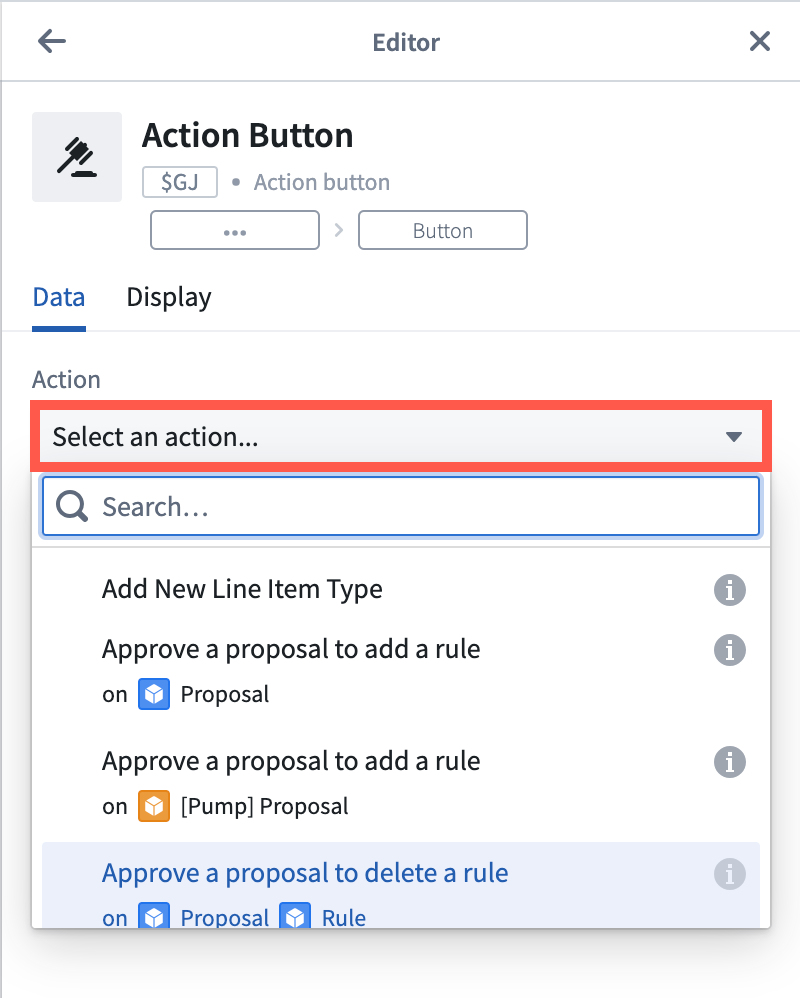
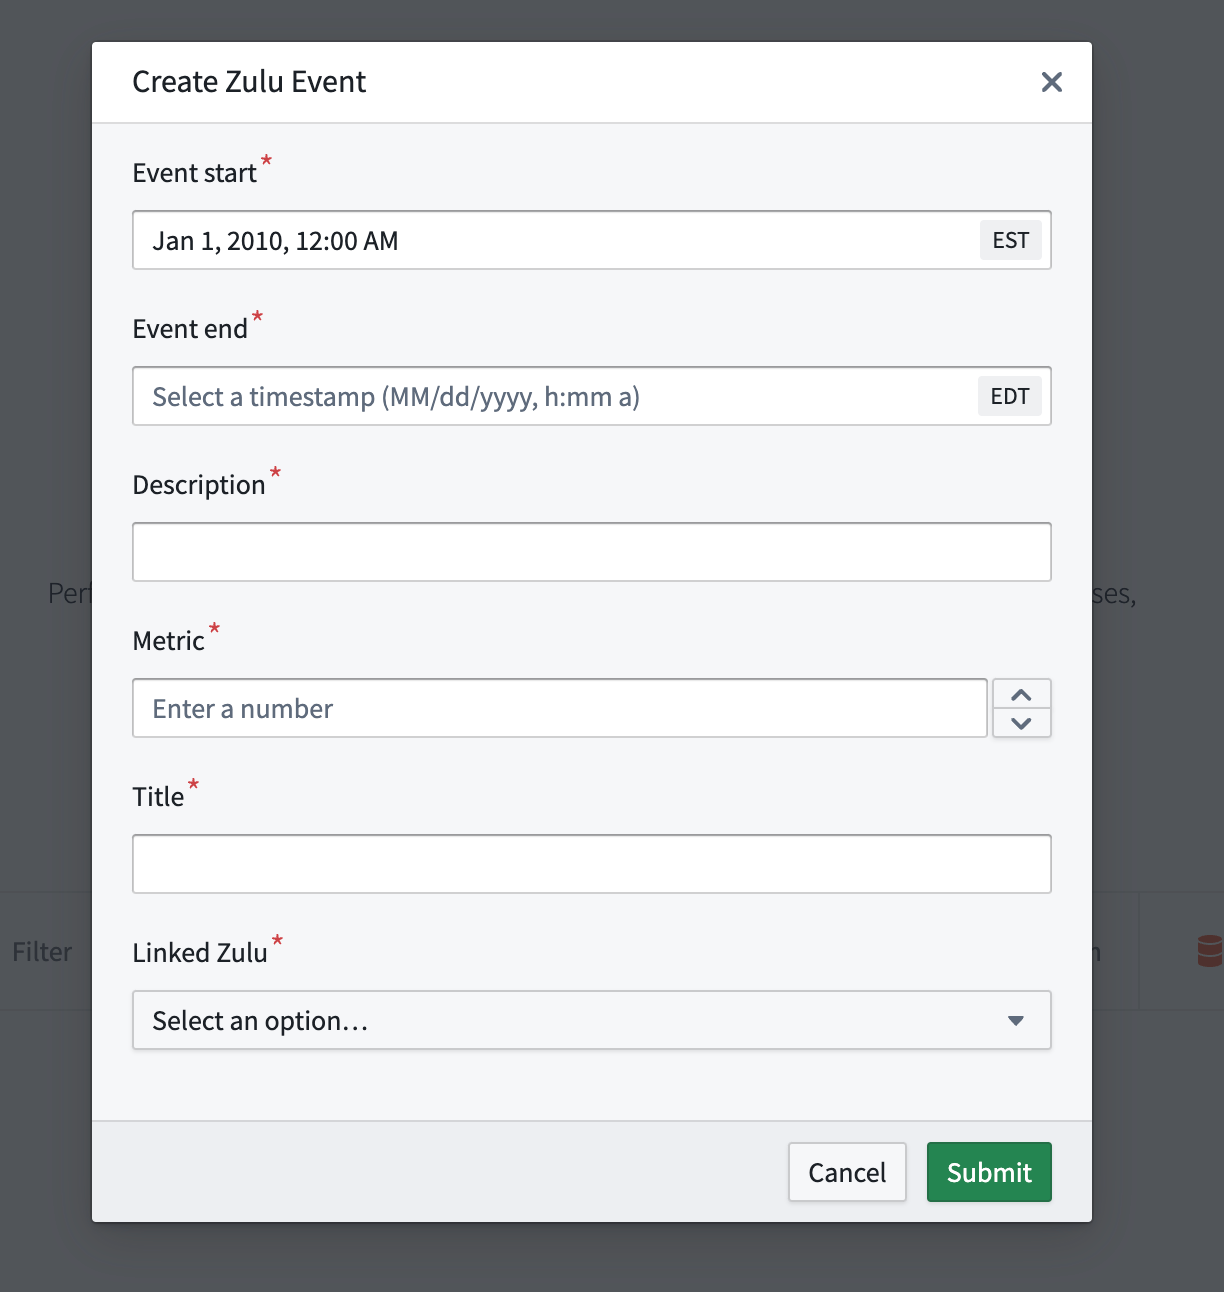
Selecting the Action button displays a form to fill out the inputs and submit the action. In the Action button editor, default inputs can be provided.
For example, in the following image, the Event start parameter is configured with a default value of January 1, 2010.
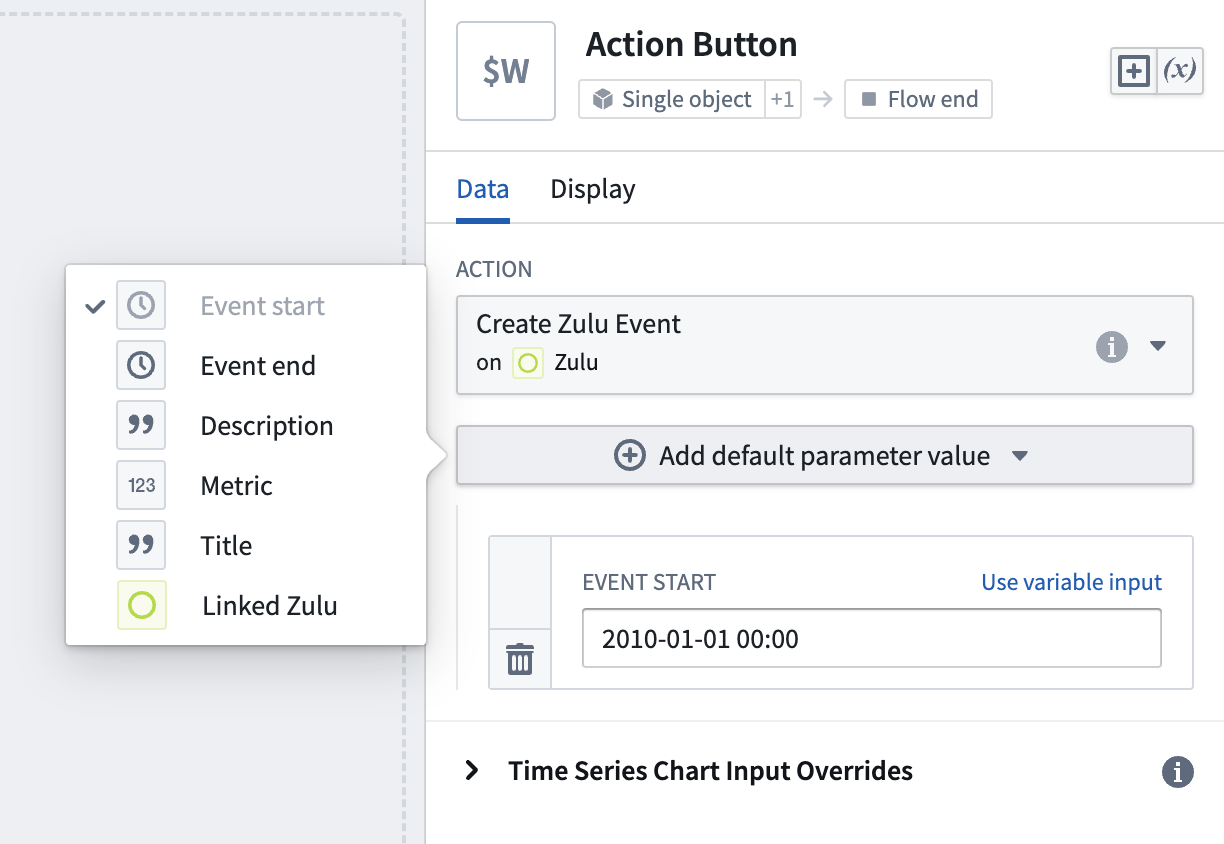
Selecting the action button shows January 1, 2010 as the input value for Event start parameter. Users can still edit this value before submitting the action.
Invoke Ontology Actions directly from a time series chart
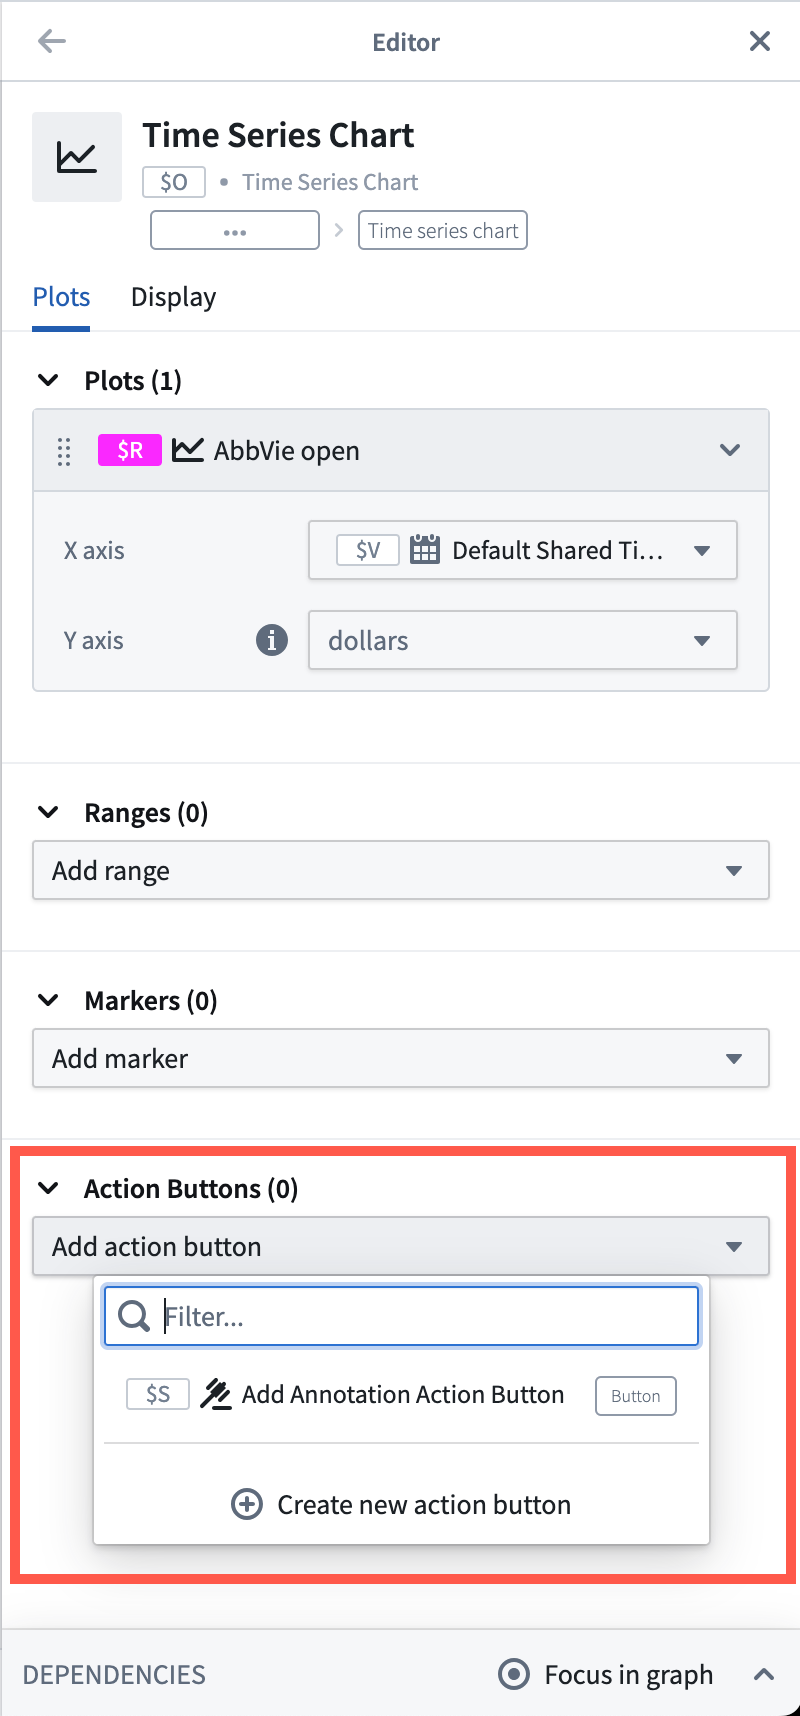
It is possible to expose Ontology Action buttons directly from the selection menu of a time series chart. To add an Action button to a time series chart selection menu:
- Open the time series chart editor by selecting the Configure cog wheel icon on the card header.
- Under the Action Buttons section, open the dropdown and select an existing Action button from the analysis or create a new one. The Ontology action button will now be visible in the selection menu.
Use selection boundary values as input to Ontology Actions
When an Ontology Action button is added to a time series chart, the inputs to the Ontology action can be parameterzied using the boundary values of the x- or y-axis selection.
To use the selection boundary values as Ontology Action inputs:
- Open the Action button editor and expand the Time Series Chart Input Override section.
- Add overrides based on x-axis selection, y-axis selection, or both. The selection boundaries are mapped to an action parameter based on the data type. For example, x-axis selections on a time axis can be mapped to a date/time action parameter.
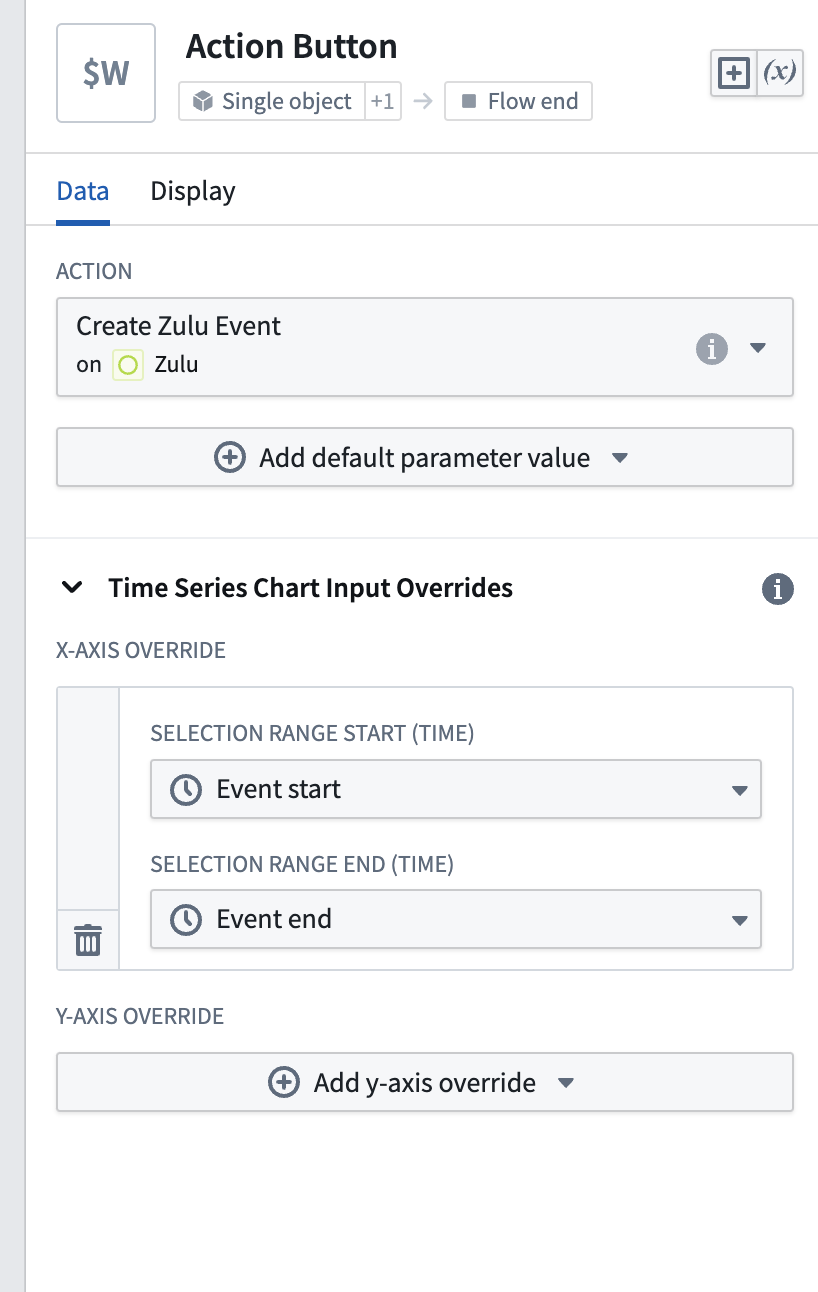
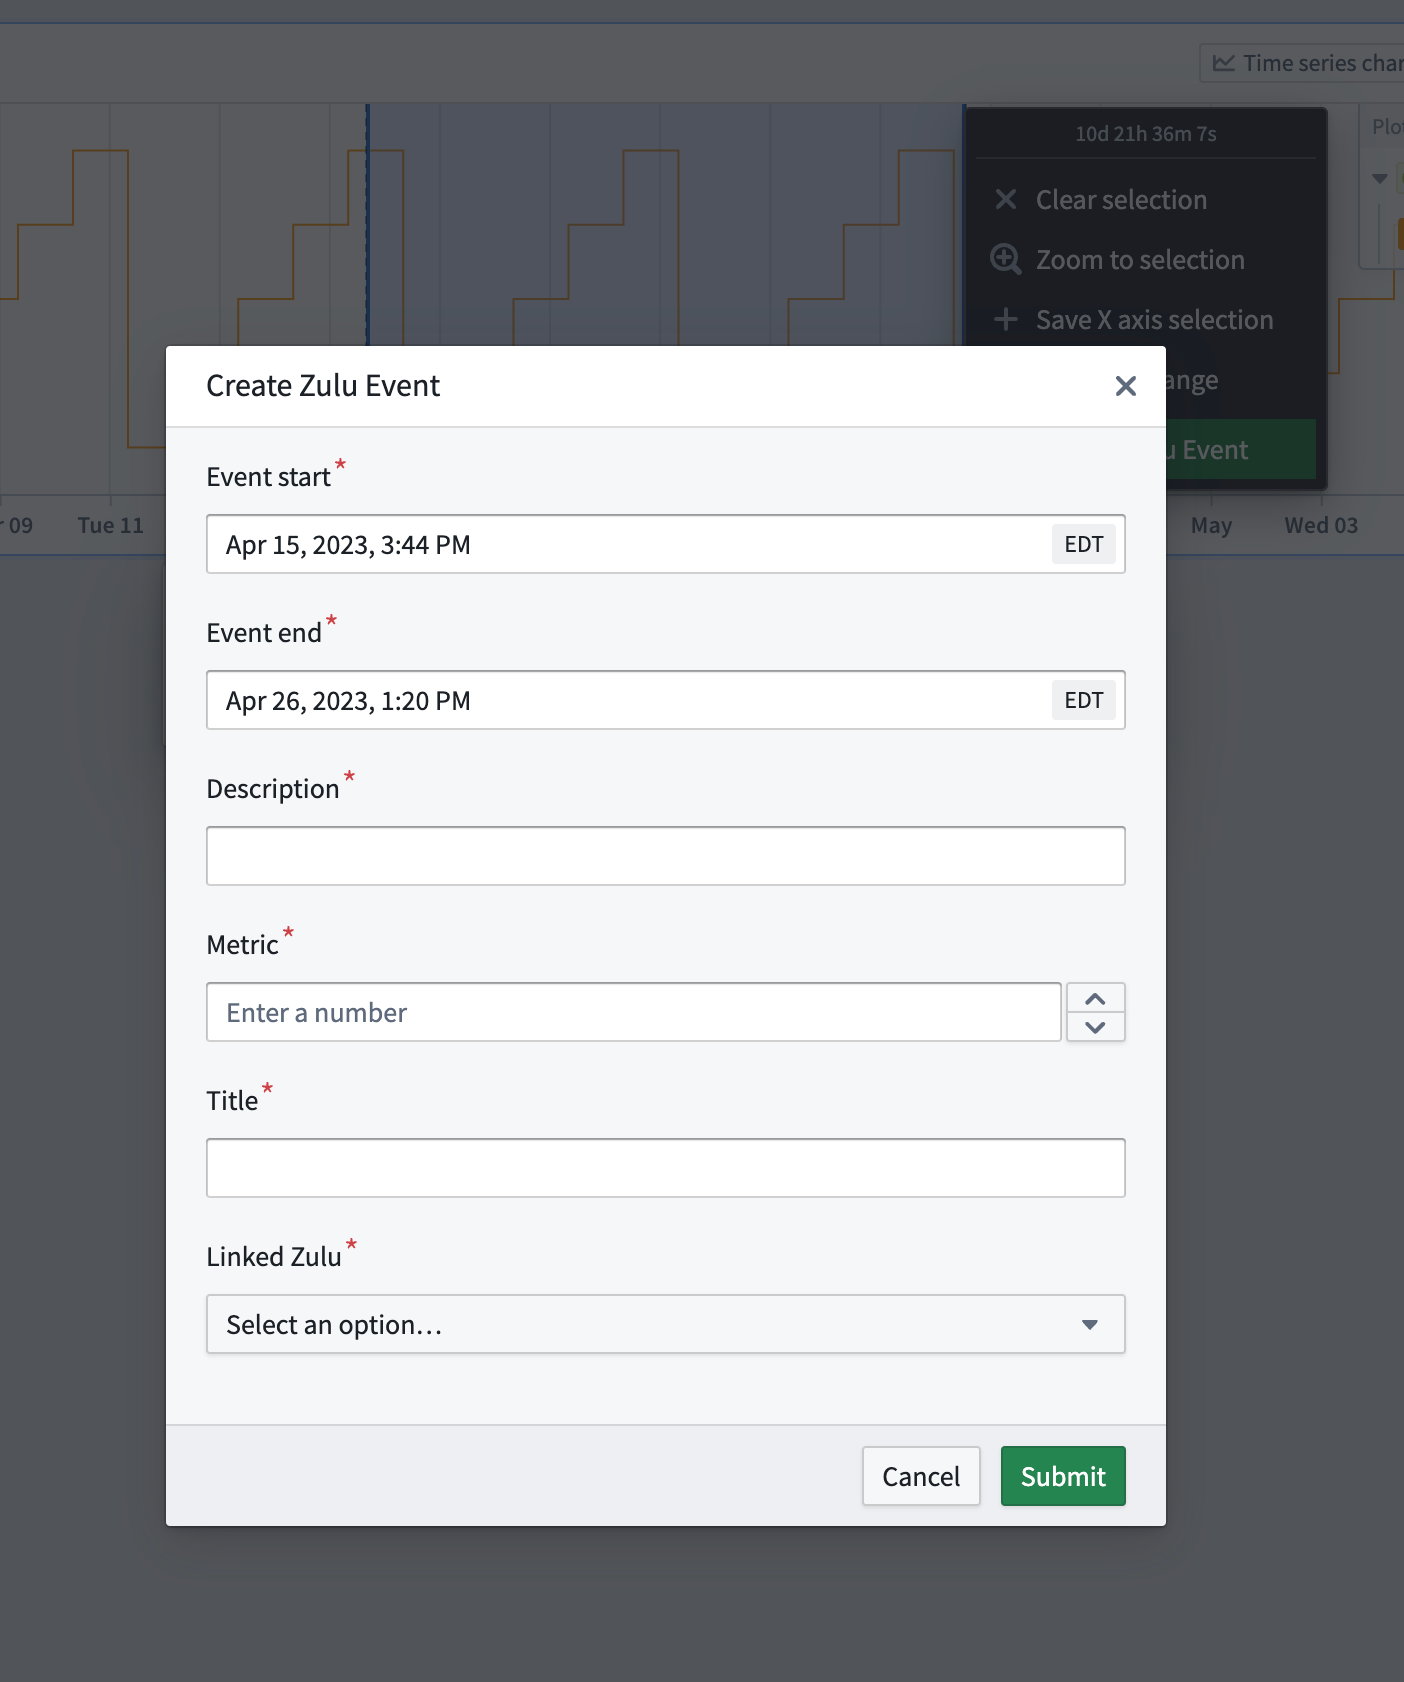
In the following example, the selection left and right bounds were mapped to the Event start and Event end parameters. Selecting the action button from the time series chart selection menu auto-populates those values.
Customize the button display
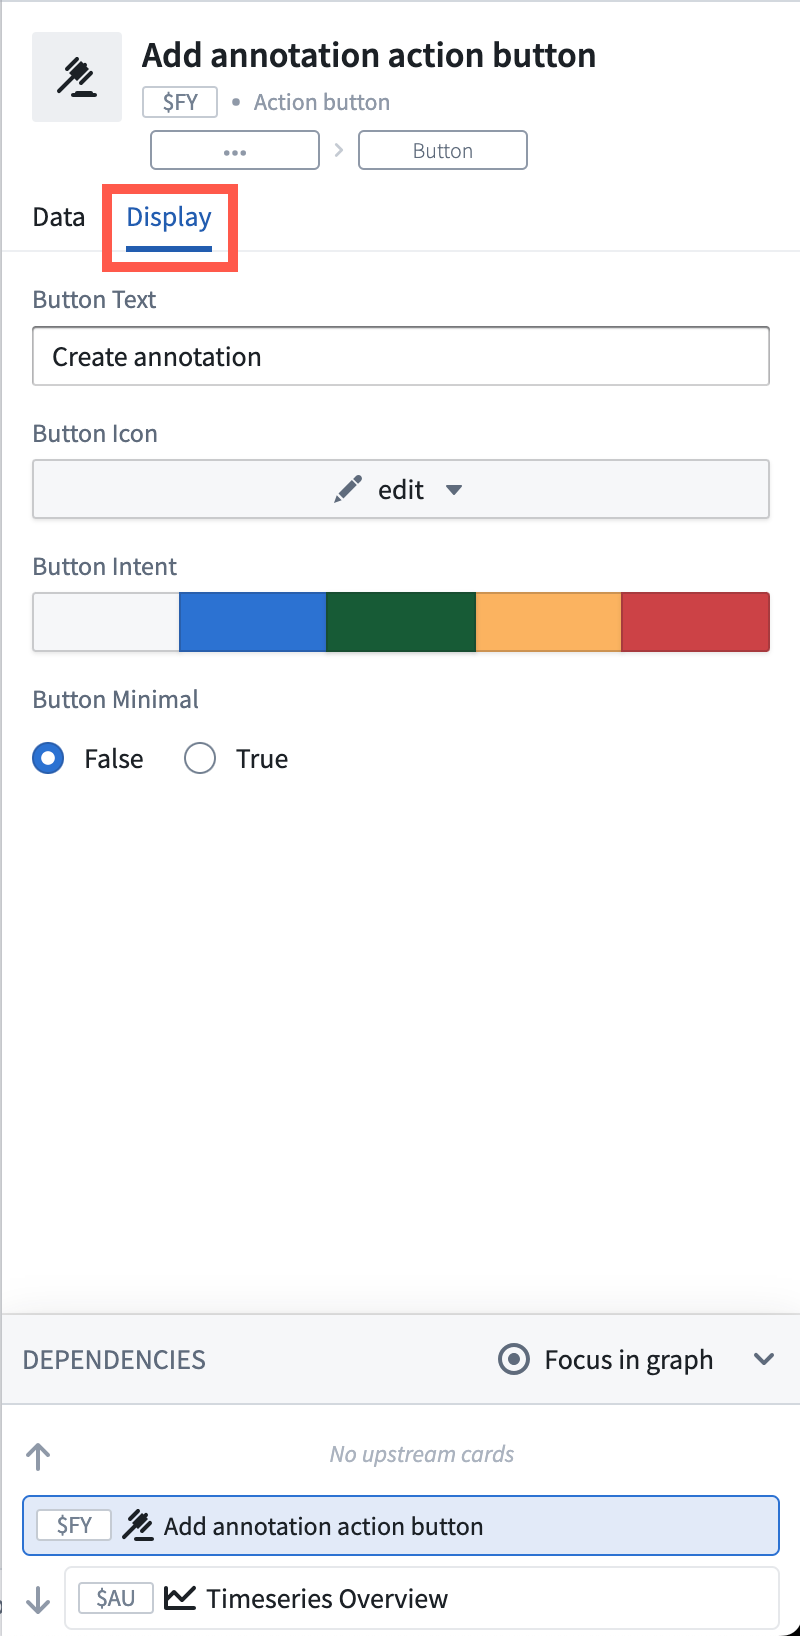
You can customize the appearance of the button in the Display tab of the Action button editor. You can choose a label, an icon, a color, and a style.
