- Capabilities
- Getting started
- Architecture center
- Platform updates
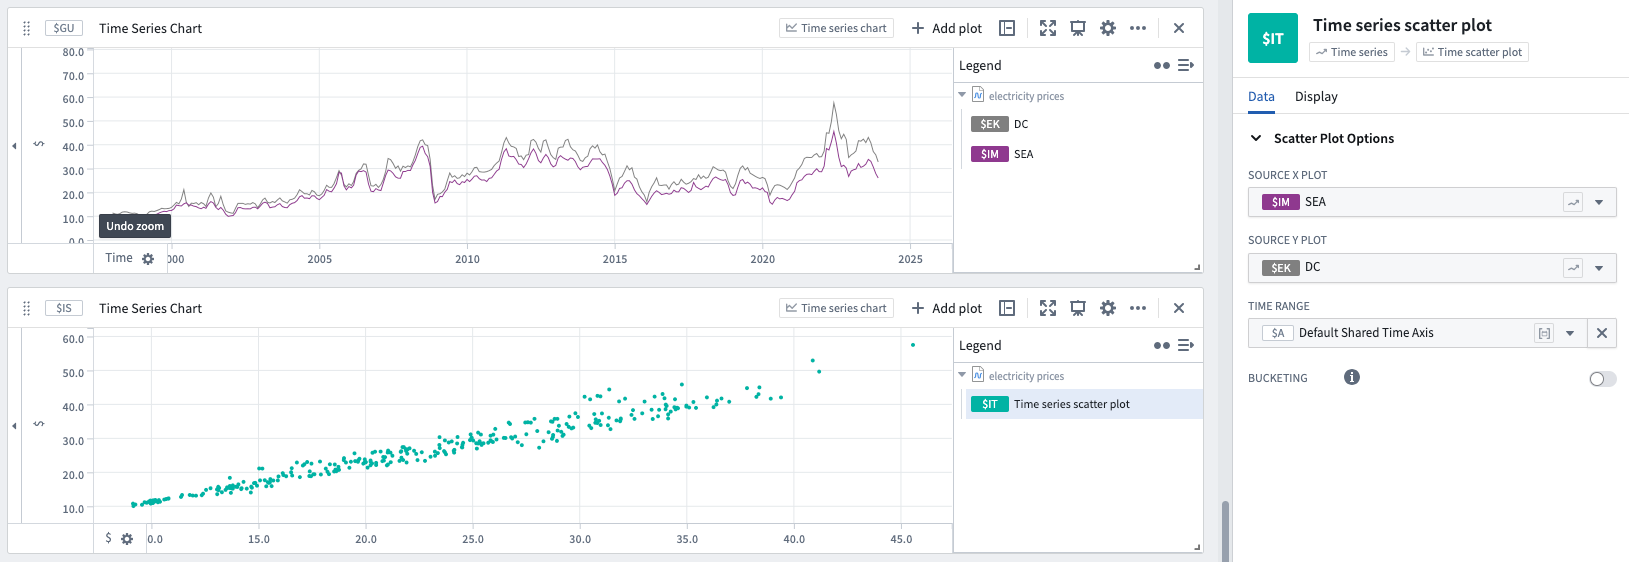
Time series scatter plot
Scatter plots can be used to plot two series against each other. Points of the underlying series will automatically be aggregated (using the average value over buckets that are 1/1000 of the underlying time range) before plotting.
- Both the bucketing strategy (the number of buckets and points per bucket), and the bucket value (for example, average, sum, max) can be specified.
- The range for each series included in the cross plot is automatically set to underlying the plot zoom range, but can be modified to a manual range instead.
Input type
Time series
Output type
Time series scatter plot
Examples
Usage information
| Functionality | Availability |
|---|---|
| Standard Quiver card | Supported |
| Transform table transform | Supported |