- Capabilities
- Getting started
- Architecture center
- Platform updates
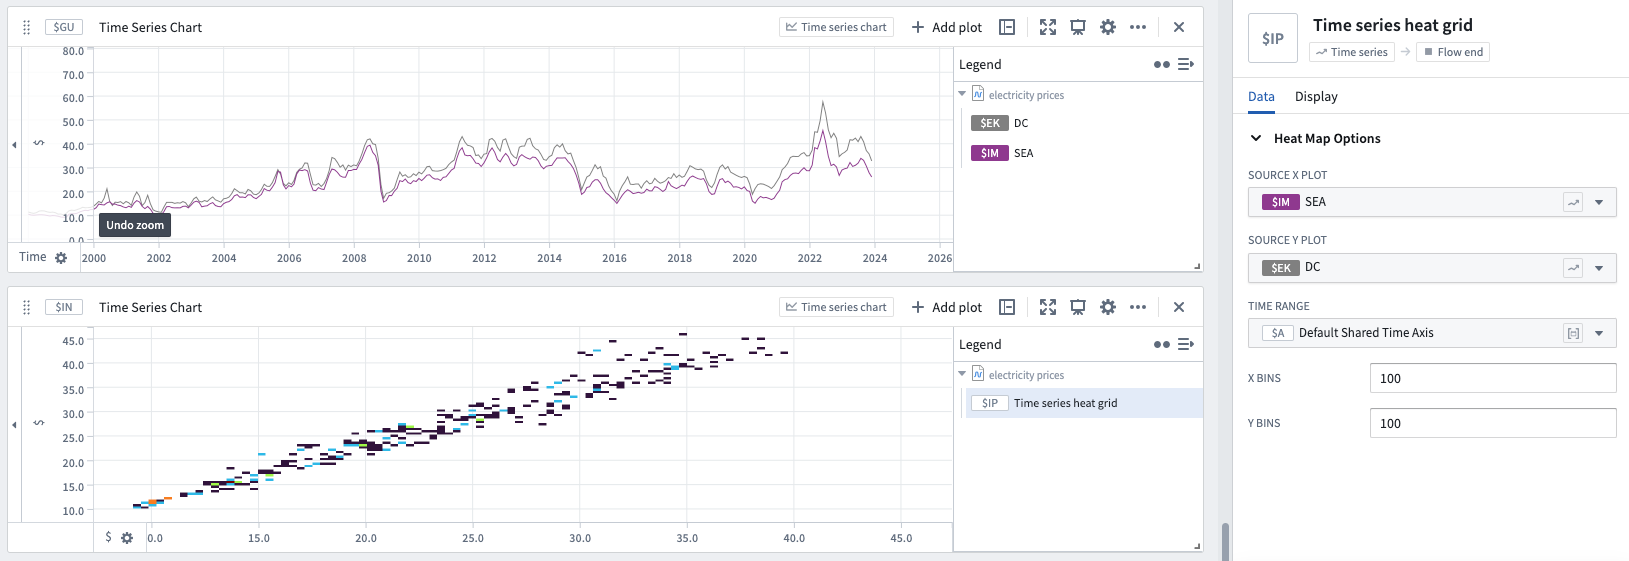
Time series heat grid
Heat grids display a two-dimensional aggregate value grid of two time series. Heat grids are similar to scatter plots, but instead color by the density of points appearing in the same bucket.
Input type
Time series
Output type
Flow end
Examples
Usage information
| Functionality | Availability |
|---|---|
| Standard Quiver card | Supported |
| Transform table transform | Unsupported |