- Capabilities
- Getting started
- Architecture center
- Platform updates
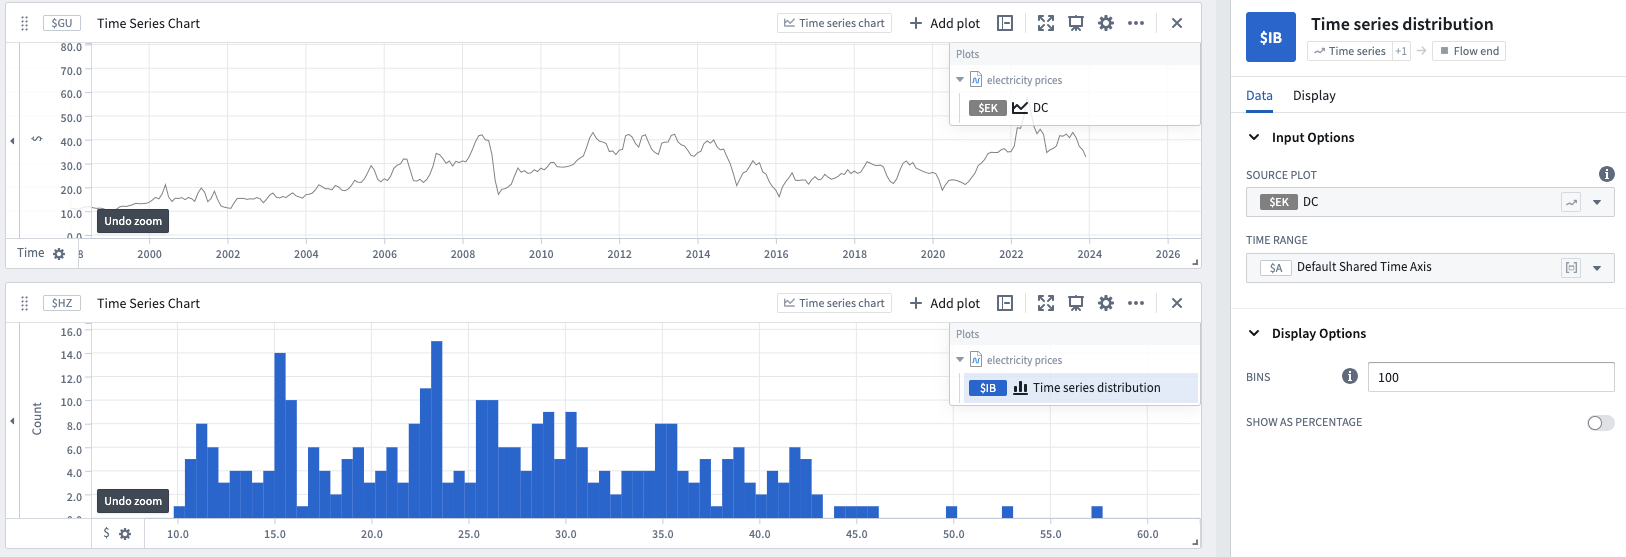
Time series distribution
Distribution charts show the aggregate counts of the y-axis value of series.
- By default, the entire time range is used, but a time range parameter can be used to specify a certain time range.
- The number of bins can also be specified to change the frequency of the graph.
Input type
Time series
Output type
Flow end
Examples
Usage information
| Functionality | Availability |
|---|---|
| Standard Quiver card | Supported |
| Transform table transform | Unsupported |