- Capabilities
- Getting started
- Architecture center
- Platform updates
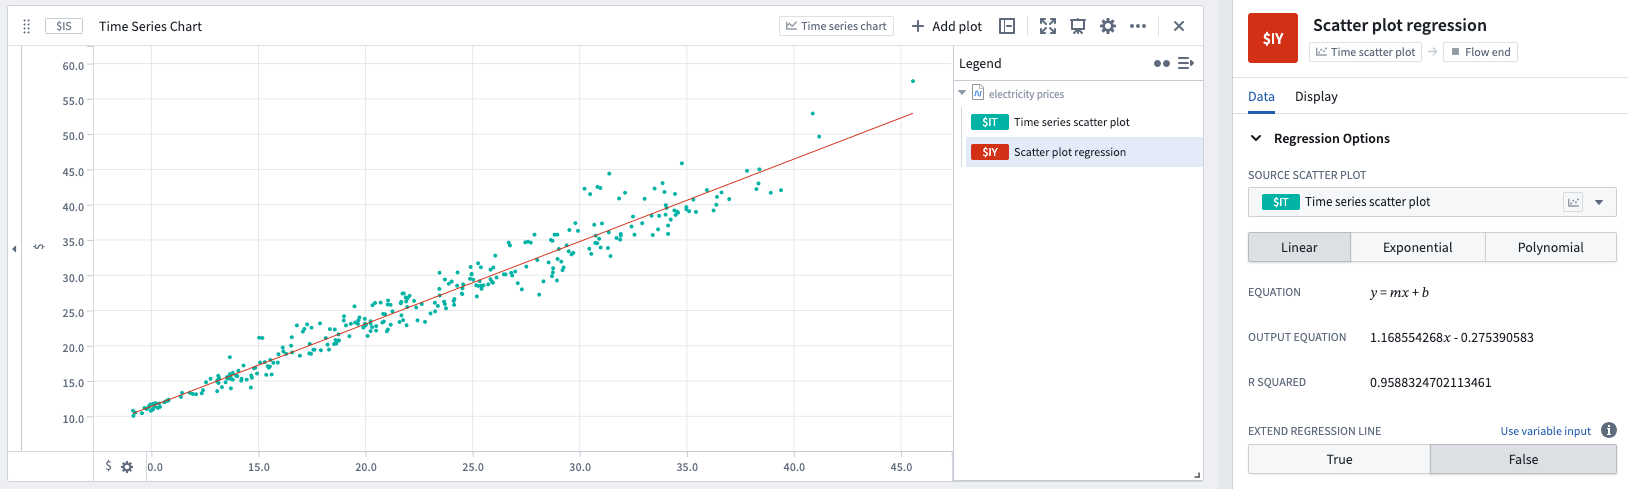
Scatter plot regression
Scatter plot regression is used to view the best-fit regression line over a time series scatter plot.
- Linear, polynomial (of degree 0-13), or exponential regression fits can be chosen.
- The time range used to compute the best fit line is set by default to be the source plot zoom range, but can be modified to match a range instead.
Input type
Time series scatter plot
Output type
Time series
Examples
Usage information
| Functionality | Availability |
|---|---|
| Standard Quiver card | Supported |
| Transform table transform | Supported |