- Capabilities
- Getting started
- Architecture center
- Platform updates
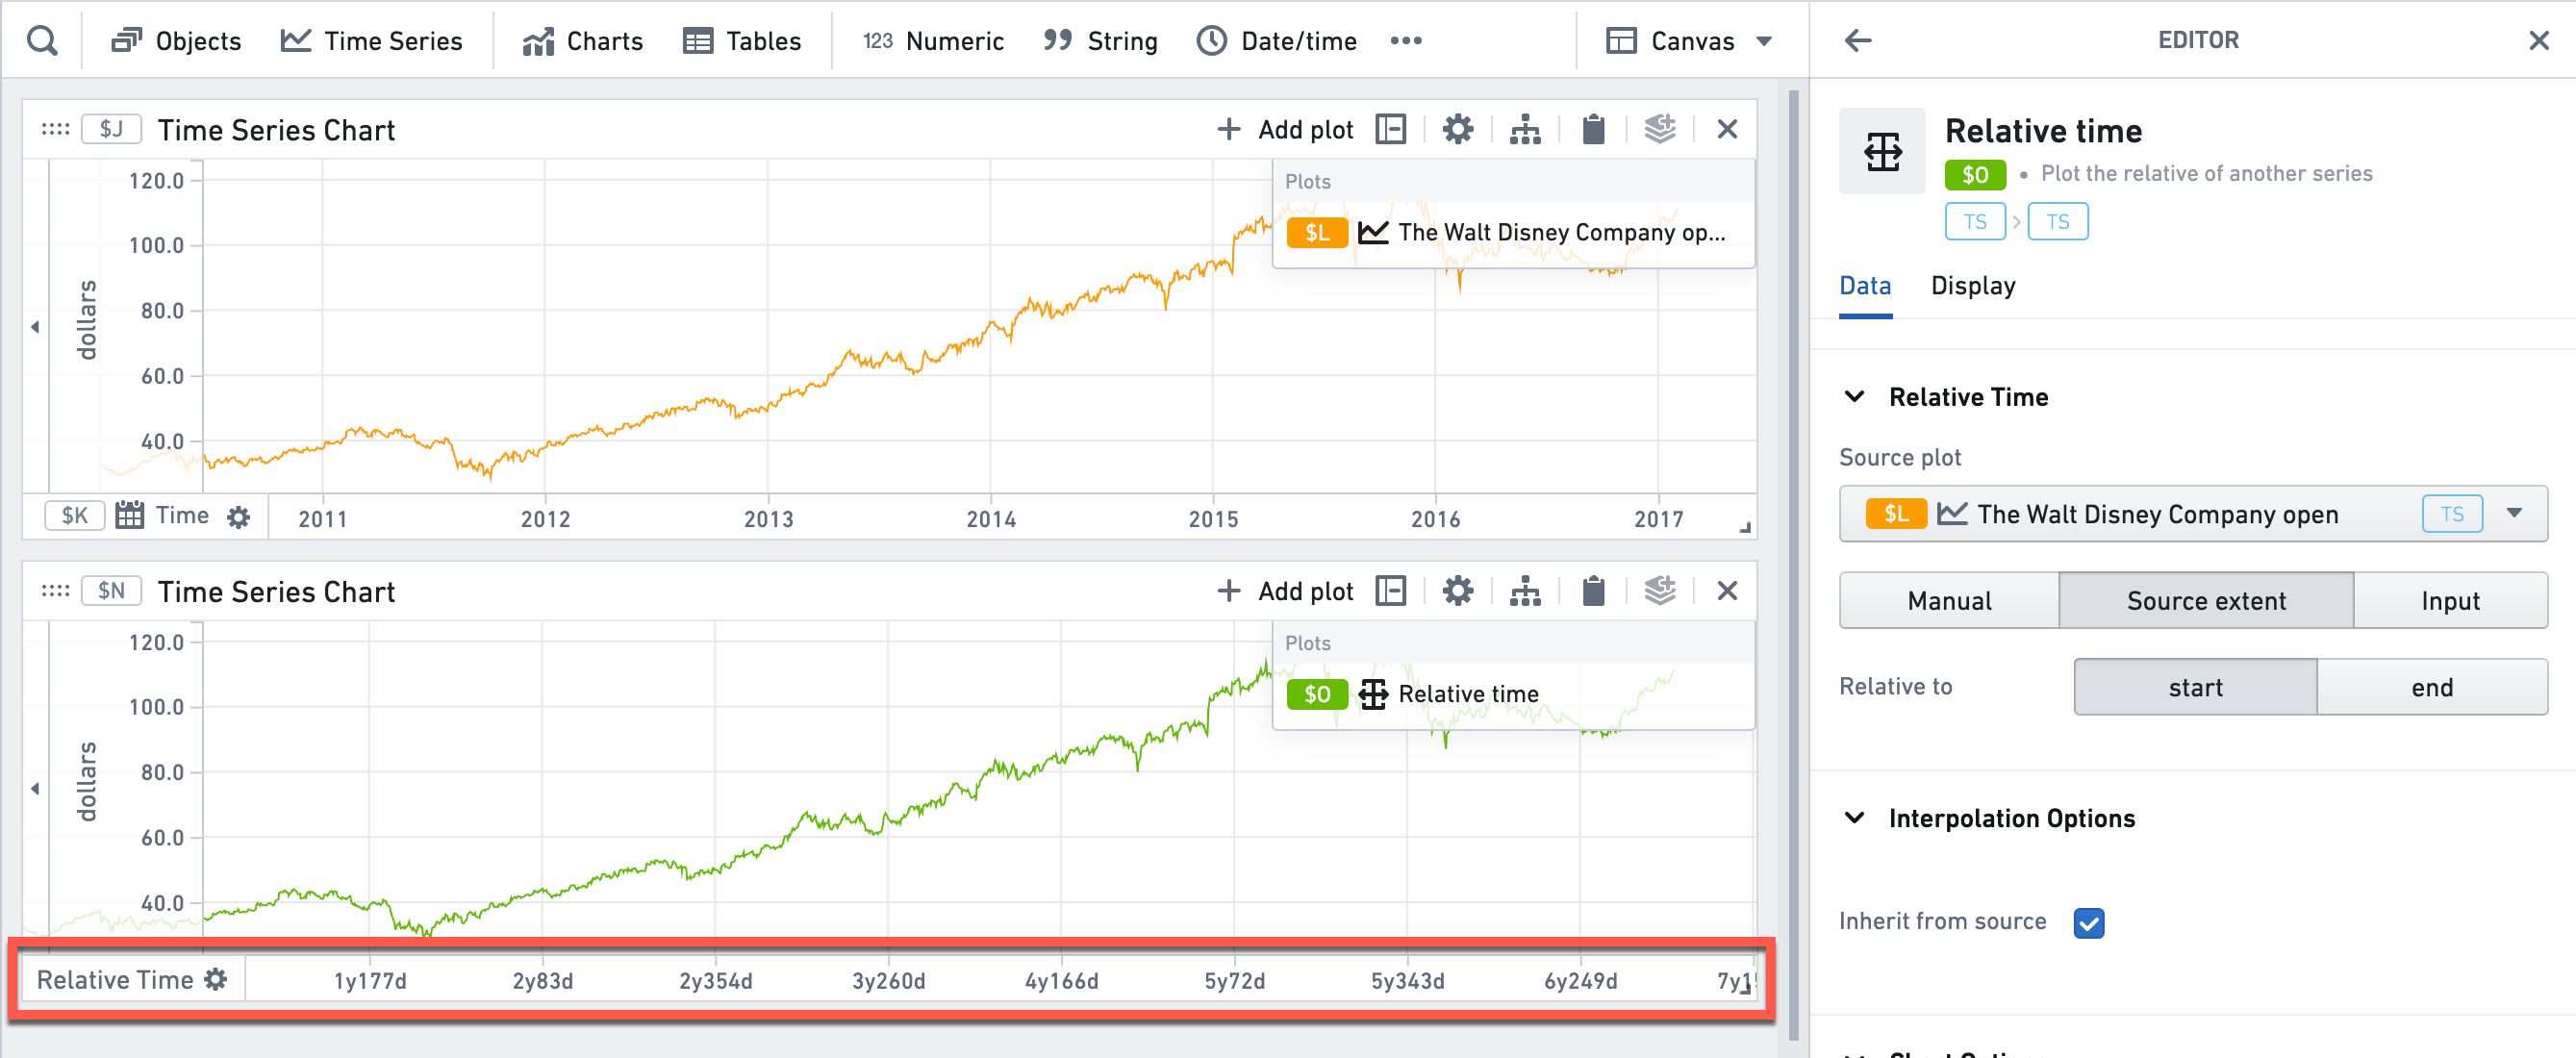
Relative time
The relative axis plot type can be used to plot series against a time-axis that is not absolute. Instead, you can plot relative to the source plot used.
- In the example below, the relative axis is aligned to the start time of the series. Therefore, the X axis displays days/years since the first time point, instead of the absolute time.
- In addition to aligning to the source plot, you can also align to arbitrary time ranges, time series searches, or arbitrary custom dates.
Learn more about how to use relative time.
Input type
Time series
Output type
Time series
Examples
Usage information
| Functionality | Availability |
|---|---|
| Standard Quiver card | Supported |
| Transform table transform | Supported |