- Capabilities
- Getting started
- Architecture center
- Platform updates
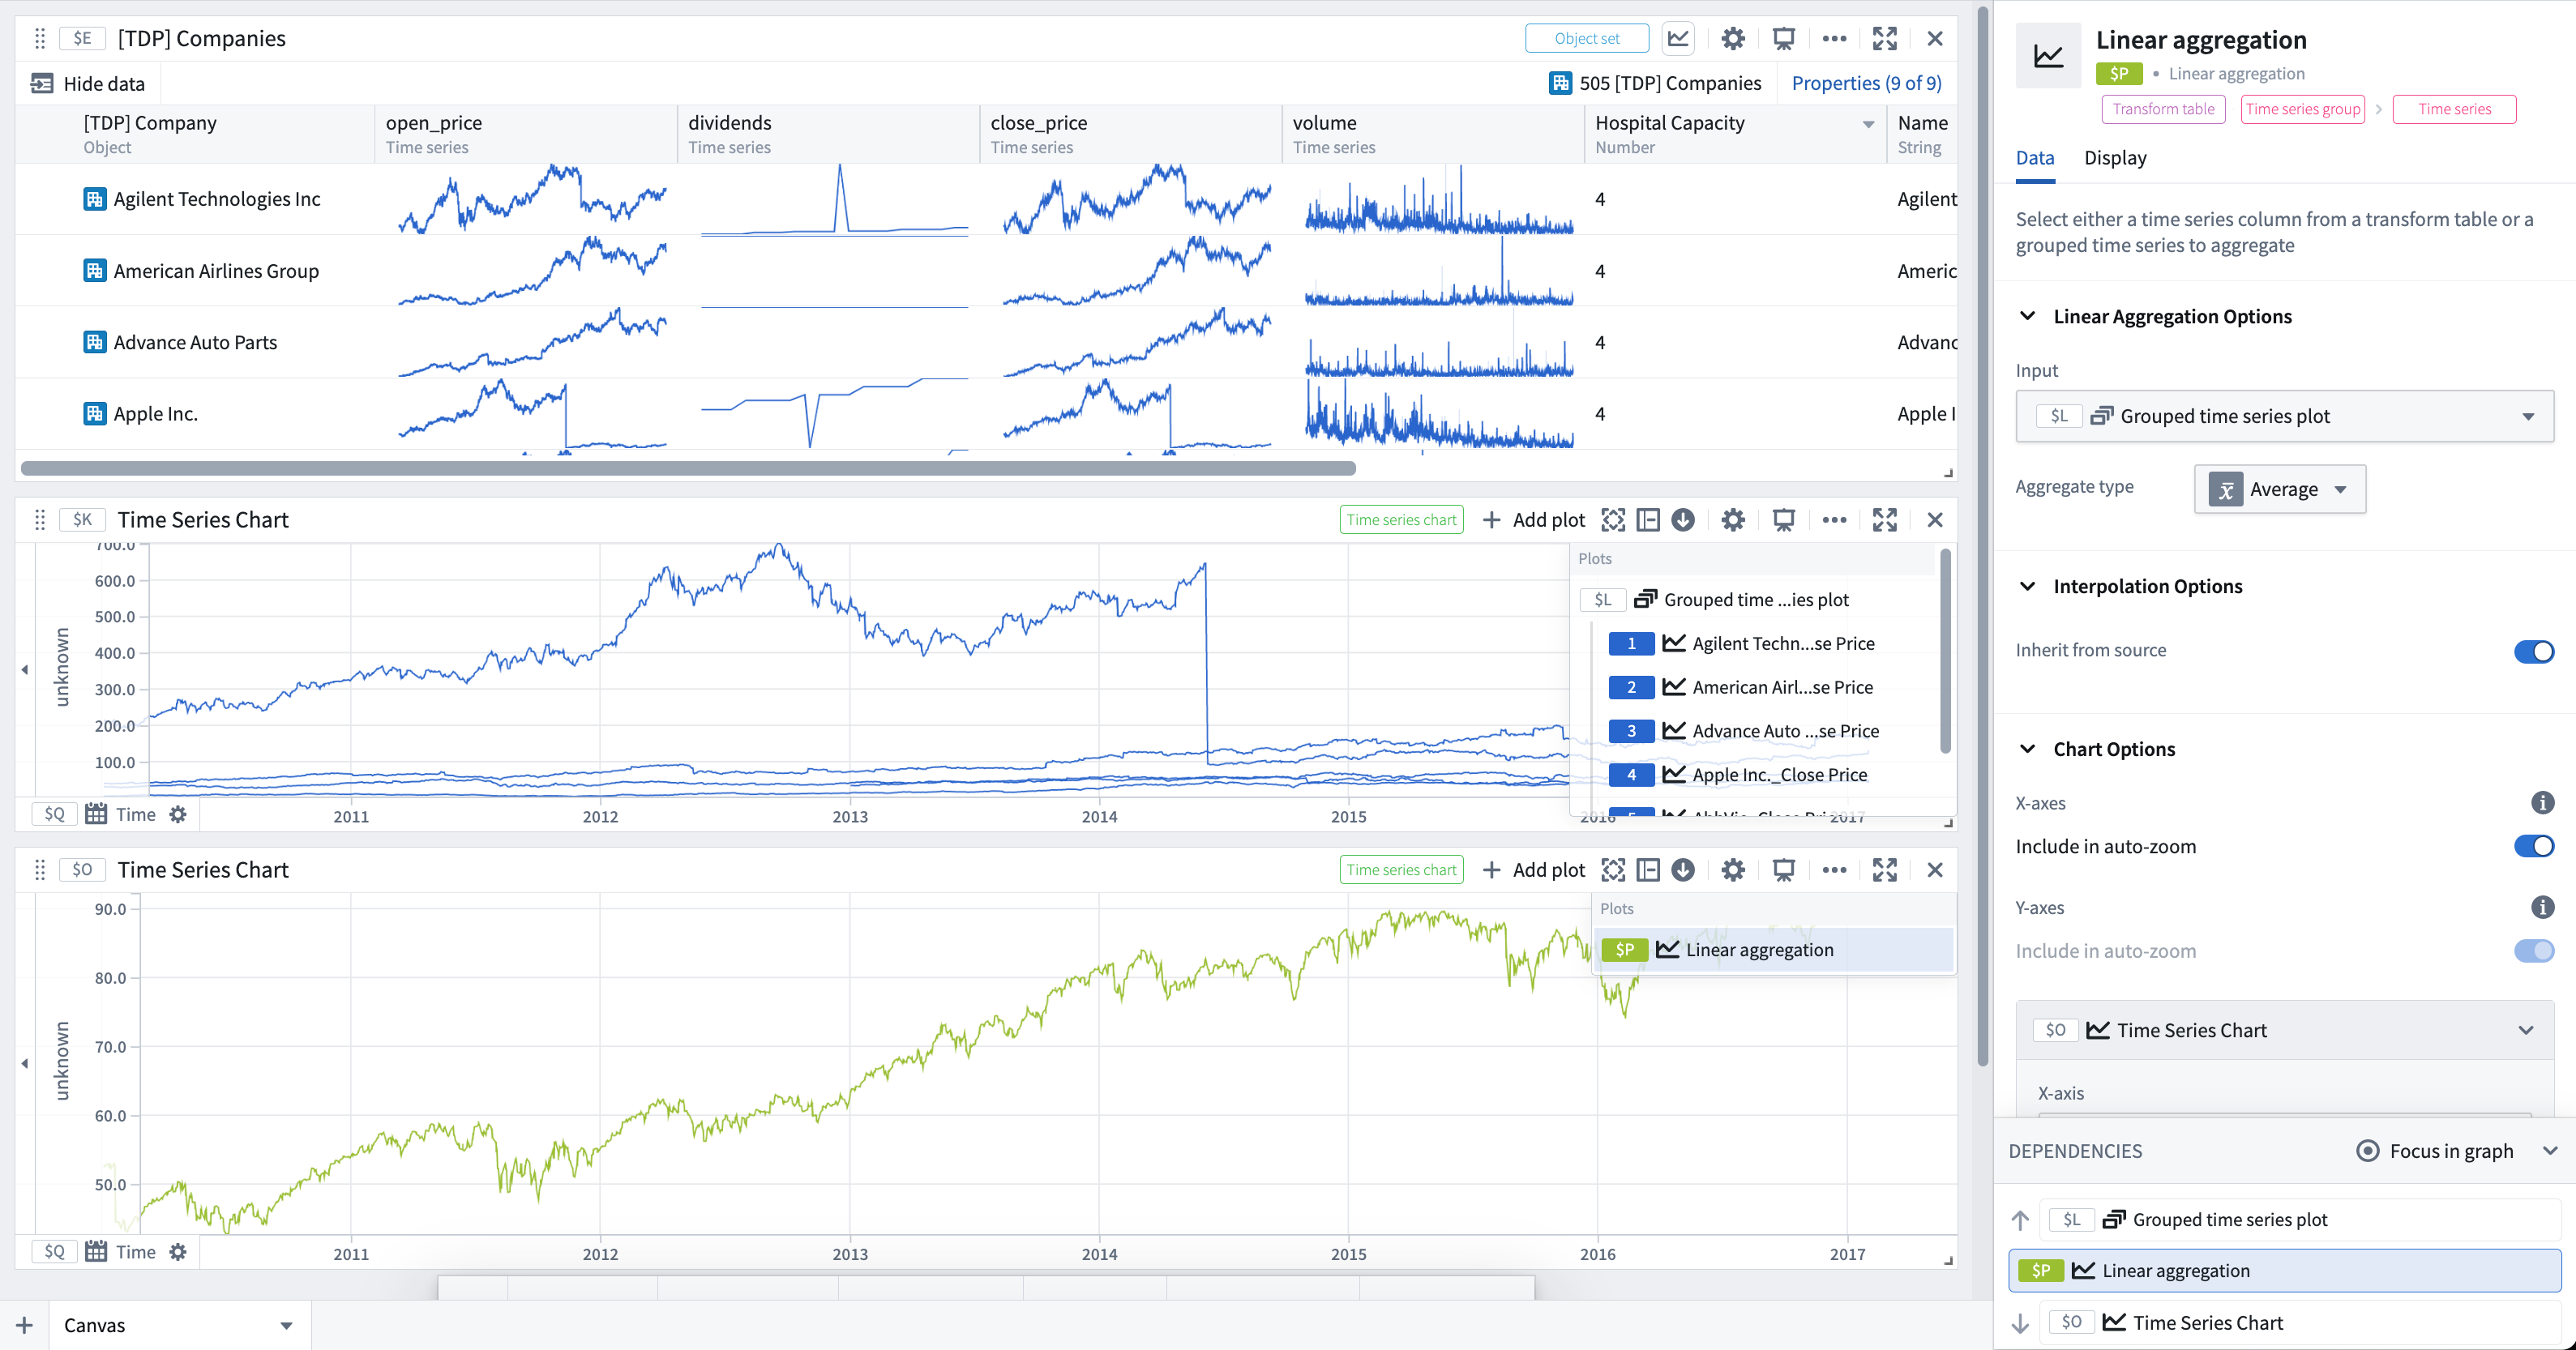
Linear aggregation
Takes multiple time series, either from a transform table column, a grouped time series plot, an object set with time series, or manual inputs, and computes a linear aggregation of the time series set over time. You can add a linear aggregation from the Next Actions menu by selecting Visualize > Linear aggregation. Note that while a rolling or periodic aggregate transforms aggregate over a single time series, the linear aggregation aggregates across multiple time series.
Learn more about how interpolation affects this operation.
For a comprehensive guide on batch time series analysis, including other aggregation approaches and visualization methods, see batch analyze time series.
Input type
Time series, time series group, or transform table
Output type
Time series
Examples
Usage information
| Functionality | Availability |
|---|---|
| Standard Quiver card | Supported |
| Transform table transform | Supported* |
* In the transform table, this transform is called "time series group linear aggregation", and must be performed on a time series group column (result of a group by transform).