- Capabilities
- Getting started
- Architecture center
- Platform updates
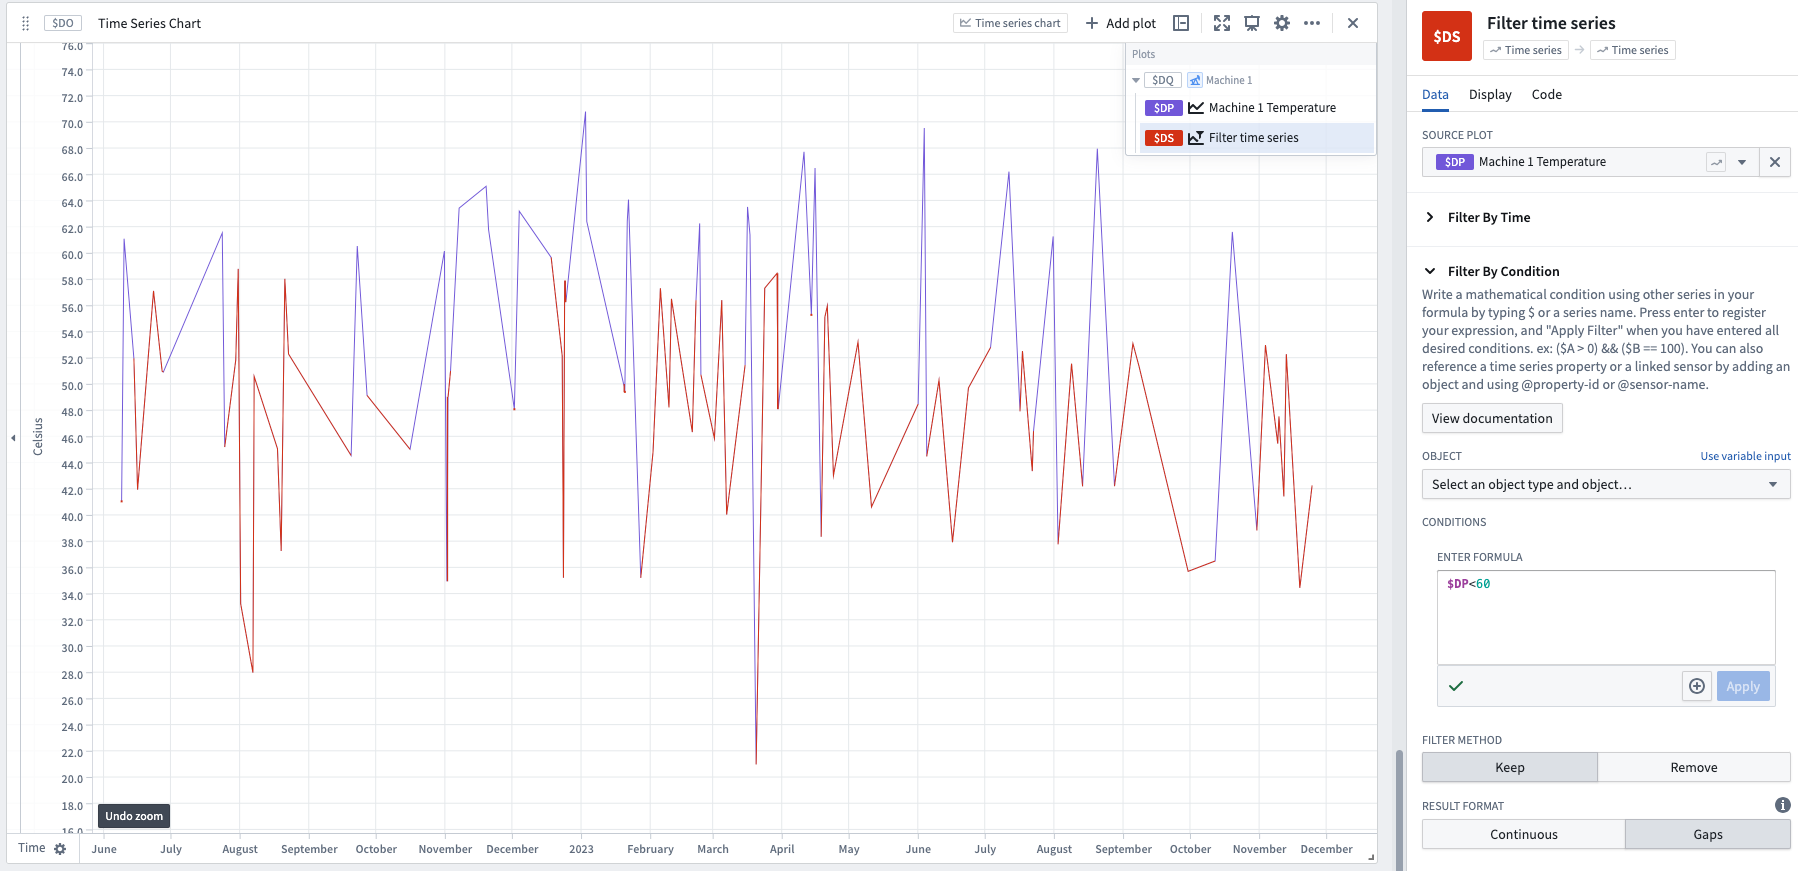
Filter time series
This filter allows you to keep or remove points in a time series based on a time range or mathematical conditions. The Filter By Time option filters data based on the timestamp of the data (the x-axis, in many cases), while the Filter By Condition filters based on the value of the data (the y-axis, in many cases). Only one of these sections needs to be filled out.
- To filter using an event set, use the event indicator series card to generate a series that represents the count of events. Then set the formula in the Filter By Condition option to filter to when your generated series is greater than zero.
- In the formula for the Filter By Condition option, we use the plot reference to refer to a specific series (
$A). This allows you to use multiple series in your filter condition ($A > 100 && $B < 50). We also use the '@' symbol to refer to any properties on the (optionally) selected object. - There is a parameter to control whether to keep or remove the data that matches your filter condition.
- There is a Filter Method parameter with two options: Gap and Continuous.
- If you choose Gap, data not matching your condition will be filtered out and will be shown as gaps in your series.
- With Continuous, Quiver will interpolate between the filtered values to produce a continuous series. Interpolation settings are controlled by the Interpolation Options dropdowns, with default Linear.
Learn more about how interpolation affects this operation.
Input type
Time series
Output type
Time series
Examples

Usage information
| Functionality | Availability |
|---|---|
| Standard Quiver card | Supported |
| Transform table transform | Supported |