- Capabilities
- Getting started
- Architecture center
- Platform updates
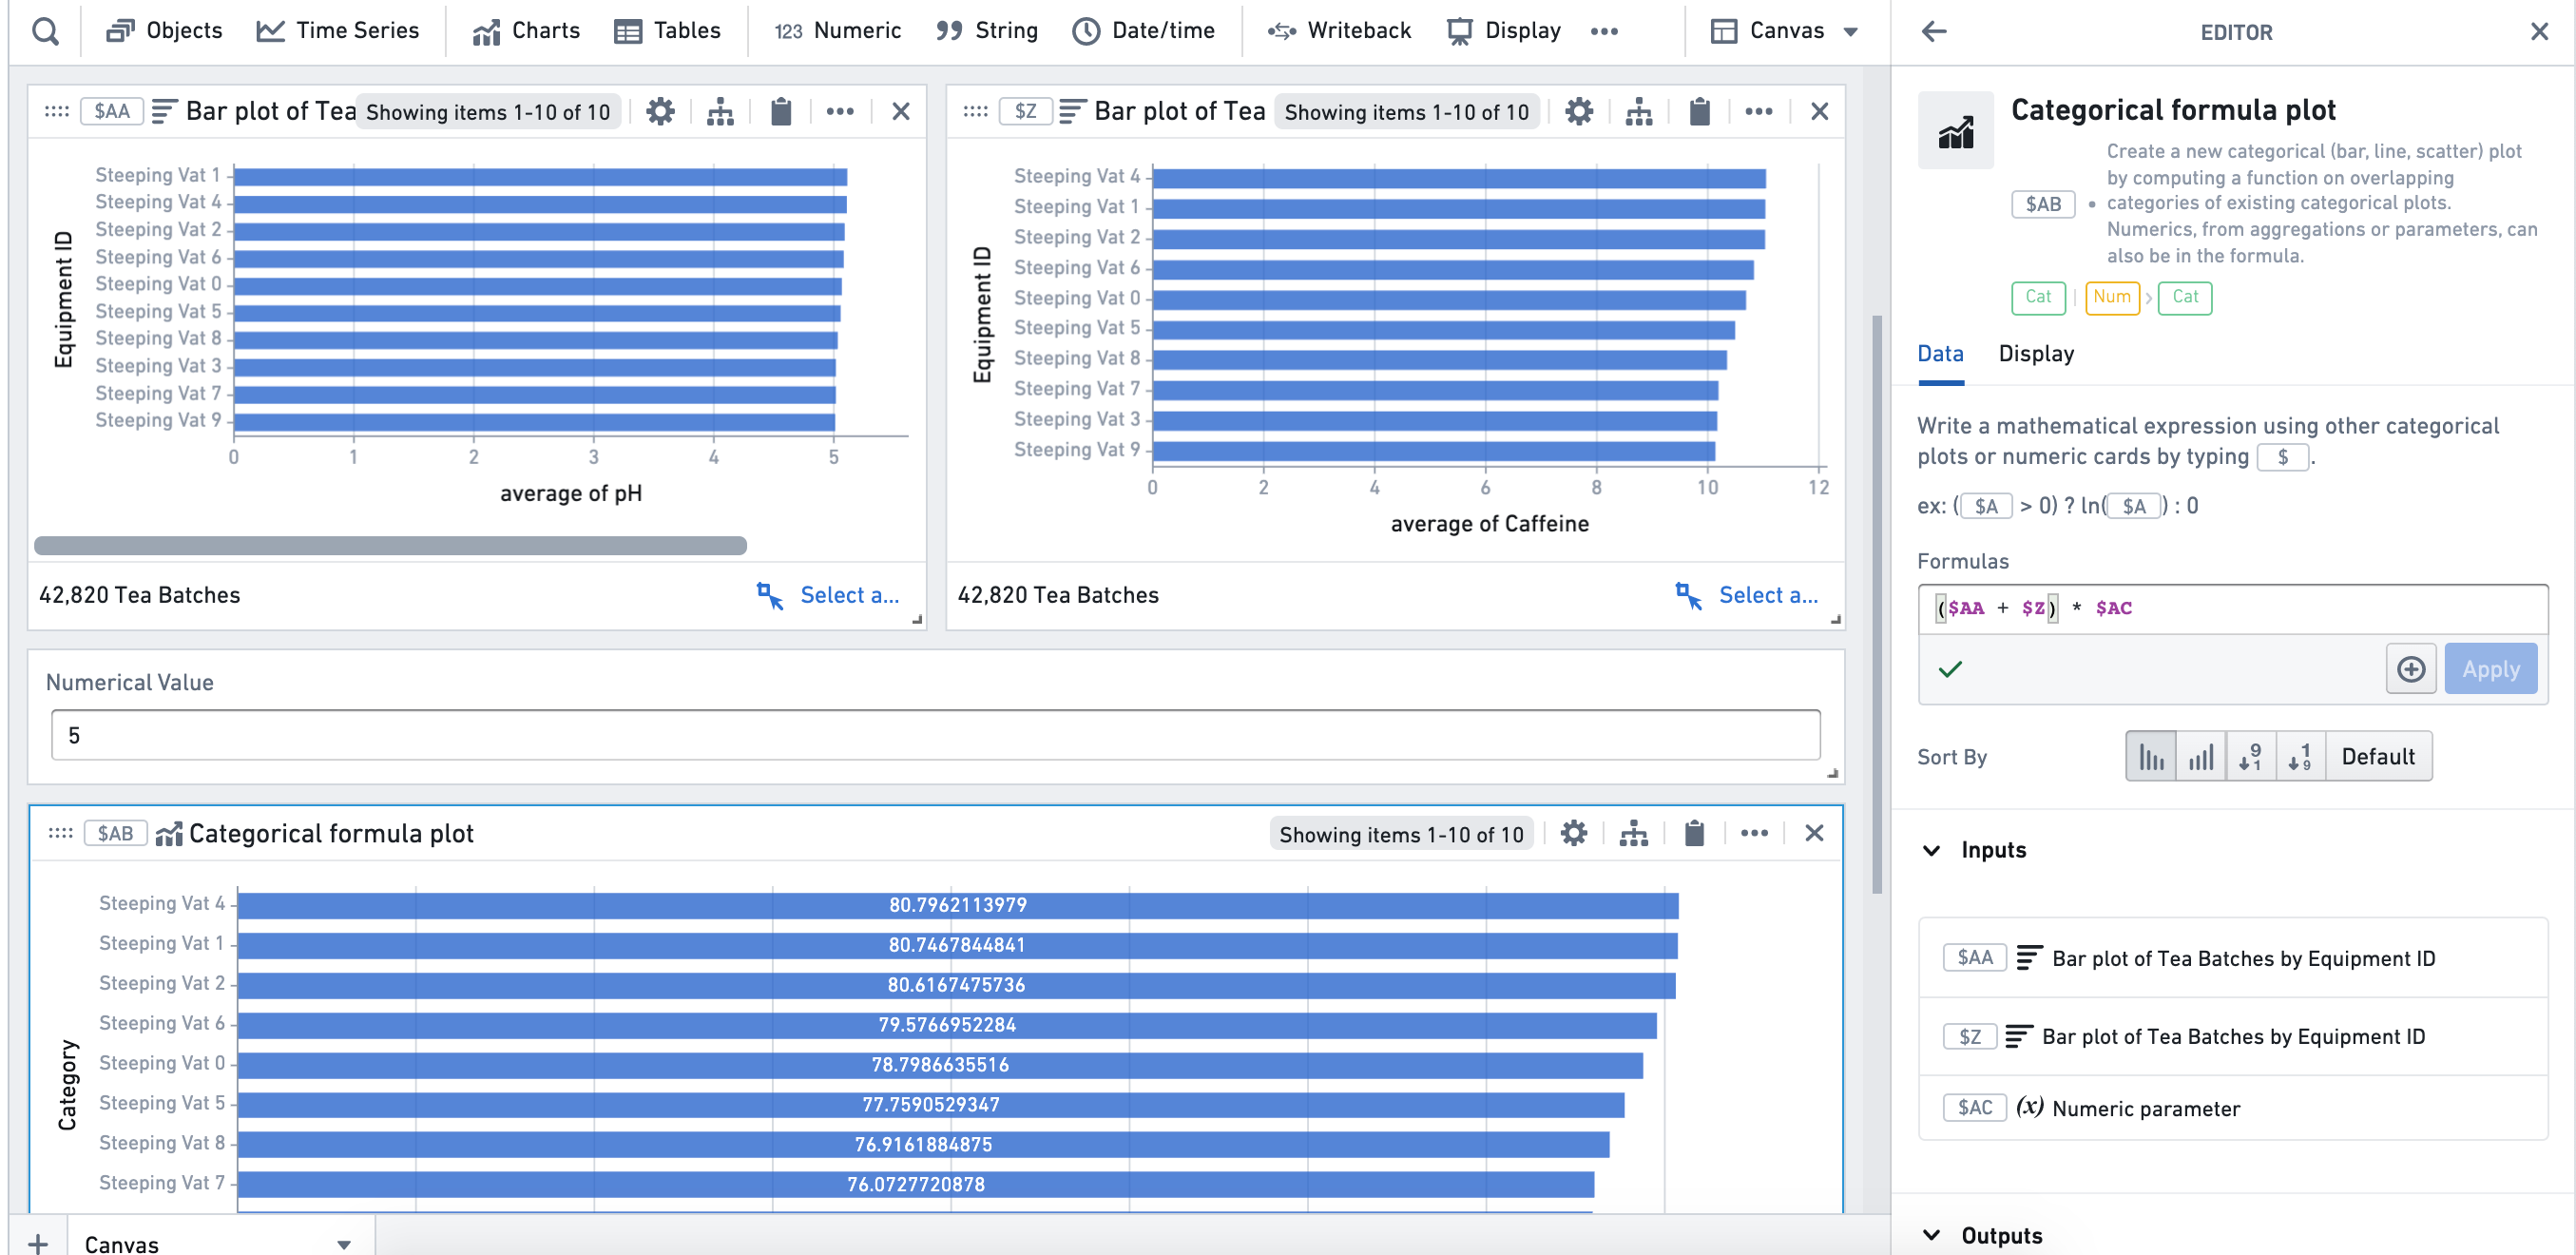
Categorical formula plot
Create a new categorical (bar, line, scatter) plot by computing a formula on overlapping categories of existing categorical plots. Numerics, from aggregations or parameters, can also be in the formula.
Input type
Categorical chart, number
Output type
Categorical chart, object selection
Examples
In the example below, we add two bar plots together and multiply by the value of a numeric parameter. When writing formulas here, computation between bar plots will be run on matching segments and group-by categories. Single numerical values will be applied to all bars.
Usage information
| Functionality | Availability |
|---|---|
| Standard Quiver card | Supported |
| Transform table transform | Unsupported |