- Capabilities
- Getting started
- Architecture center
- Platform updates
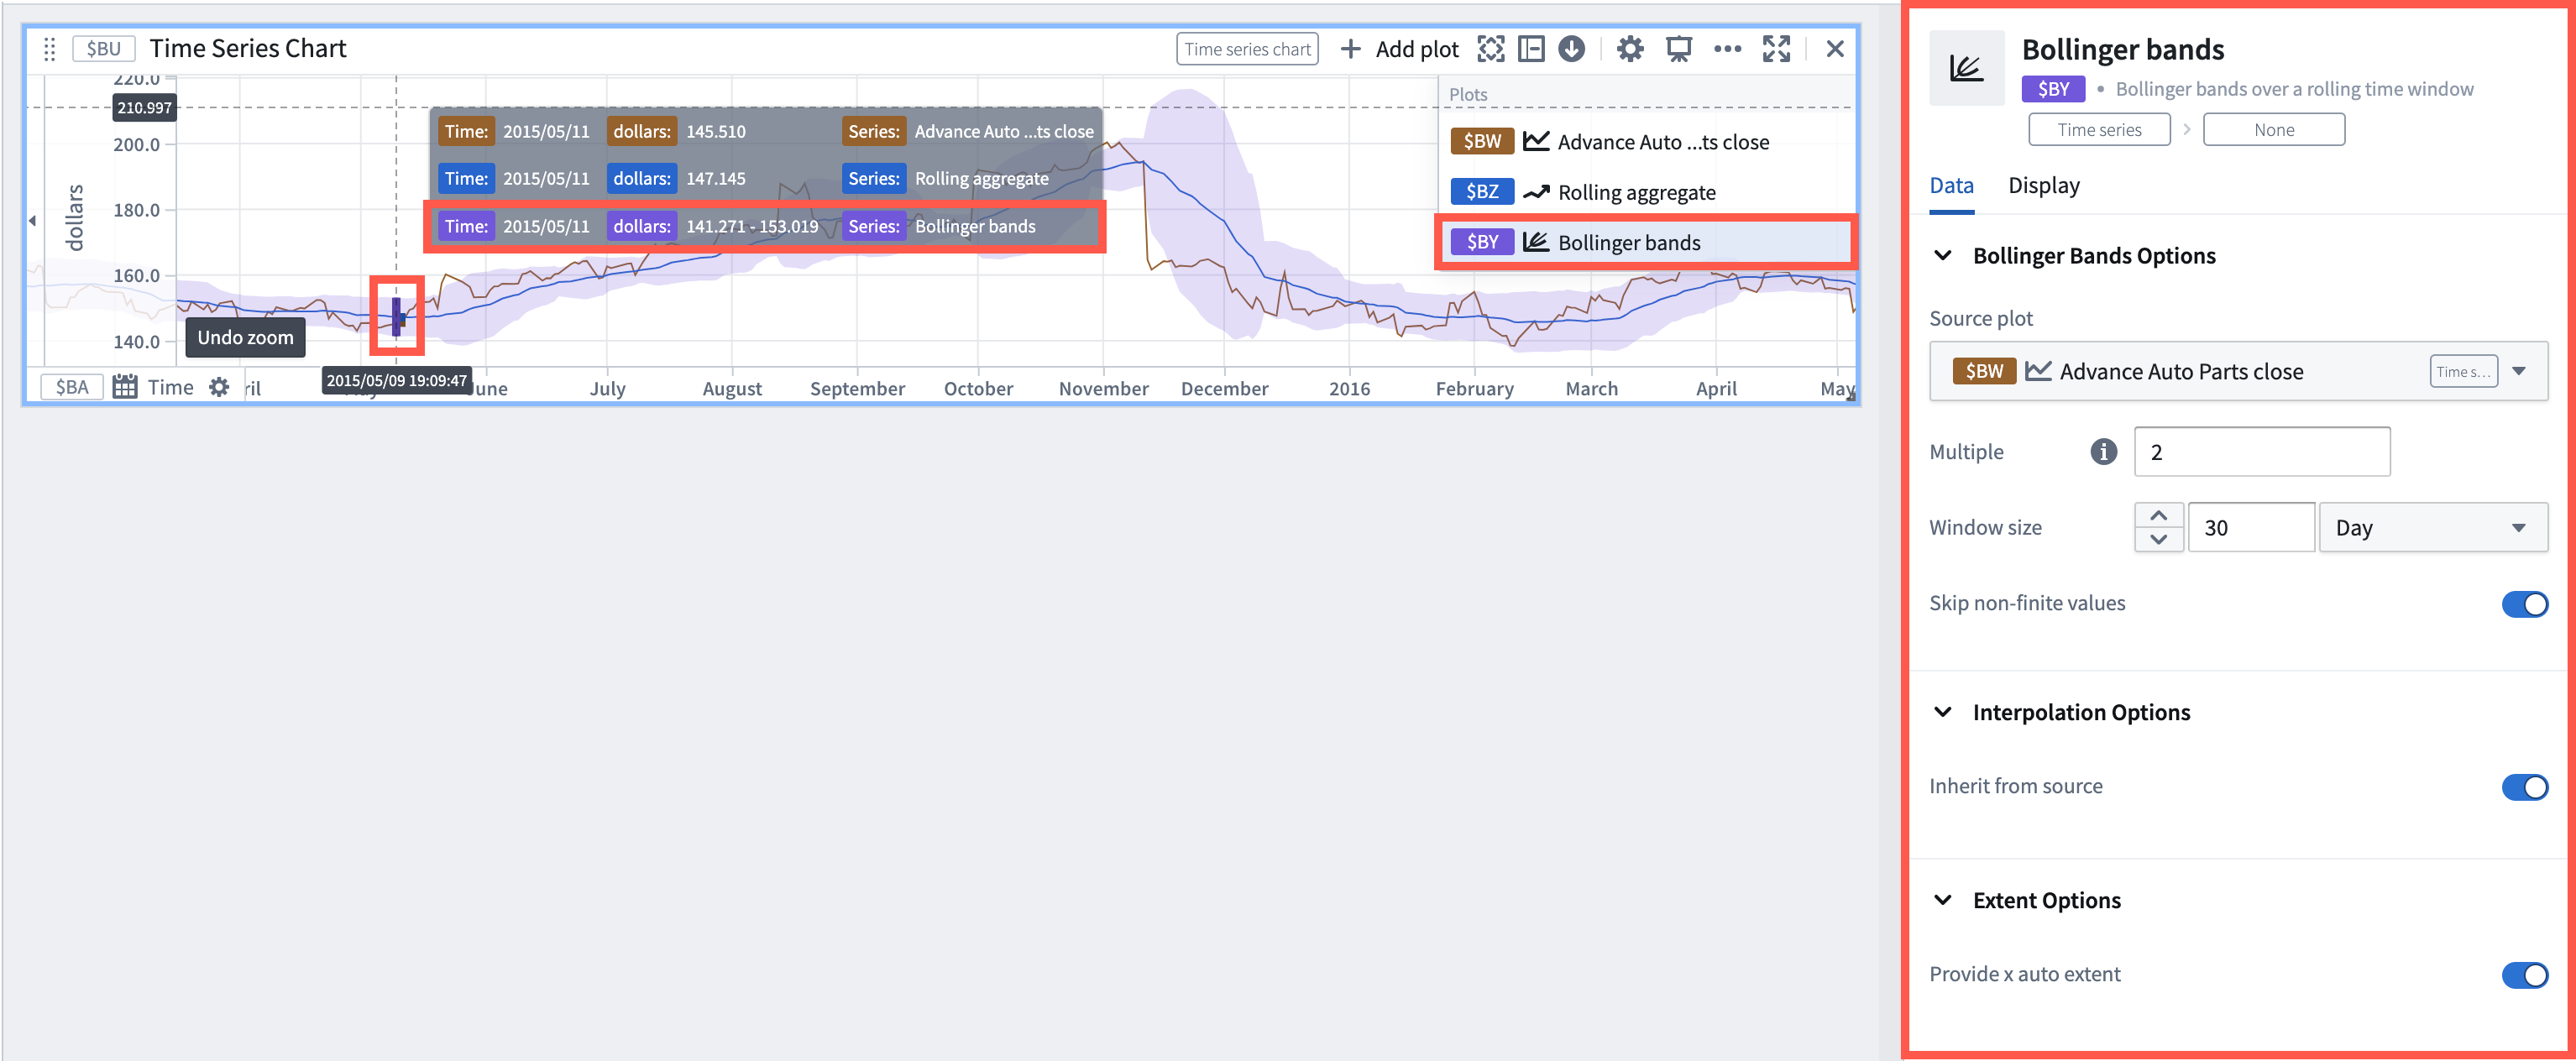
Bollinger bands
A Bollinger band plot is a type of technical analysis tool used by traders and investors to analyze and identify potential trends, price volatility, and market sentiment in financial markets. The plot consists of two bands plotted around a simple moving average (SMA) on a configurable rolling time window. These bands are:
- Upper Bollinger band: This band is plotted at a multiple of standard deviations (typically 2) above the moving average.
- Lower Bollinger band: This band is plotted at a multiple of standard deviations (typically 2) below the moving average.
As shown in the example below, these bands are usually plotted together with the moving average itself and they can be added separately using the rolling aggregate plot.
Bollinger bands are also called Statistical Process Control (SPC) or Statistical Quality Control (SQC) charts.
Input type
Time series
Output type
Bounded time series
Usage information
| Functionality | Availability |
|---|---|
| Standard Quiver card | Supported |
| Transform table transform | Unsupported |