- Capabilities
- Getting started
- Architecture center
- Platform updates
Analysis toolbars
Whether you are conducting your analysis in canvas mode or graph mode, you will have access to the same analysis workspace toolbars, consisting of the following components:
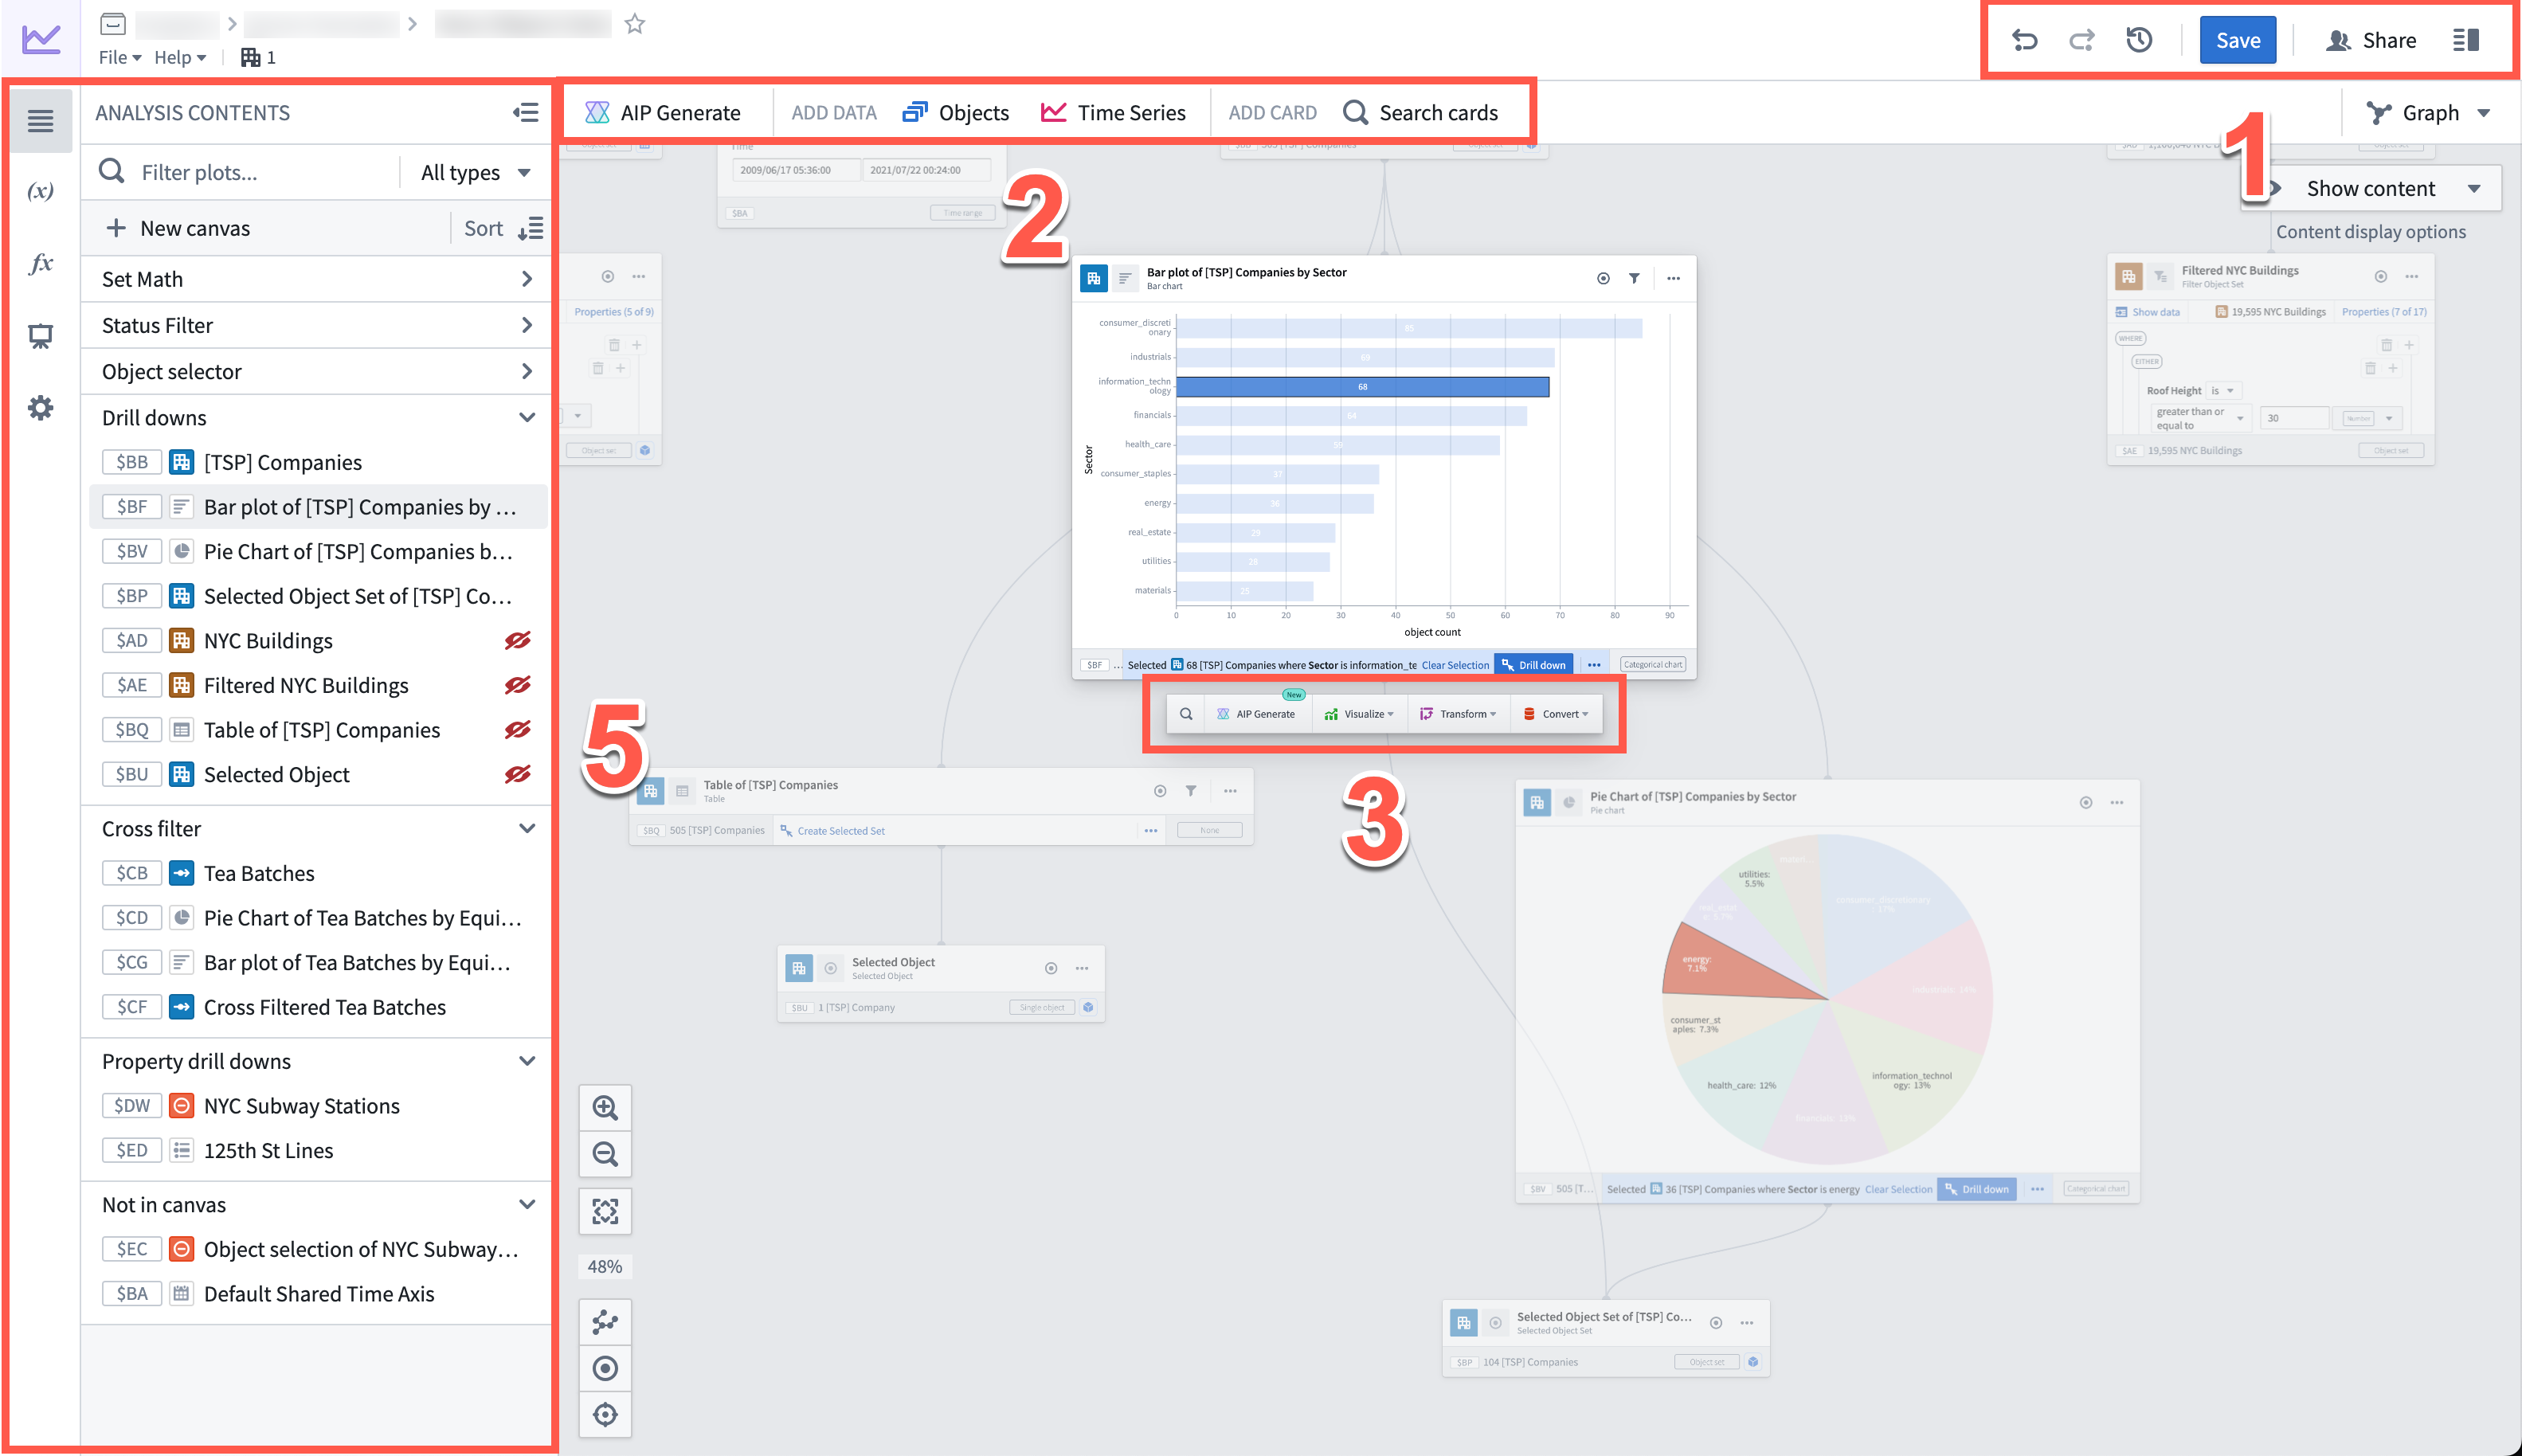
Analysis workspace header
Marked as 1 in the image, the analysis workspace header provides the following capabilities from left to right:
- Undo / Redo: These buttons allow you to undo or redo actions within your analysis.
- Analysis history (
 ): Access previous saved versions of your analysis or dashboard.
 - Save: Save your analysis.
- Share: Share your analysis.
- Details panel: To manage access, collaborators, and other analysis metadata.
Analysis top bar
Marked as 2 in the image above, the analysis top bar allows you to add data and add cards to your analysis.
- Data cards: Opens the search bar to add objects or time series to your analysis.
- Search cards: Opens the search bar, allowing you to search through and interact with all available cards.
Next actions menu
Marked as 3 in the image above and below, the next actions menu is a toolbar that appears when you hover over a card or a time series plot on the canvas or the graph. From the next actions menu, you can find and perform common actions related to the selected card. Actions are grouped by categories such as filtering, visualizing, calculating, joining, transforming, and converting data.
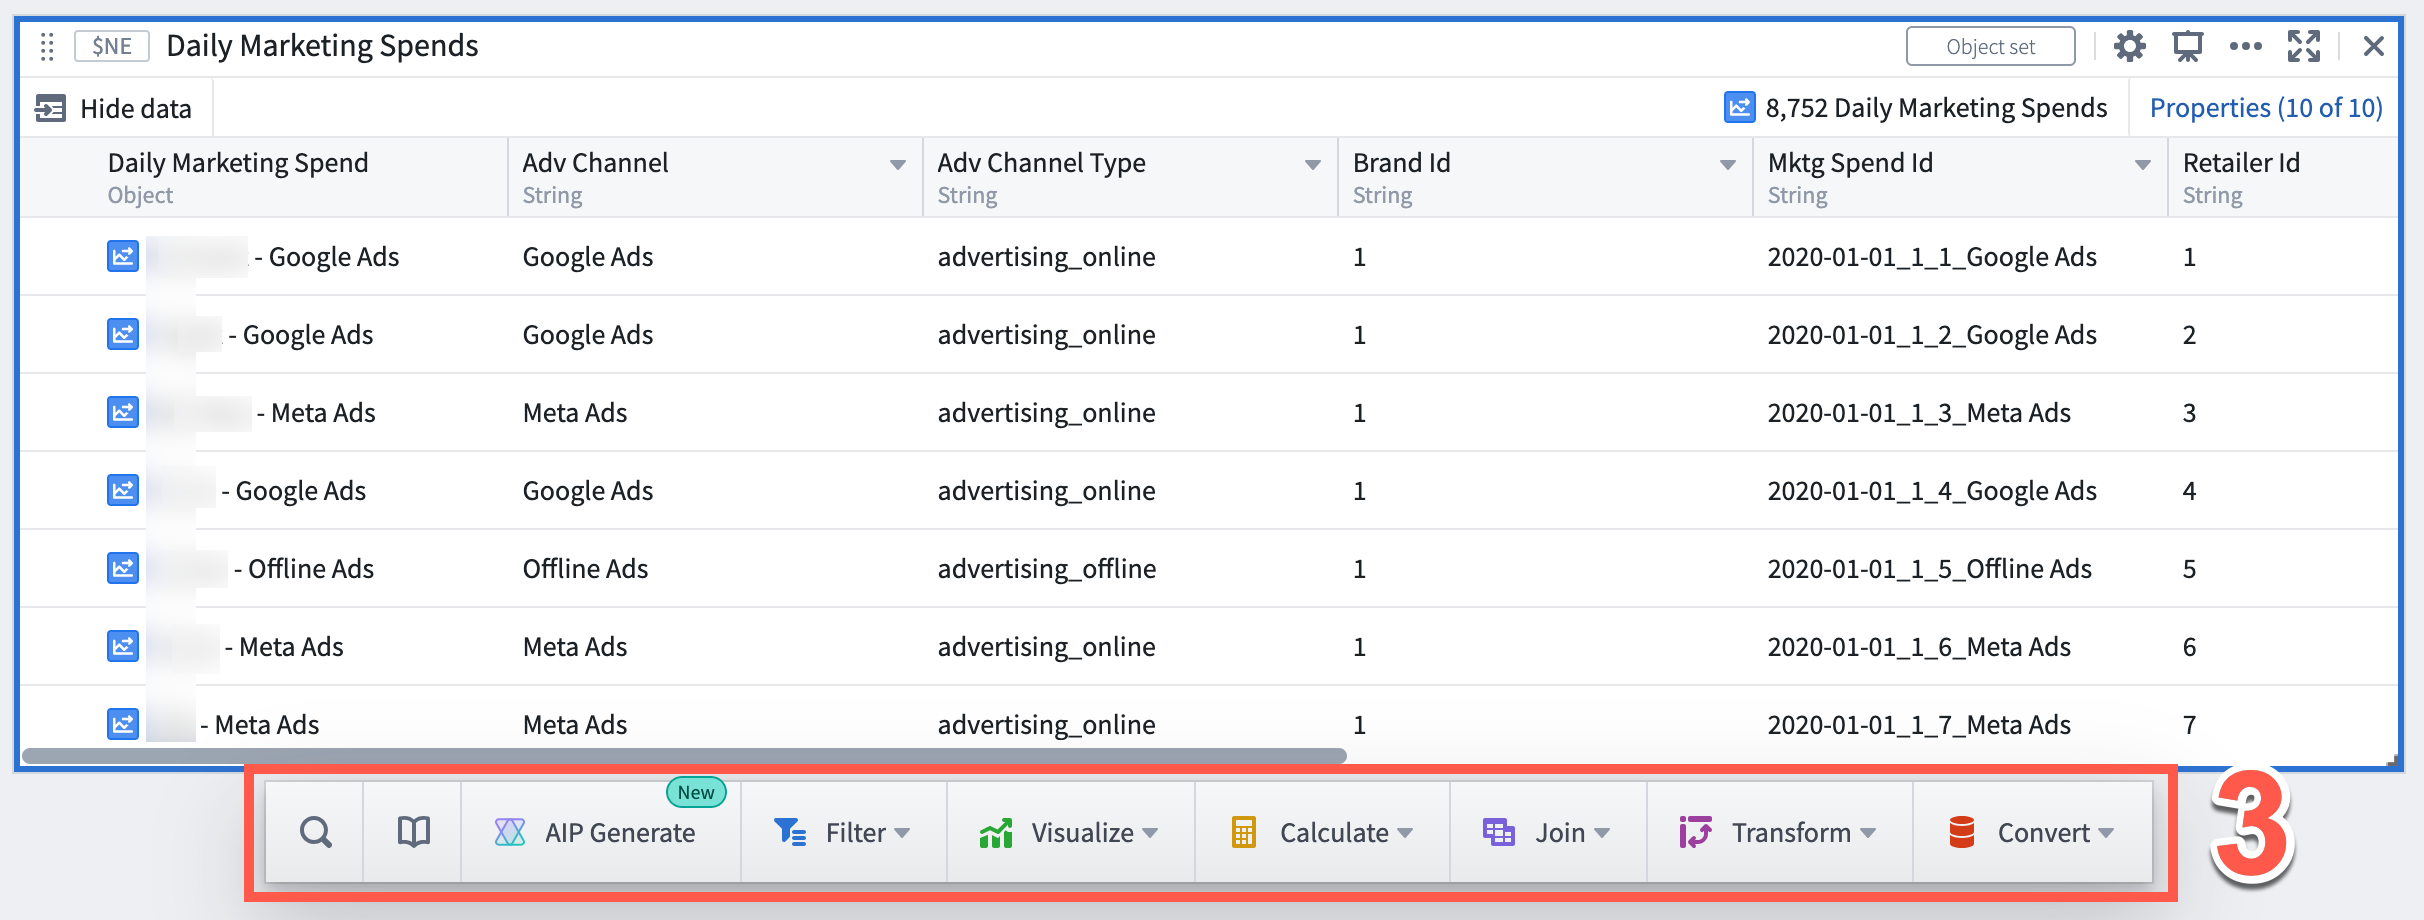
Note that the specific set of options in the next actions menu will vary depending on the output type of the selected card.
Search for actions across all categories or search within a specific category by using the search option ( ). Results will include matches from within the category and also highlight matches from other categories.
Available for object and object set cards, use the Library option ( ) to discover existing Foundry resources such as Ontology Actions and functions, published Quiver dashboards and Quiver visual functions that can take the selected object type as input. Selecting an artifact will add the relevant Quiver card preconfigured with that artifact as input. For example, when selecting an Ontology Action, a Quiver Action button will be added to the analysis preconfigured with the selected Action.
Open AIP Generate using the selected card as input to generate an analysis using natural language.
Search bar
Marked as 4 in the image below, the search bar provides a single point of access to all cards supported in Quiver.
Open the search bar by selecting any item on the analysis top bar. Alternatively, you can open the search bar by selecting:
- + Add data to analysis in an empty analysis.
- + Add data in an empty Analysis Contents panel.
- New card in the Analysis Contents panel (hovering on the canvas name).
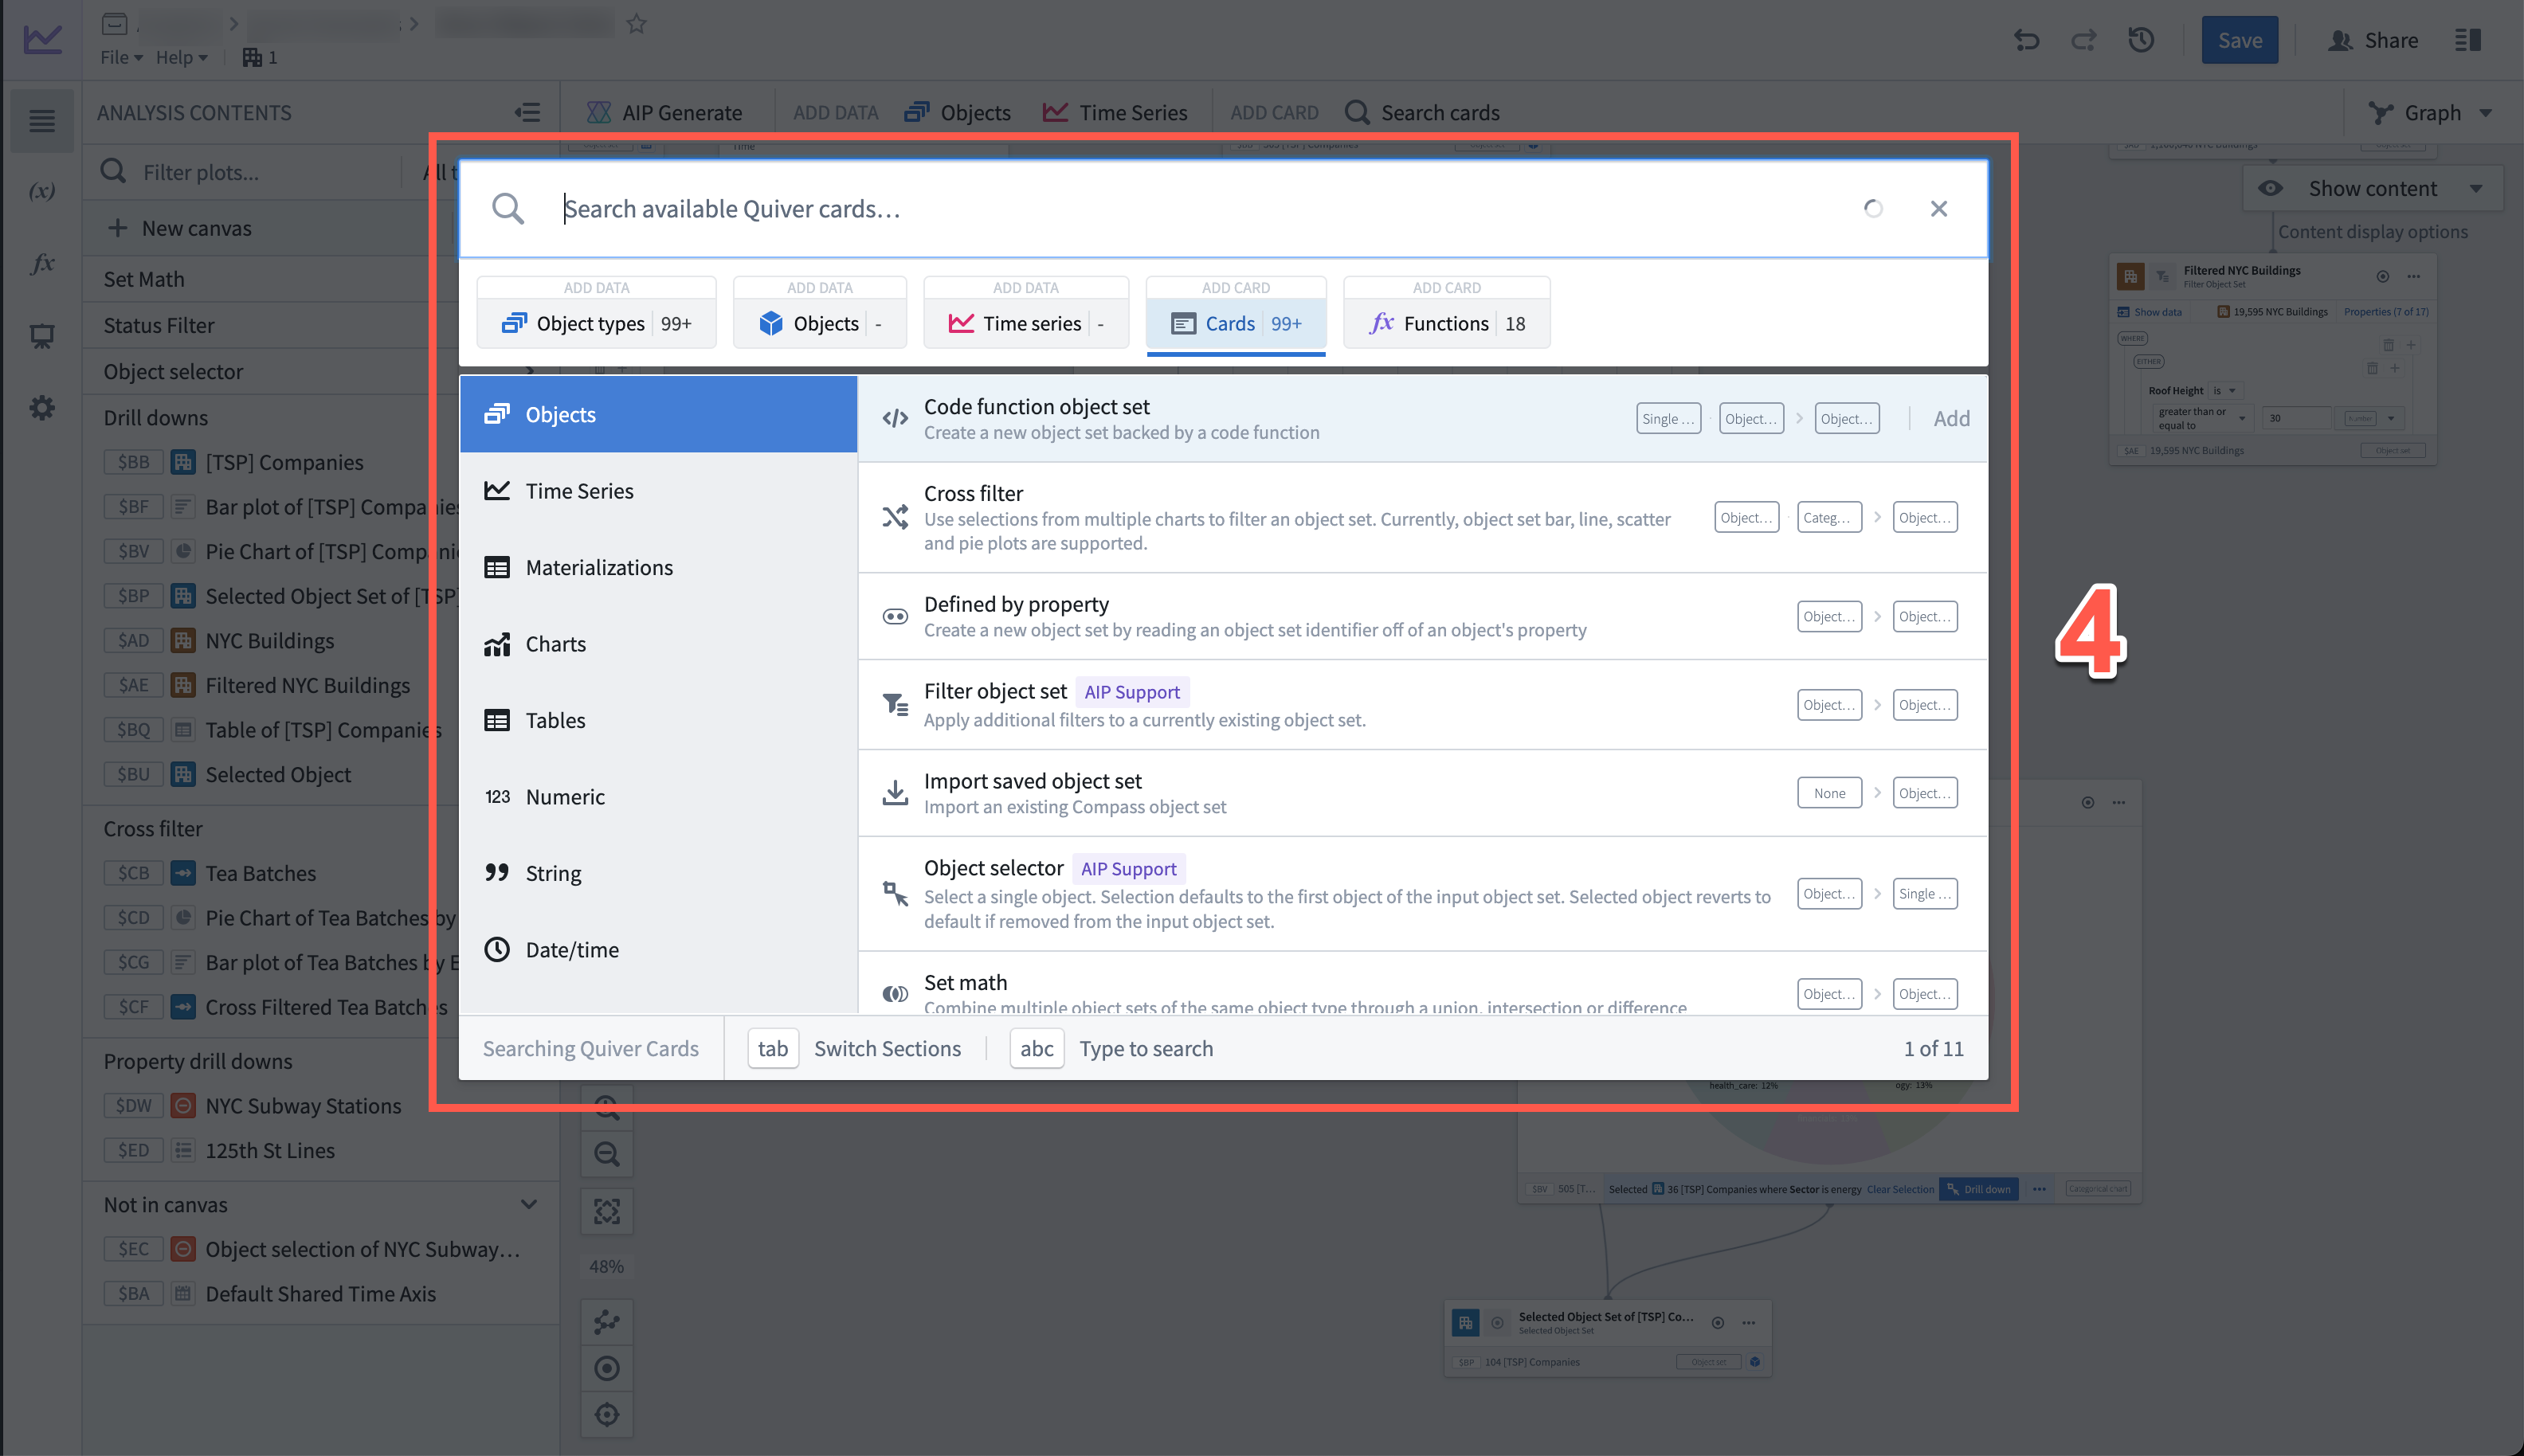
Cards are grouped in the following tabs:
- Object types: Add one or more object sets. This tab features a left-side menu that includes all objects that have configured time series and the Ontology groups configured in your Ontology.
- Objects: Add one or more specific objects. This tab features a left-side menu with the available object types.
- Time series: Add one or more time series objects. This tab features a left-side menu with the available object configured with time series properties.
- Cards: Add one of the cards to interact with data. This tab features a left-side menu to categorize cards according to the analytical objective of each. The data type labels can help you identify the inputs and outputs supported by each card.
- Functions: Search through all available Functions and add them, split by functions for time series and those for objects.
Side panels
Marked as 5 in the image at the top of the page, select one of the icons on the left side to open the side panels. There are five side panels:
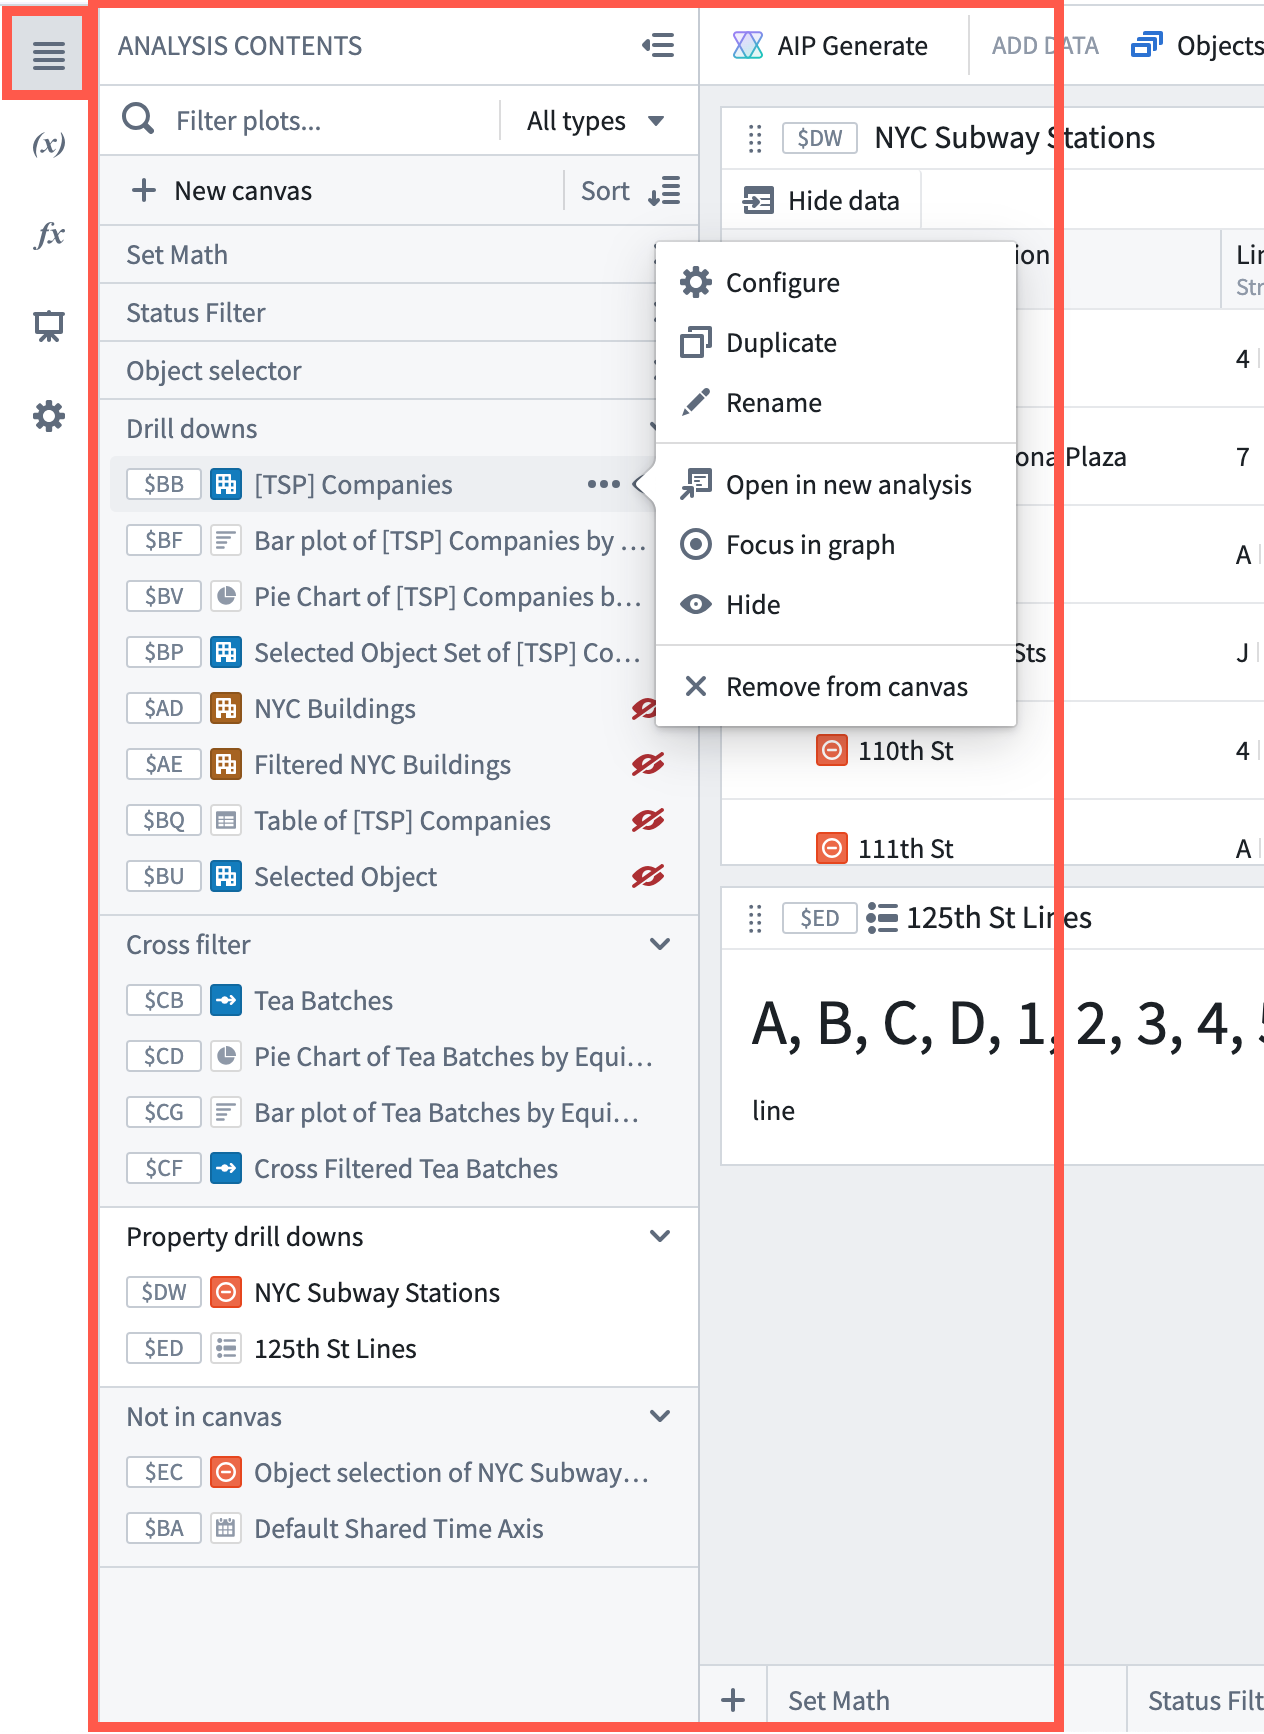
Analysis Contents panel
The Analysis Contents panel allows you to organize your analysis. Every card is listed in the order it appears on the canvas. There are several functions that can be completed directly in the Analysis Contents panel, including:
-
Find and organize content
- Search for specific cards by typing their global ID or title
- Filter by text and data type
- Drag and drop content to rearrange order on the canvas and move between canvases
-
Card actions
- Configure: Open the editor to configure a card
- Duplicate: Creates a copy of the card in the same analysis
- Rename: Edit the card title
- Open in new analysis: Duplicate the card along with its upstream dependencies to a new analysis
- Focus in graph: Switch to graph mode in focus mode
- Hide: Hide a card from the canvas
- Remove from canvas: Remove the card from the canvas, with the card remaining in the panel under the Not in canvas section if the removed card have dependencies.
Card actions can be found by selecting the More actions icon ( ) that appears when hovering over a card in the list.
Parameters panel
More information about the Parameters panel can be found in the documentation on how to parameterize an analysis.
Visual Functions panel
More information about the Visual Functions panel can be found in the documentation on how to use visual functions.
Dashboards panel
More information about the Dashboards panel can be found in the documentation on how to use dashboards.
Settings panel
More information about the Settings panel can be found in the documentation on how to change the analysis settings.