Data model
Card input and output types
A Quiver analysis is constructed through a number of cards that can depend on each other, forming an analysis graph. Every card in Quiver can take zero or more inputs and produces an output of a specific type.
For example:
- A numeric aggregation card takes an
object setas input and produces anumberas output. - A rolling aggregate plot takes a
time seriesas input and produces atime seriesas output. - A number to date card takes a
numberas input and produces atimeas output.
View the full list of input/output types.
A card can only be added as an input to another card if that card's output type is equal to the downstream card's input type. Sometimes, a conversion card must be added between two cards if their input/output types do not match.
For example, a filter object set cannot be directly passed as input to an object property because the filter object set produces an object set as output, and an object property takes a single object as input. To resolve this, an object selector must be placed in between the two cards, as the object selector takes an object set as input and produces a single object as output.
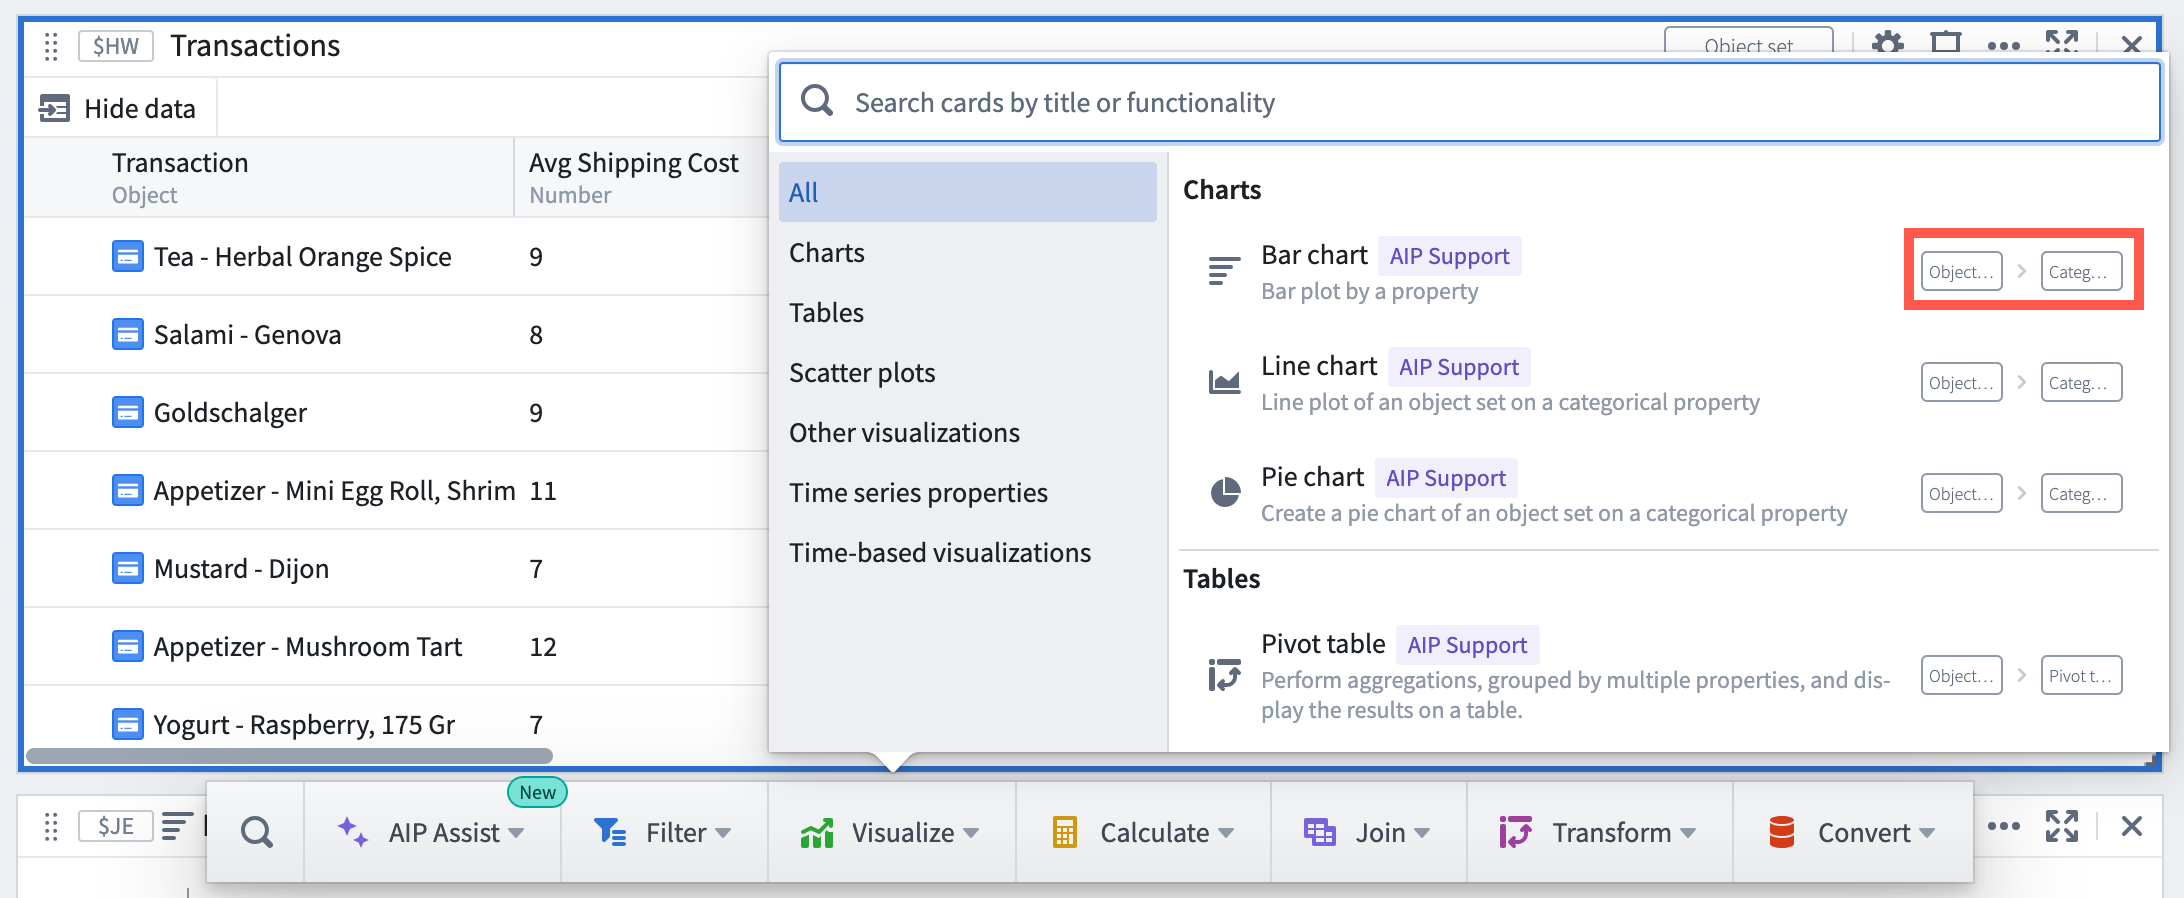
Understanding a card's output type, and which downstream cards it can be used in is a very important concept in Quiver. Fortunately, Quiver's next actions menu, which is shown when hovering over a card, helps simplify this problem. It only shows cards that are able to take your current card's output type as input. The type being used by the next action menu is shown in the top right of the menu.

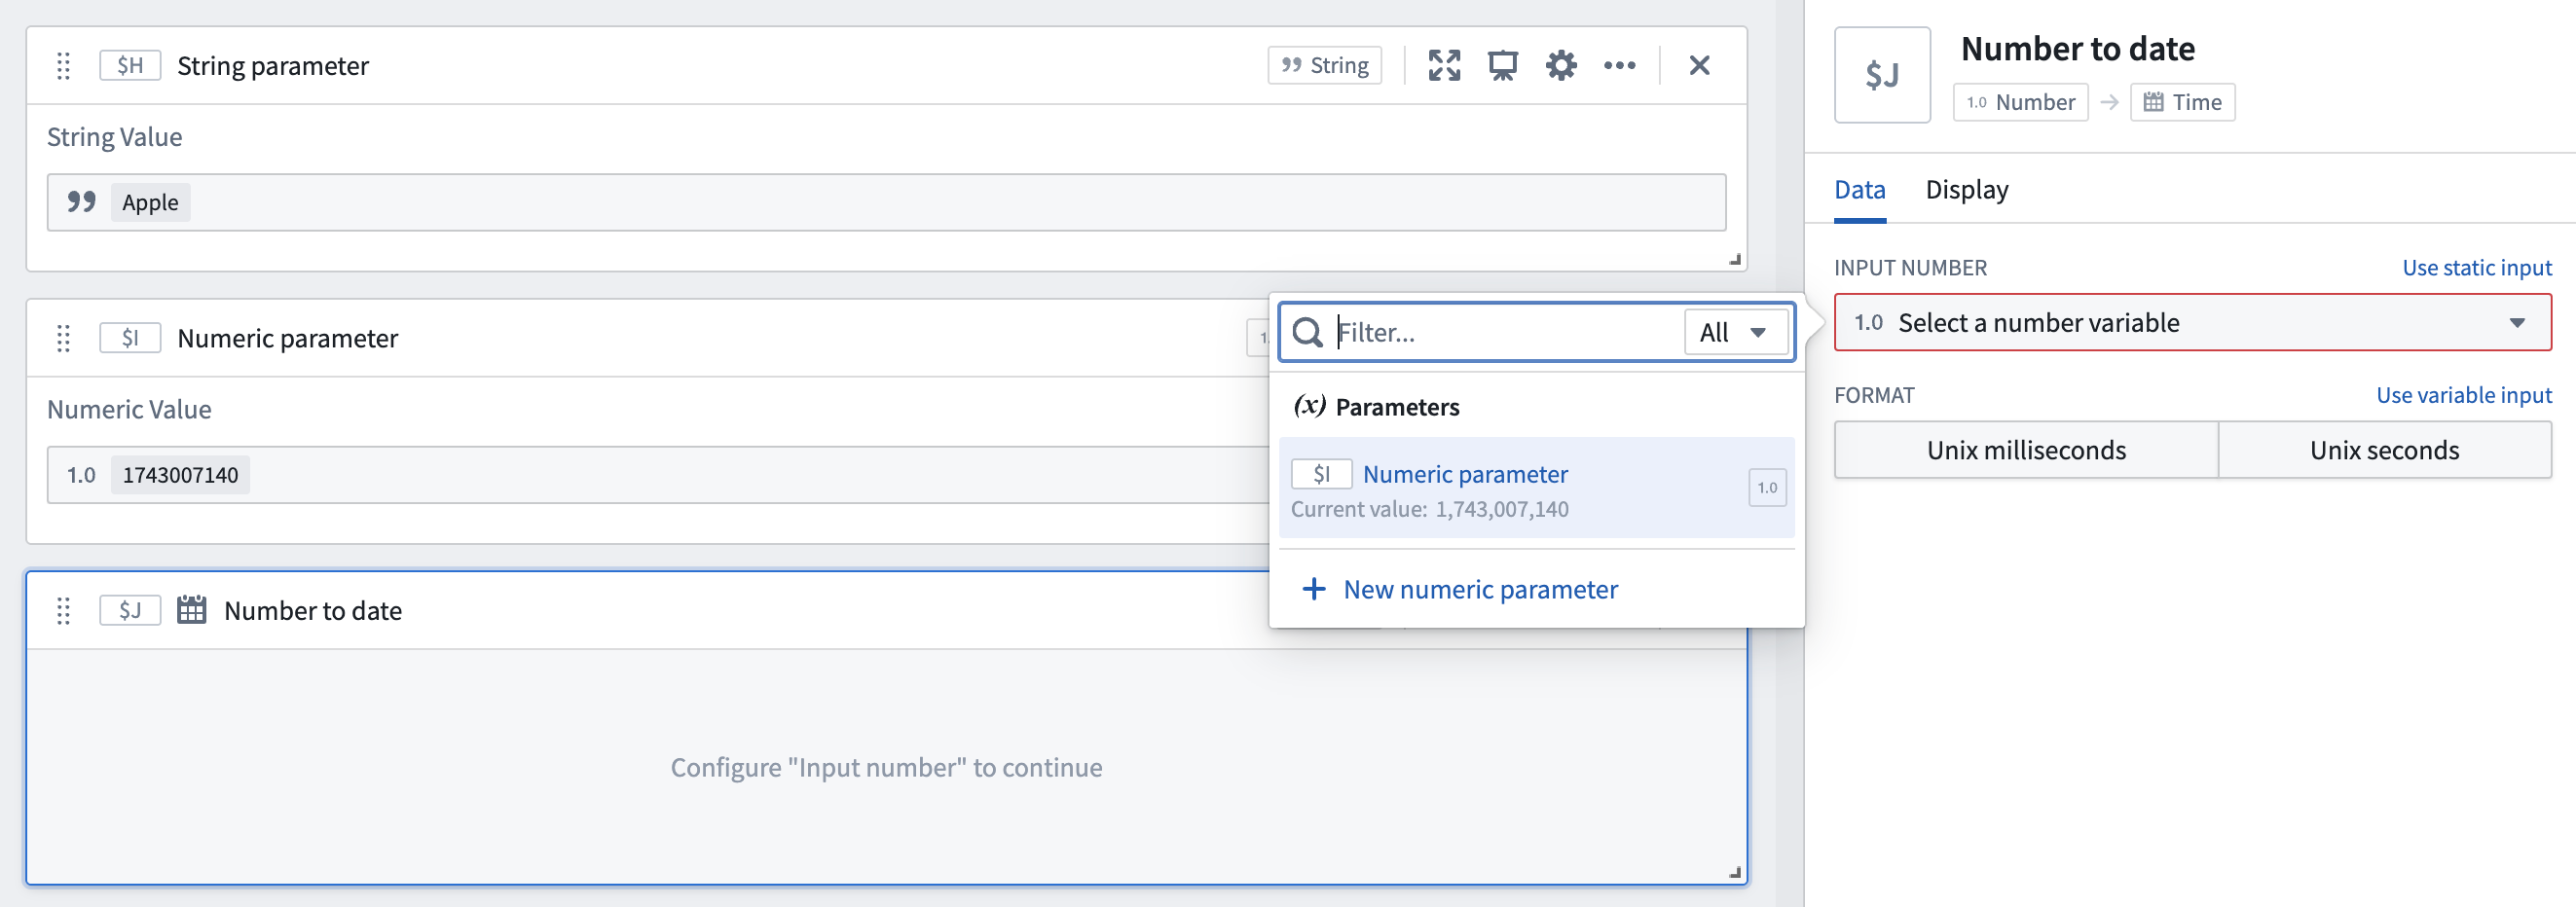
Additionally, When configuring variable inputs for a Quiver card in the editor, only cards with compatible output types are shown for selection. For example, in the image below, when configuring the input number for a number to date card, we are able to select the numeric parameter as input ($I), but not the string parameter ($H).

List of input and output types
The full list of Quiver supported input and output types is provided below.
| Type | Description |
|---|---|
| Object set | A set of objects backed by the Ontology. Useful for simple, responsive analysis at medium scale. |
| Single object | A single object in the Ontology. |
| Categorical chart | A chart consisting of (string, number) or (string, string, number) values. |
| Object selection | A card that supports selecting objects through interaction. |
| Pivot table | Tabular data resulting from a pivot table aggregation. |
| Transform table | A local table used for flexible, low scale analysis. Can be used to transform, edit, or convert between different data types. |
| Materialization | A dataset-backed materialization of objects used for flexible, high scale analysis. |
| Time series | A time series consisting of (value, timestamp) "ticks". Useful for high frequency, time-based analysis. |
| Time series chart | An interactive, time-based chart that can visualize time series, time ranges, event sets, and points in time. |
| Time series group | A group of time series that can be visualized or transformed together. |
| Bounded time series | A region bounded by an upper time series and a lower time series. |
| Event set | A set of events with start and end times. |
| Time scatter plot | Data returned from a time series scatter plot. |
| String | A single string value. |
| Number | A single numeric value. |
| Time | A single date/time value. |
| Boolean | A single boolean value. |
| Duration unit | A unit of time (millisecond, second, minute, hour, day, week). |
| String array | An array of string values. |
| Number array | An array of numeric values. |
| Time array | An array of date/time values. |
| Boolean array | An array of boolean values. |
| Numeric range | A range consisting of a starting numeric value and an ending numeric value. |
| Time range | A range consisting of a starting date/time value and an ending date/time value. |
| X/Y range | A set of two ranges, used to create a "box" on a chart. |
| Flow start | Indicator that a card does not take any inputs. |
| Flow end | Indicator that a card does not produce an output type. |
View input and output type information
The possible input types and the returned output type for each card are annotated as input_types to output_types next to each operation in the next actions menu.

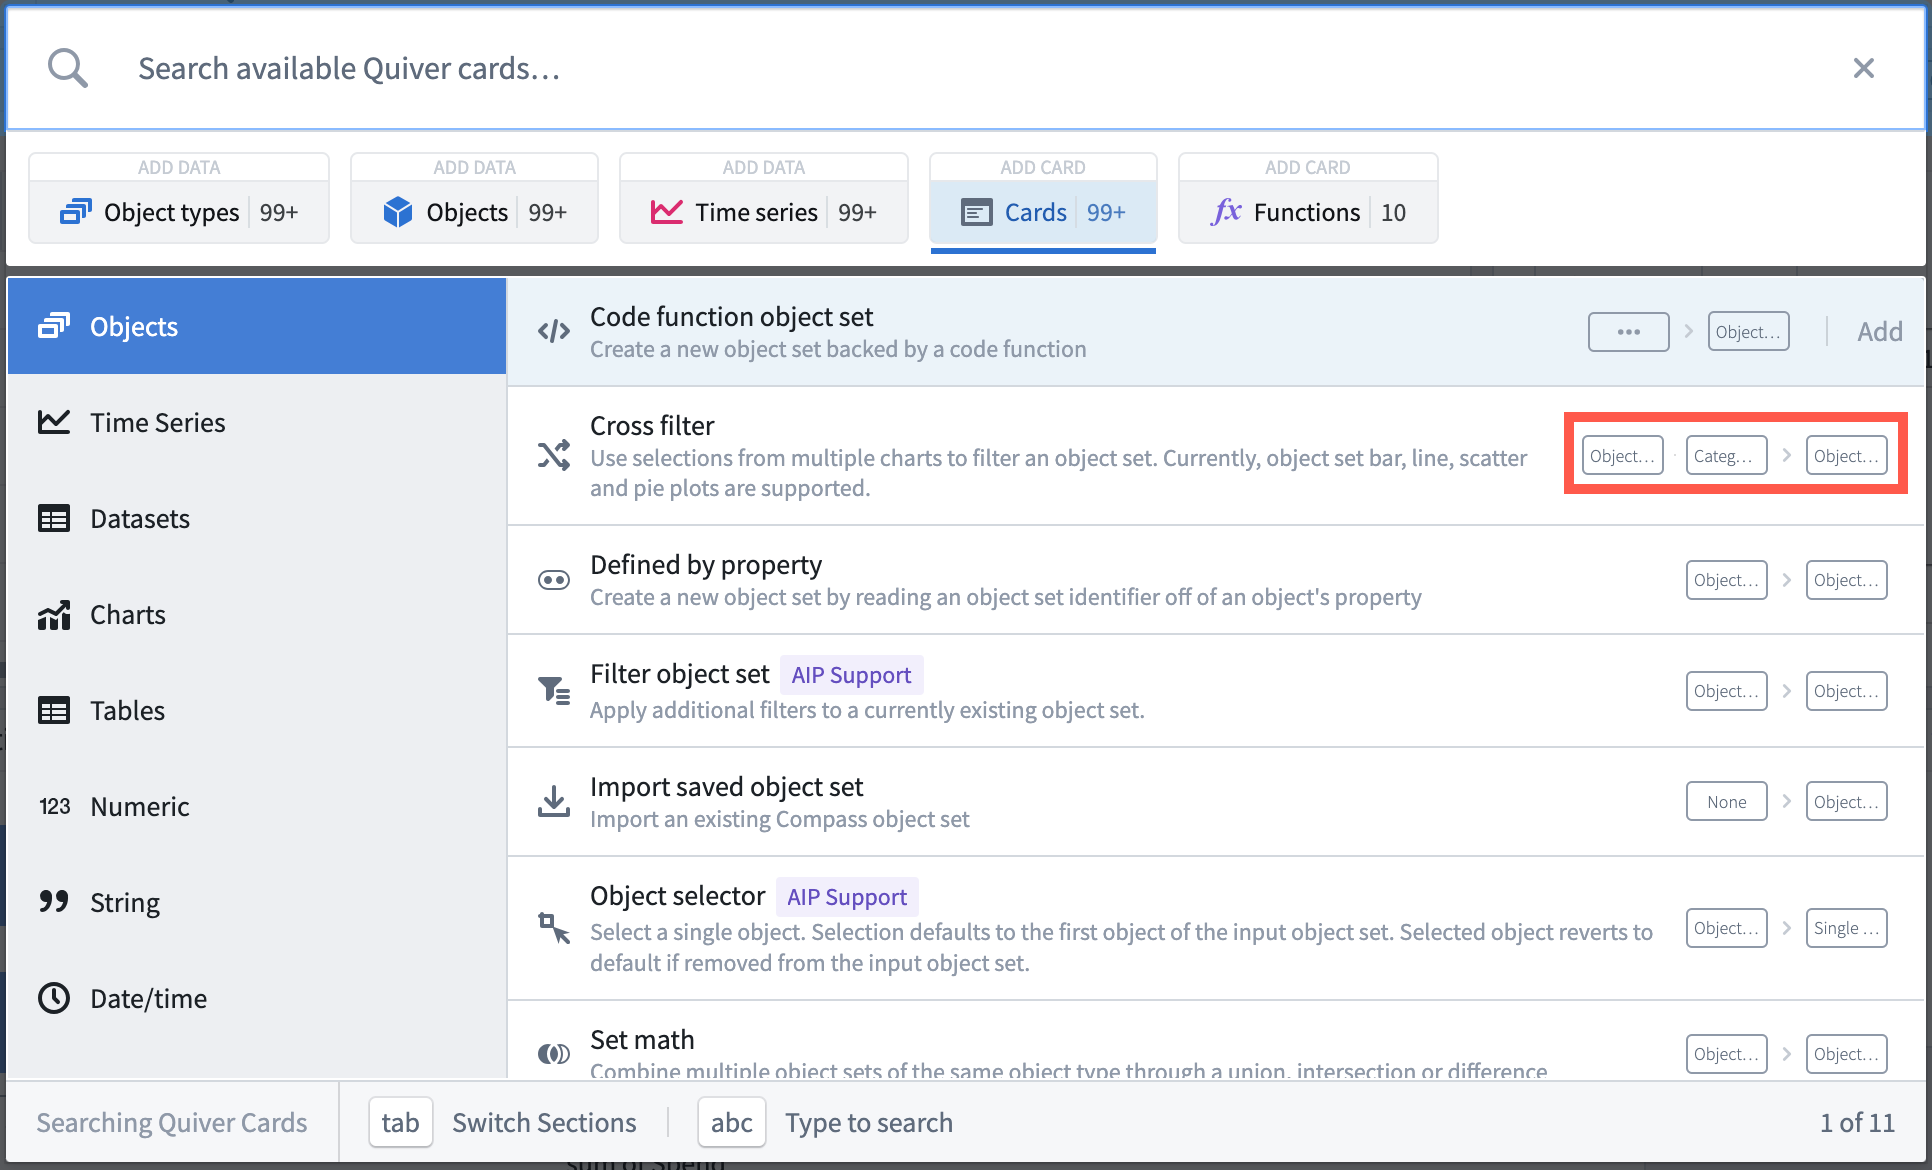
The same input_types to output_types annotation is also used in the cards search window:

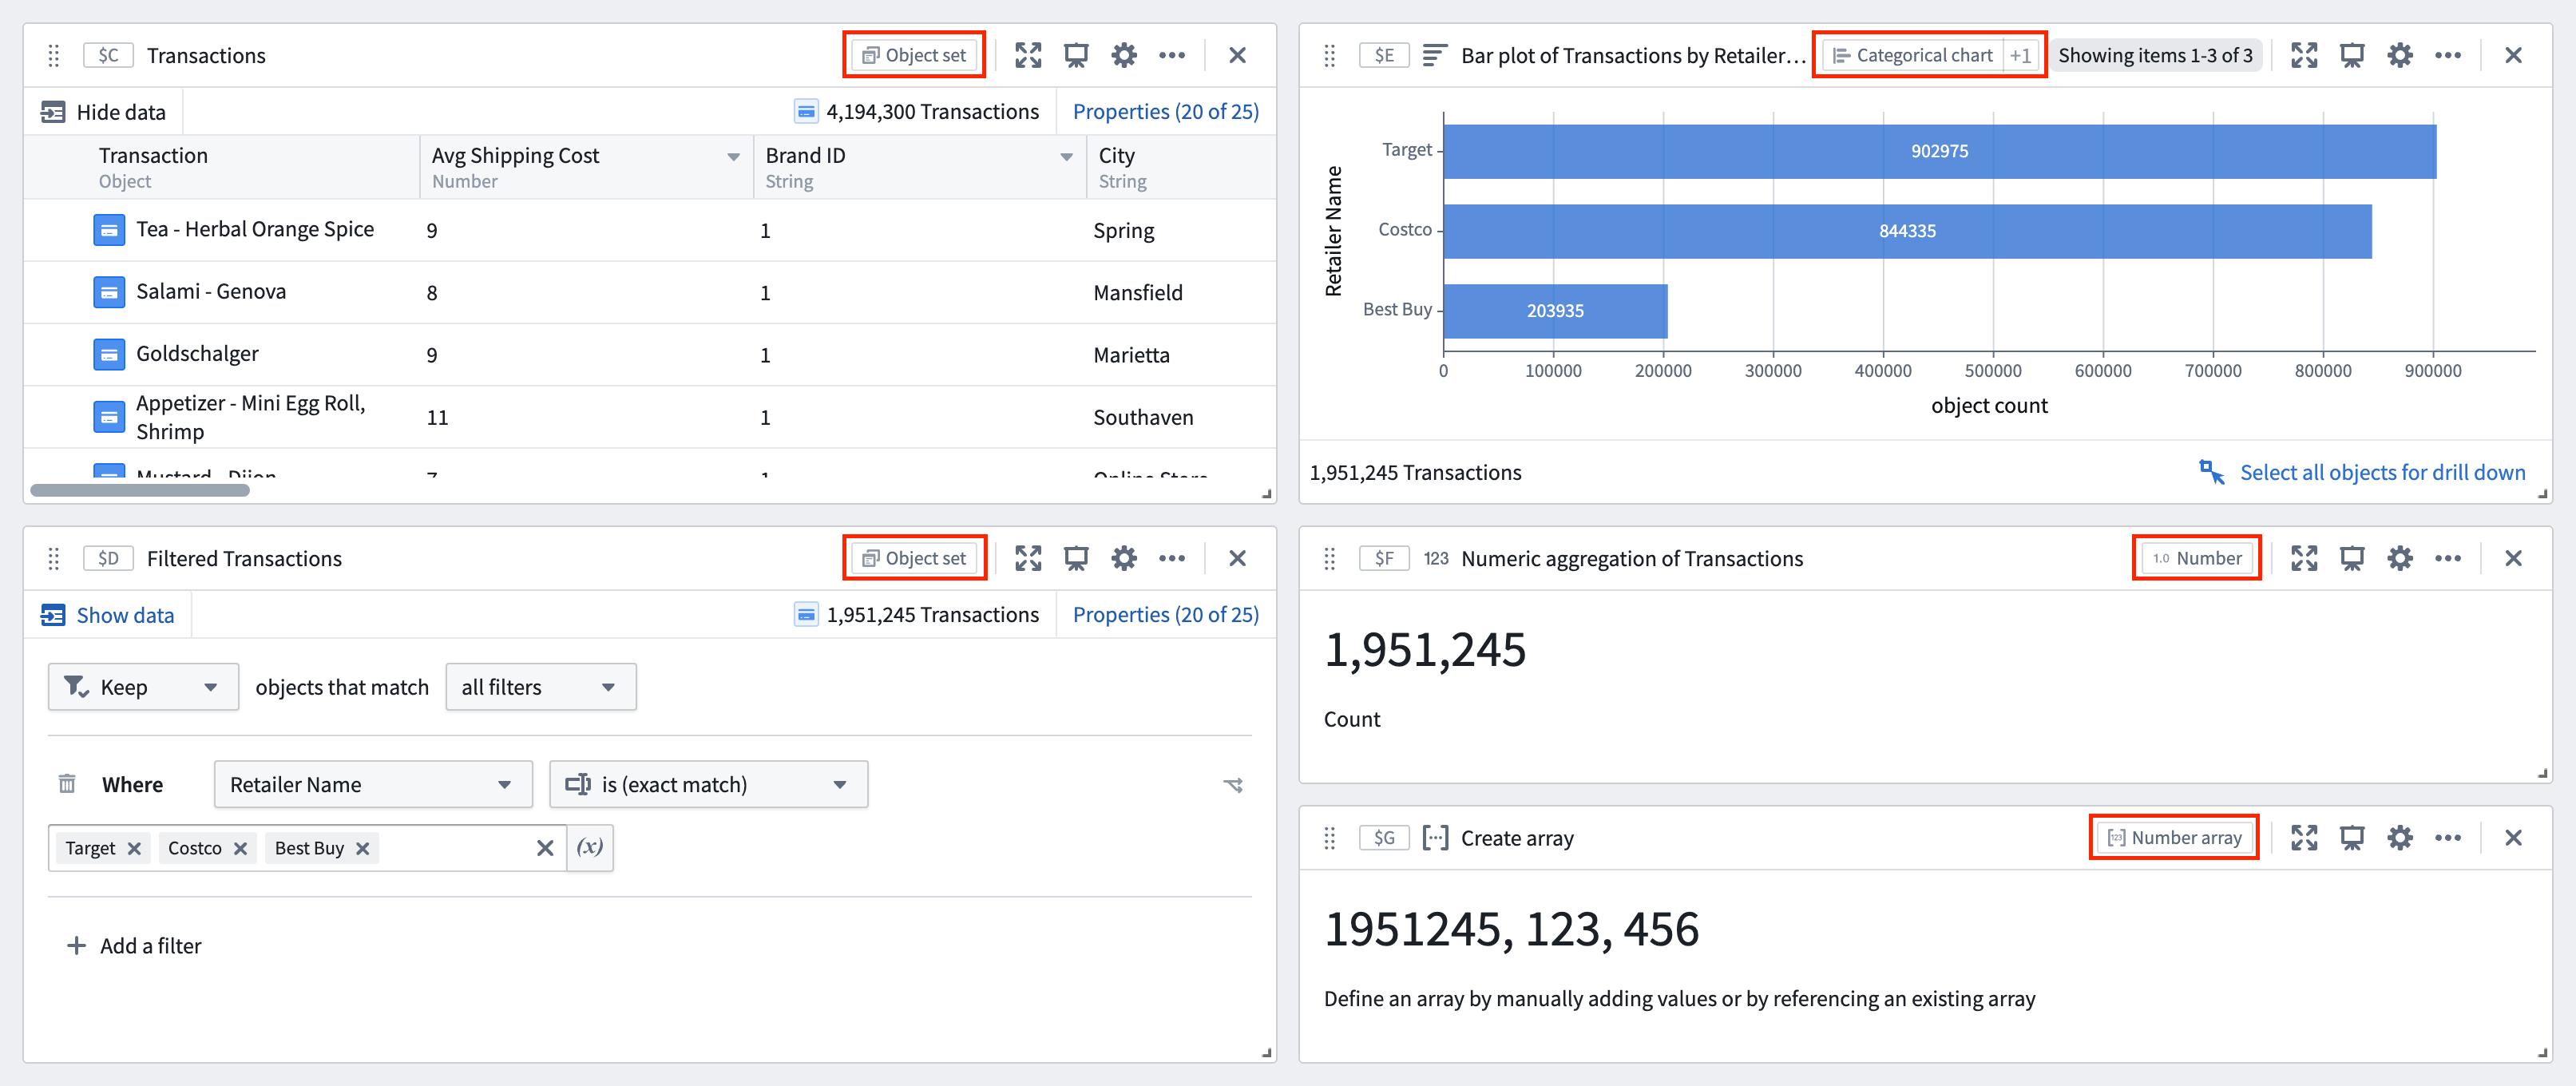
The output type of each Quiver card is also shown in the card header.
