Use advanced search
Quiver’s default search bar enables you to quickly add objects, object sets and time series to your analysis. Quiver also has an advanced search window for more complex search workflows. The advanced search menu resembles the search interface from previous legacy versions of Quiver.
To access the advanced search window, open the search bar by selecting objects or time series from Add Data section from the Analysis top bar of the Quiver interface. Then, select Advanced in the upper right corner of the search bar to open the advanced search window.
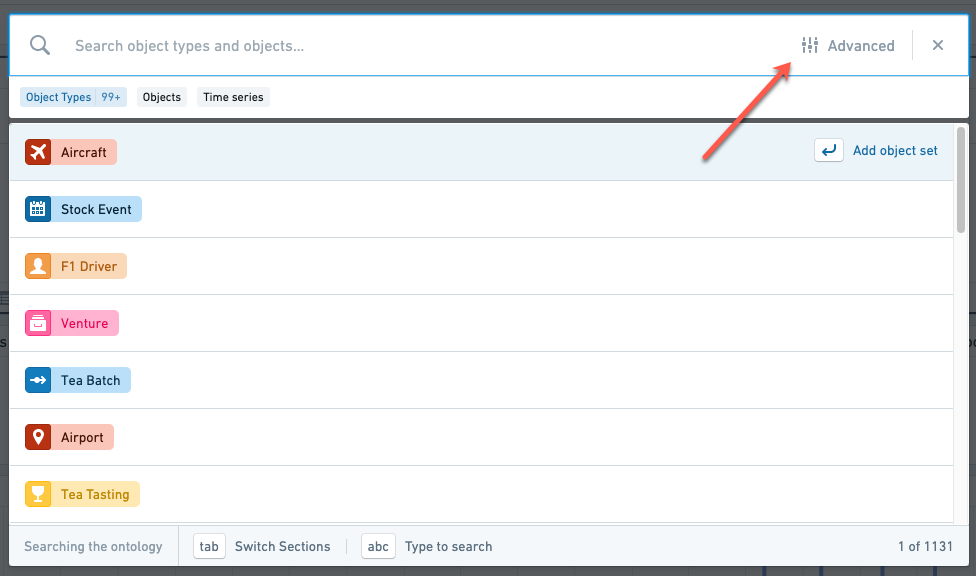
In the advanced search window, you can toggle the search context between Objects & Object Sets and Time Series by changing the dropdown selection at the top right. The search context defines the results you will be seeing when searching on the left side.
Objects & object sets search
Use the right-hand sidebar to search through the available object types and select the object type you are interested in. Note that if you have more than 16 object types, not all of them will be shown; you will need to select Show all to open a search bar where you can search all available object types. Once you have selected an object type, all corresponding objects will appear on the left-hand side of the interface.
At this point, you can either add the entire object set to the analysis by selecting Add object set to analysis or filter the results with the search bar. Once you have identified the objects you would like to add, click the green button next to each object’s name to add the object.
Time series search
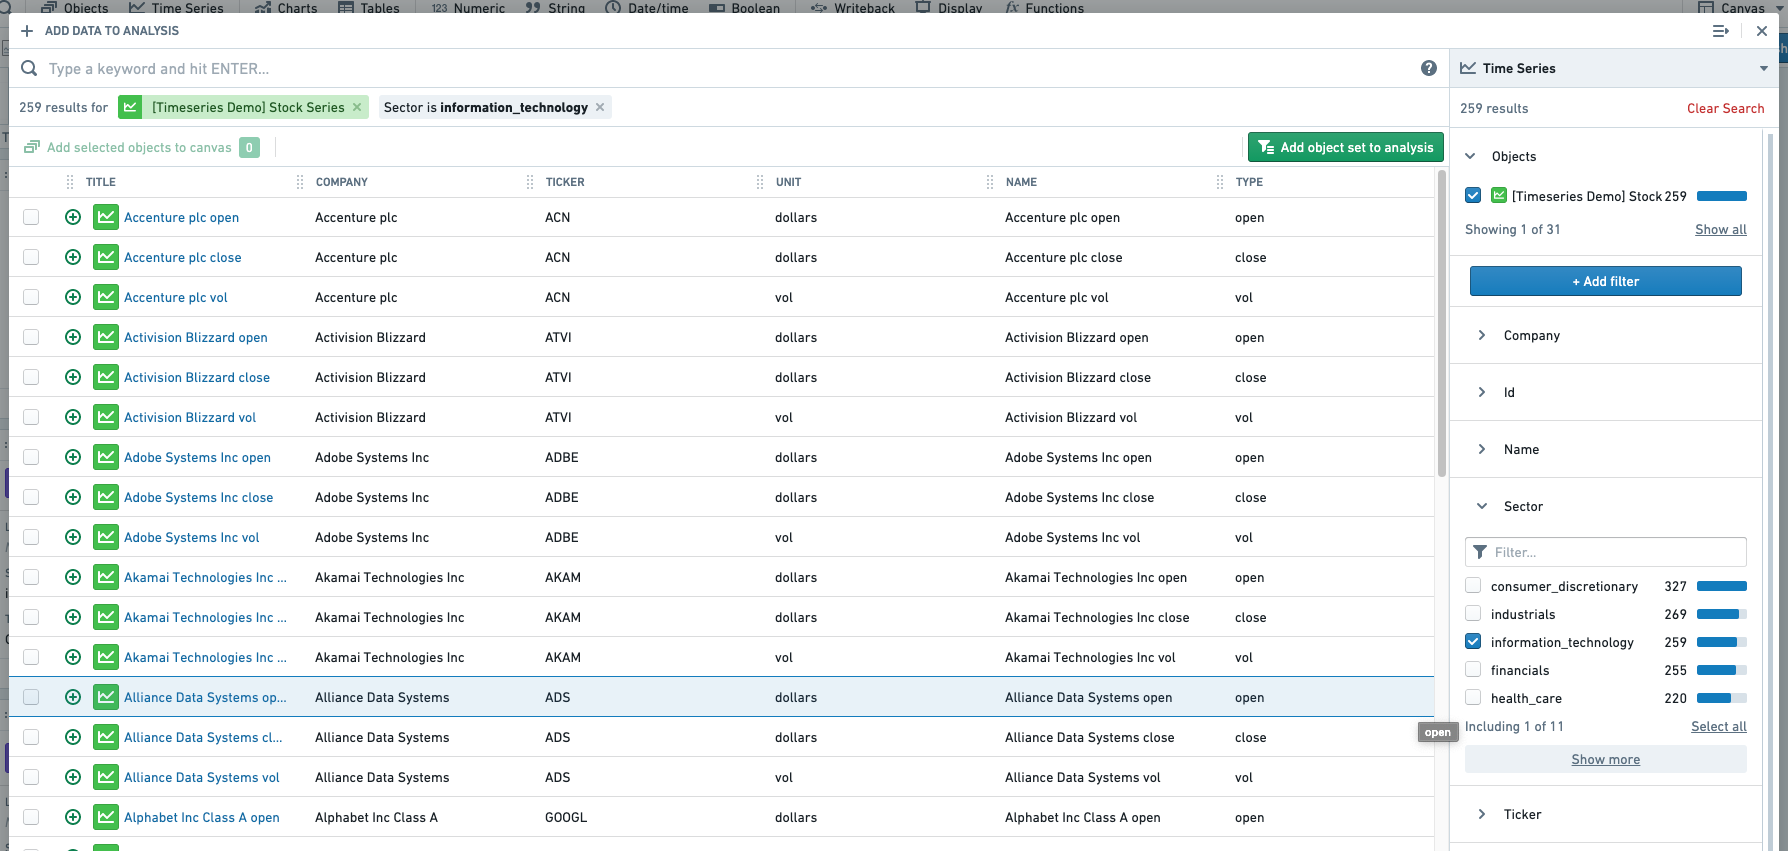
You can use the same window to find time series by switching the search context dropdown to Time Series.
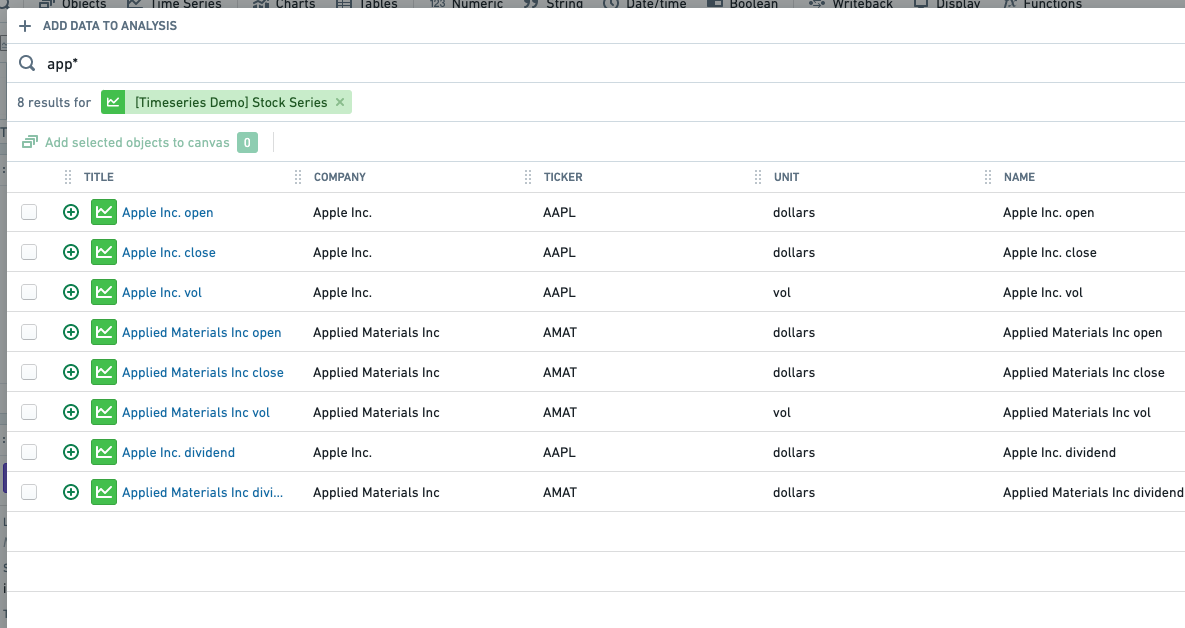
Our example data shows stock time series for a variety of companies. Each company has three time series associated with it: open, close, and vol, which correspond to stock opening price, stock closing price, and stock trading volume. Some companies also have a dividend series, which shows dividend amounts for the stock over time.
Quiver’s search supports trailing wildcard searches for partial matching. For example, searching app* will return series for both Apple and Applied Materials. Note that leading wildcard searches (*app) are not supported.
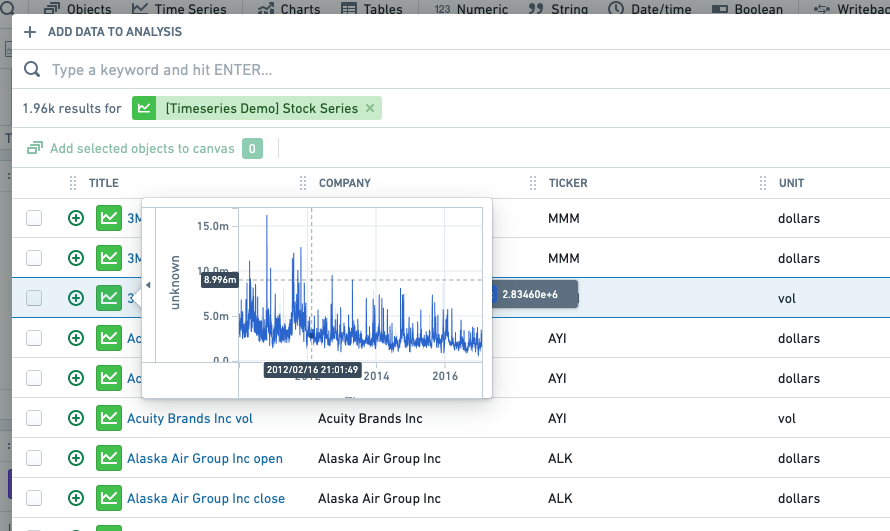
Series preview
For a preview of your data before adding it to a plot, hover your mouse over the icon.
Filter by properties
To further refine your search results, you can use filters, which are accessible through the right sidebar. You can filter by any metadata properties of your data. In our example, our stock data has Sector, Unit, ID, and several other properties we can use to refine our search.
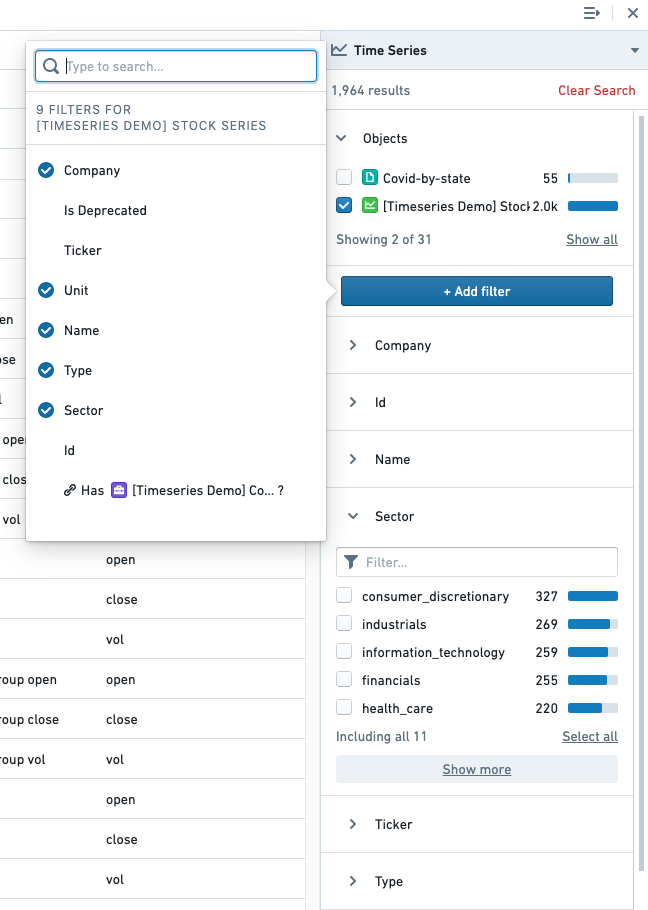
Select object type
The most commonly used filter is the time series object type. These object types represent different types of objects that have time series attached to them, and they will often have different properties. Our example data has a single time series object type, Stock Series.
Selecting one or more of these objects will then allow you to filter by metadata properties. For example, by selecting the Stock Series Object, we can then filter to series that are in the information technology sector.
Example
This section describes an example workflow of locating stock data about airlines.
We start a new search by filtering to Stock series objects, then searching the air lines keywords.
We can now filter this down by using properties. Let's try filtering to only companies that are in the industrials sector. We can do this by applying a filter on Sector.
Filters create a smaller set of results that is easier to work with. To further narrow our results, we can add more filters using the Add Filter button or supply more keywords to the original search.
Configure your search display
Column width, order, and visibility can all be customized. You are free to override the starting set of defaults.
To customize the display, select the dropdown button on any of the columns and select Configure columns. To reorder and resize columns, click and drag along the title bar.