Contour chart
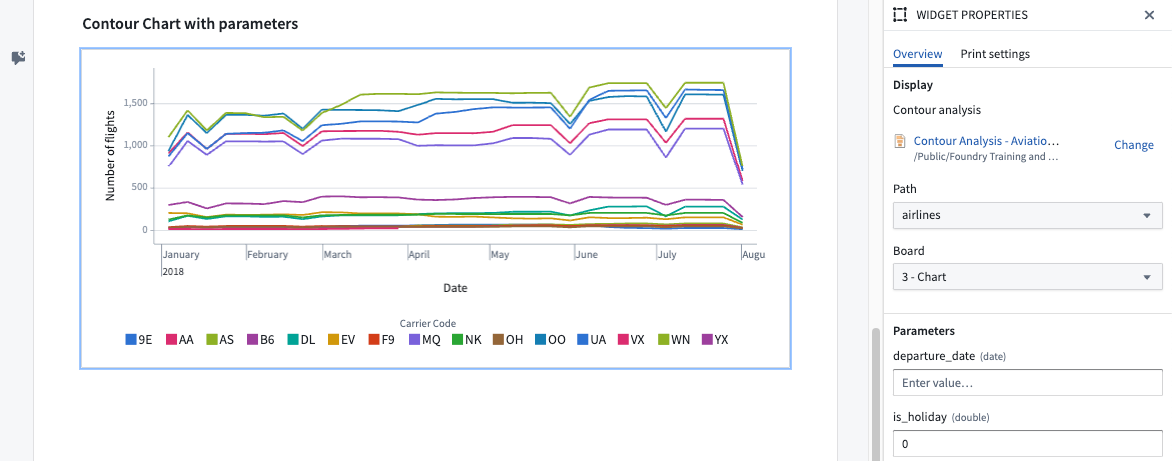
Charts and tables from Contour analyses can be embedded using the Contour chart section. You can add one either by clicking + Add Widget or typing / in a paragraph field to open up the widget insertion menu, or directly via the Copy for Notepad button on the Contour analysis itself.
Note that the source data is updated by Notepad when you open a Notepad document with a Contour board.

The lock data feature on the Contour widget functions differently from other widgets. When applied, it locks both the visualization and data of the Contour widget while still allowing user interaction. On the other hand, locking other widgets produces a non-interactive snapshot of the widget. Interactively locked widgets will not load the locked visual if the backing transactions have been deleted either manually or by a retention policy. Contour widgets will not lock if they are configured with Notepad template input parameters.
For more information, refer to the documentation on the lock data feature.
Widget properties
- Path: Specify a path from the selected Contour Analysis.
- Board: Define which board should be shown from the selected path.
- Parameters: (Case-dependent) The parameters configuration will only be shown if the source Contour analysis defines and uses parameters. The configuration allows overwriting these parameter variable values separately. If no value is specified, the default parameter value from the Contour analysis will be used.
Template configuration
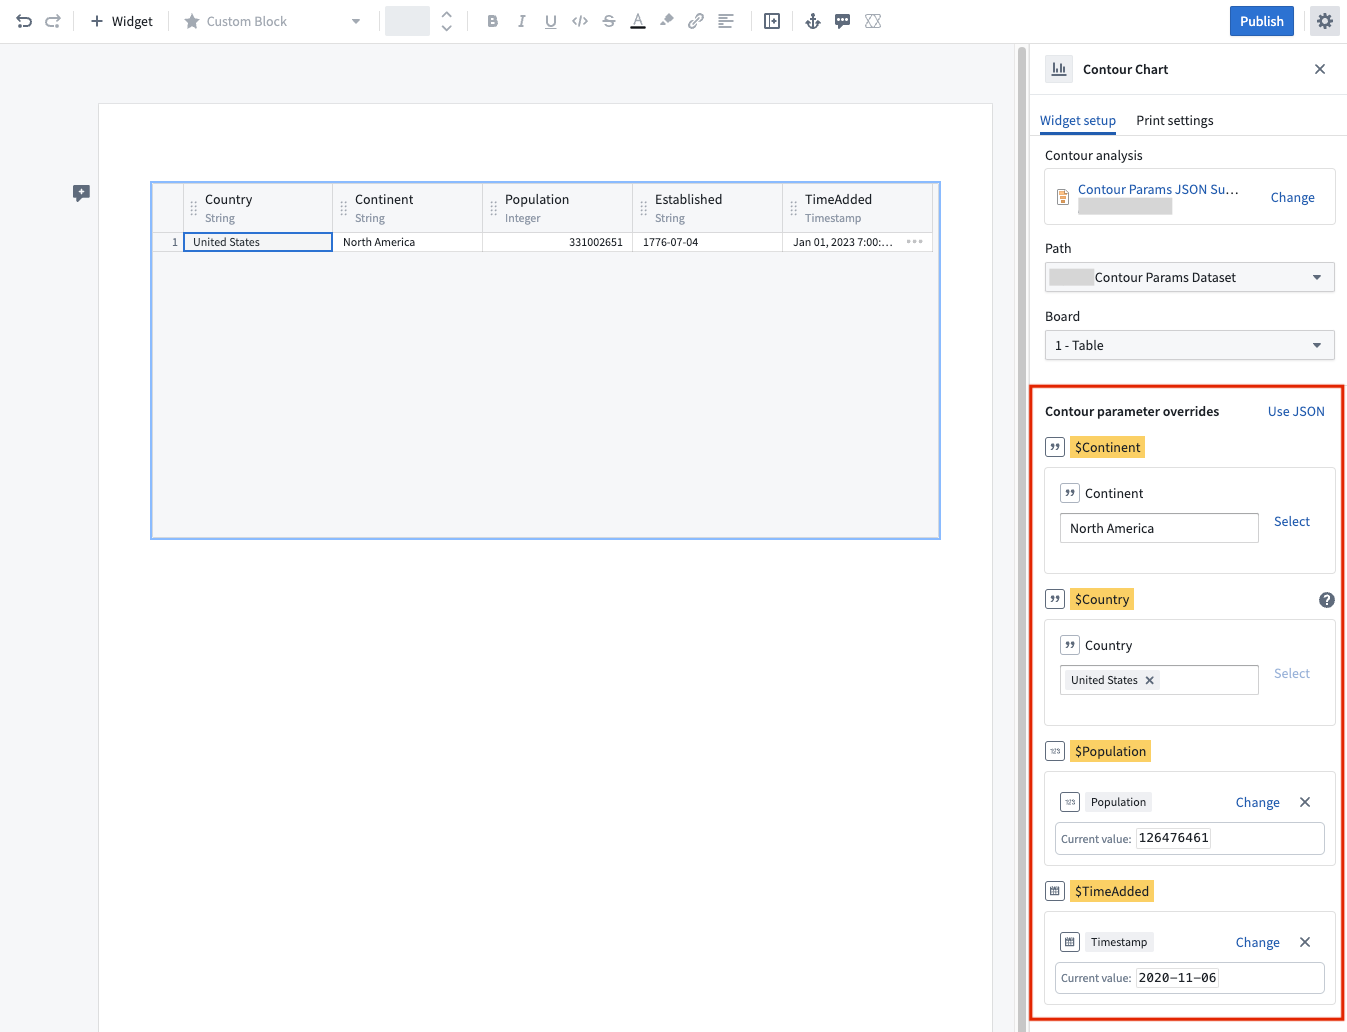
Parameter overrides: (Optional) You can specify Notepad template input parameters to override Contour parameters. These values will be passed to the embedded Contour chart, allowing you to customize the chart's external parameters. To enable this configuration option in Notepad, ensure that the Contour chart is set up to use Contour parameters. If the chart does not use Contour parameters, this configuration option will not be available.
In a Notepad template there are two editing modes for overriding Contour parameters with template input parameters; Use form and Use JSON.
Use form
This is the default mode for overriding Contour parameters. You can map individual Contour parameters to Notepad parameters. There are two ways to input override values:
- Static input values: Directly enter values into fields. These values remain static for each Notepad document generated.
- Notepad template input parameters: Use a Notepad template input parameter that matches the type of the Contour parameter.
Note: Contour parameters may be configured to allow multiple values. Since Notepad does not currently support array parameters, you must use the Use JSON editing mode to override these parameters. In Use form mode, these values can be overridden with a single value, but the option to configure a template input parameter is not available.

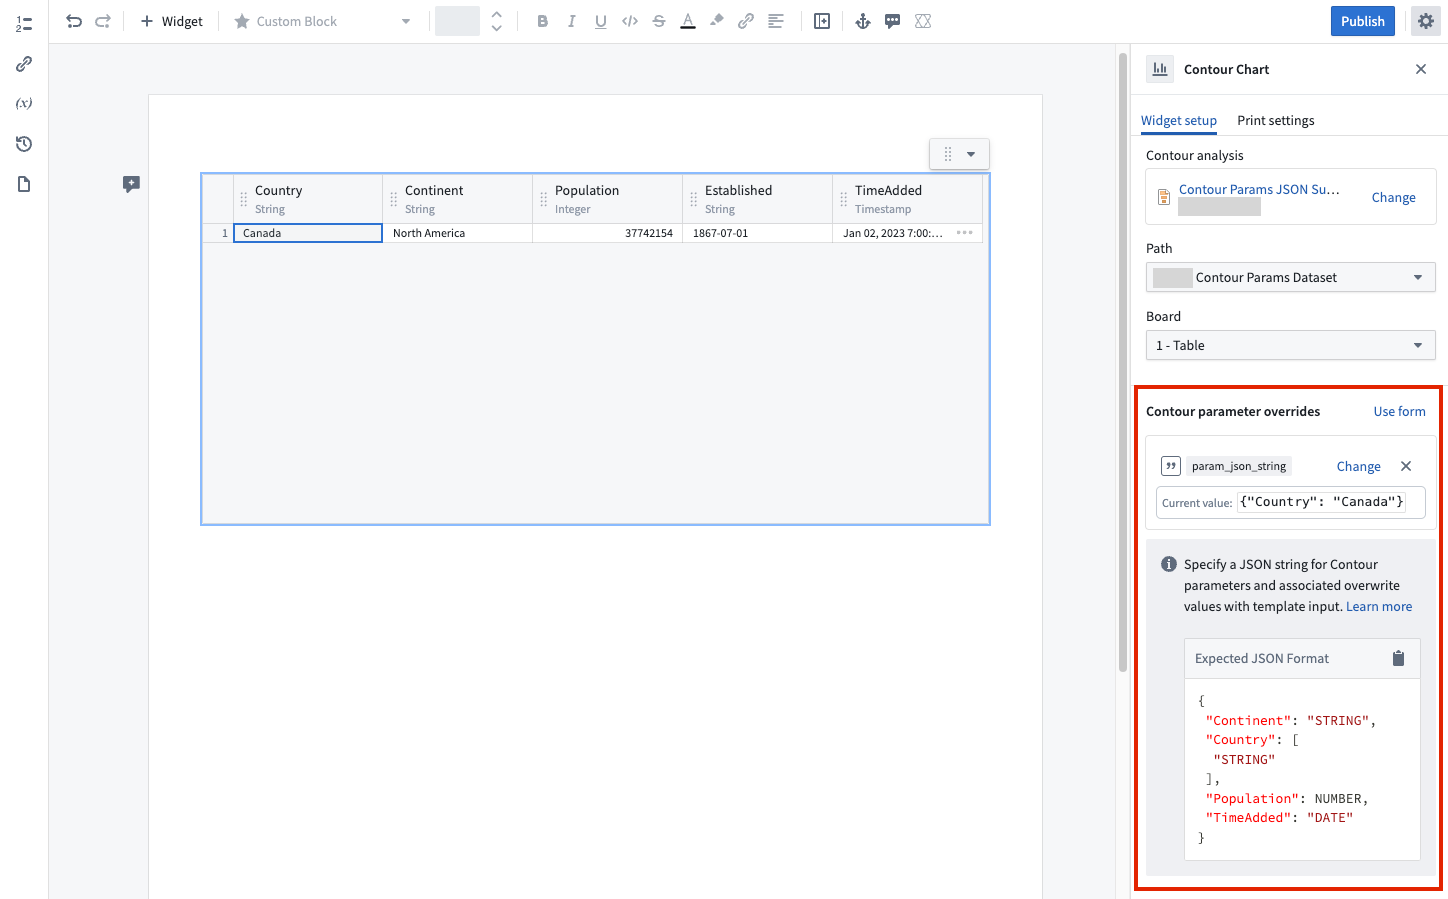
Use JSON
In this mode, you can specify a single JSON string for Contour parameters and their associated override values. To switch to this mode select Use JSON. The override values will be passed to the embedded Contour chart to override its external parameters.

Below are examples of how to provide the required JSON string:
| Contour input type | Example Contour parameter name | Example JSON string |
|---|---|---|
| String | carrier_code | {"carrier_code": "OO"} |
| Array of String | carrier_codes | {"carrier_codes": ["OO", "MQ"]} |
| Number | booking_class | {"booking_class": 2} |
| Array of Number | booking_classes | {"booking_classes": [1,2]} |
| Date | departure_date | {"departure_date": "2022-09-01T00:00:00+02:00"} |
You can combine multiple values into a single JSON string as shown below:
{"carrier_code": "OO", "booking_class": 2}
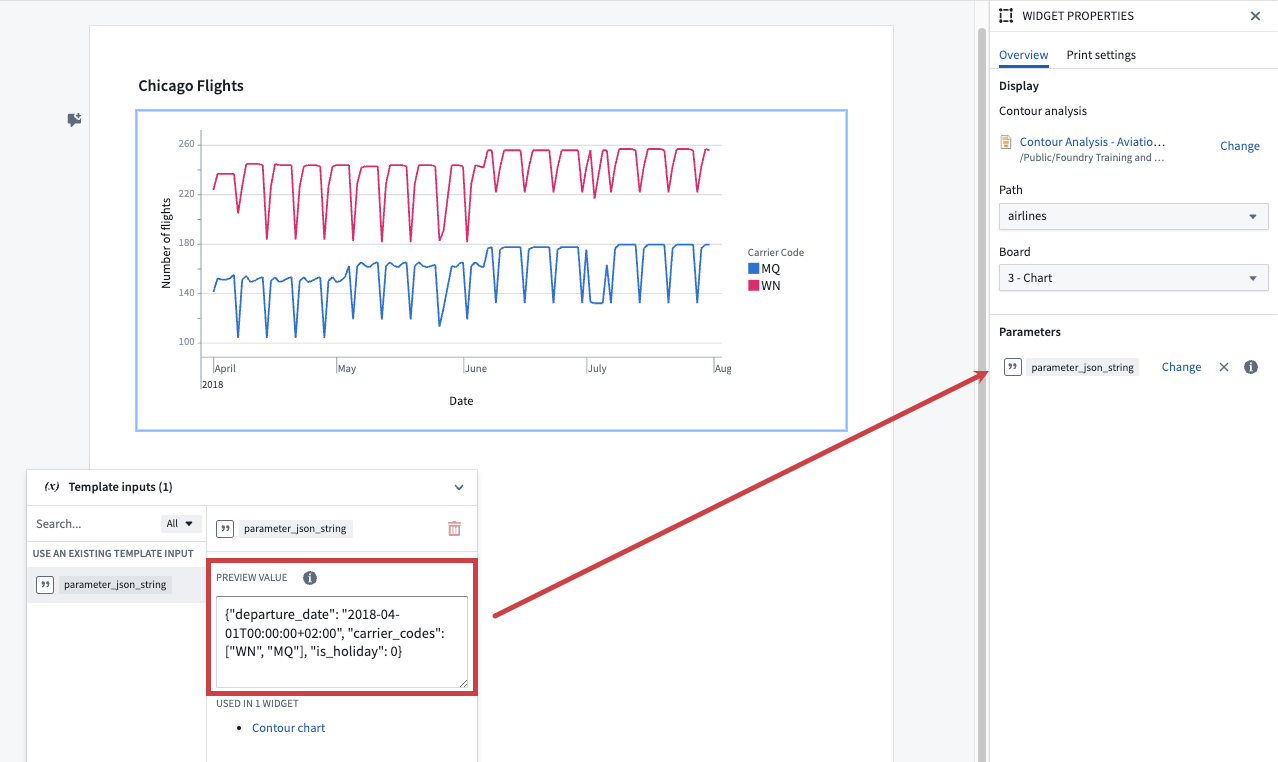
Refer to the example below on how to provide a template input with a preview value and connect it to the Contour parameters.
