- Capabilities
- Getting started
- Architecture center
- Platform updates
Code Workbook chart
Visualizations such as images or Plotly charts generated in Code Workbook can be added to documents via the Code Workbook chart section.
The easiest way to add a visualization is via the Copy for Notepad button available on each Code Workbook chart node. Alternatively, the section can be added by clicking + Add Widget or typing / in a paragraph field to open up the widget insertion menu.
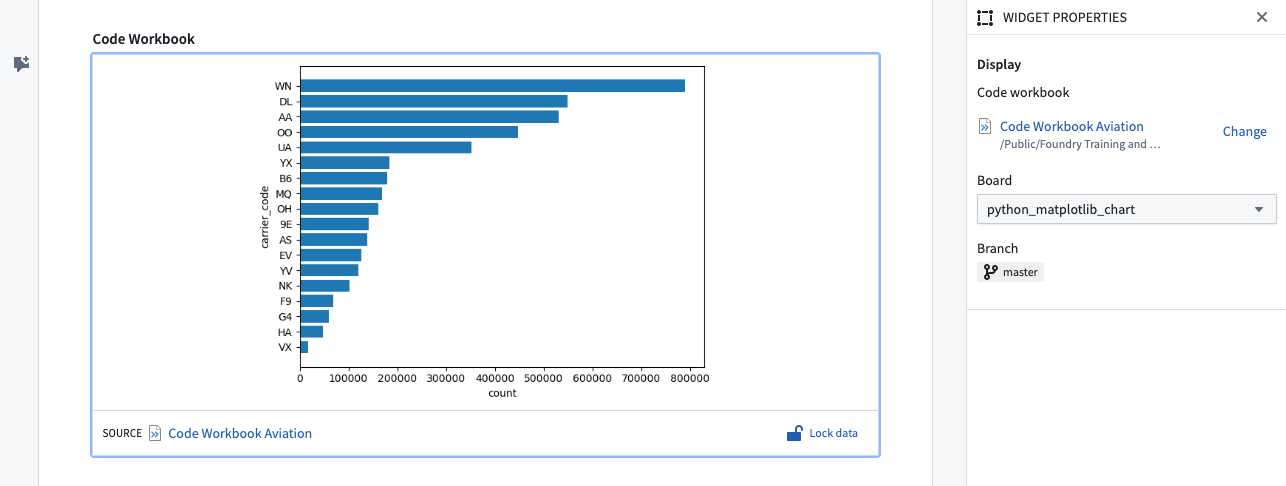
Widget properties
- Board: Select the board that you want to display. Note that only boards with visualizations can be selected, others will be excluded.