- Capabilities
- Getting started
- Architecture center
- Platform updates
Transform card
Use a Transform card in your analysis path to perform operations on your data, such as set math, group by, and SQL.
Set math
Three operation types are available with a Set Math transform in Insight:
-
Union: Combines object sets into a single object set. Input object sets can be published object sets or paths within the workbook. When combining different object types, the operation functions like a full outer join, adding properties from all object types to the table and chart views. When working with unioned sets, you can sort rows by matches, which is helpful for quickly identifying overlap between filtered sets of the same object type.
-
Intersect: Keeps objects that appear across all selected object sets. Intersection can only be applied to a single object type, so the object set picker only shows paths or object sets matching the object type in the path.
-
Subtract: Removes objects from an object set. Like intersection, subtraction can only be applied to a single object type, so the object set picker only shows paths or object sets matching the object type in the path.
Visualize
Use a Group by aggregation or create a Property chart or Vega chart to visualize the data in your analysis.
Group by
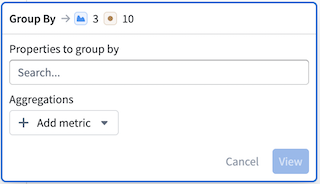
The Group by operation aggregates rows across one or many properties:
-
Properties to group by: Select one or more properties to group by. Properties not selected here can be used as aggregation targets.
-
Aggregations: Select at least one aggregation metric (for example,
Count). Multiple aggregation types can be added, and column names can be renamed as needed.
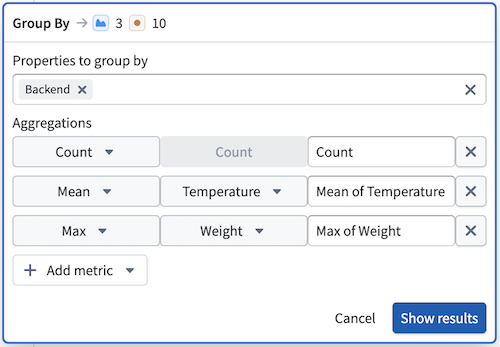
Select Show results to view the Group By table in the analysis path.
Filter with the Group By table
Selecting rows in the Group By table applies a filter to the underlying data without modifying it. Select one or more rows to enable filtering; the label in the top left of the table will update from Select a row to filter results to Filtering on [1] row. To remove the filter, select X.
Property chart
Property charts display an in-path histogram of values within a selected property. Selecting a range in the chart applies a filter to the underlying data without modifying it. For similar functionality, use the charts tab of your workbook.
Vega chart
Vega is a fully customizable, open-source visualization library. In Insight, Vega charts can only be used with output from an SQL sandbox card and do not support Ontology data directly from the analysis path. For configuration details, review the Vega documentation ↗.
Query
SQL
This tool can be used to write SQL expressions and transform path data. SQL is only supported when the analysis path contains a single object type and is disabled when more than one object type is present. The SQL sandbox supports joins with other object types without relying on Ontology link types. To reference object types for joins, use a backtick.
The SQL sandbox in Insight defaults to the following query:
SELECT * FROM Path
LIMIT 10
Path refers to the data in the analysis path at the point where this card is added. If filters are applied before the SQL card, the SQL operates on that filtered data.
For more information about supported syntax and other SQL use cases, view the Ontology SQL documentation.
SQL results
SQL sandbox results appear in the SQL preview table. The SQL tool runs on a materialization of your data, so its outputs are not ontologized and cannot be used directly in the path. SQL results can be viewed in the preview table by selecting the SQL sandbox card, or downloaded as a CSV.
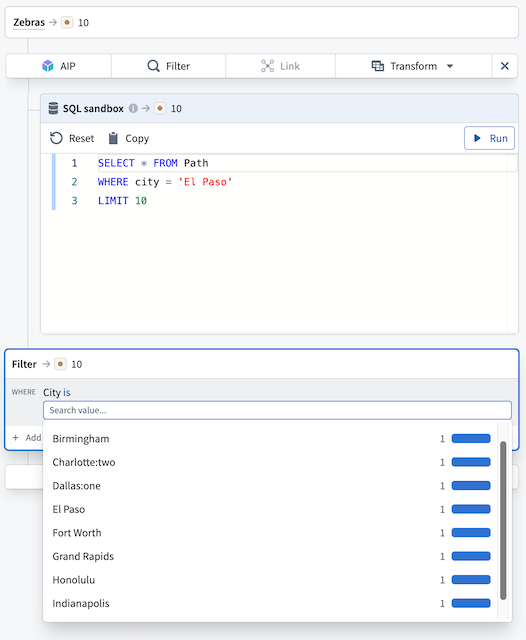
SQL sandbox and filter cards
Because the SQL sandbox does not affect path data, any filter card added after it will filter on the path data from before the SQL step. In the example image below, the SQL result is 1 while the object count remains 10, since the query cannot affect path results directly. Applying a filter card after the SQL step shows all 10 objects.