- Capabilities
- Getting started
- Architecture center
- Platform updates
Charts
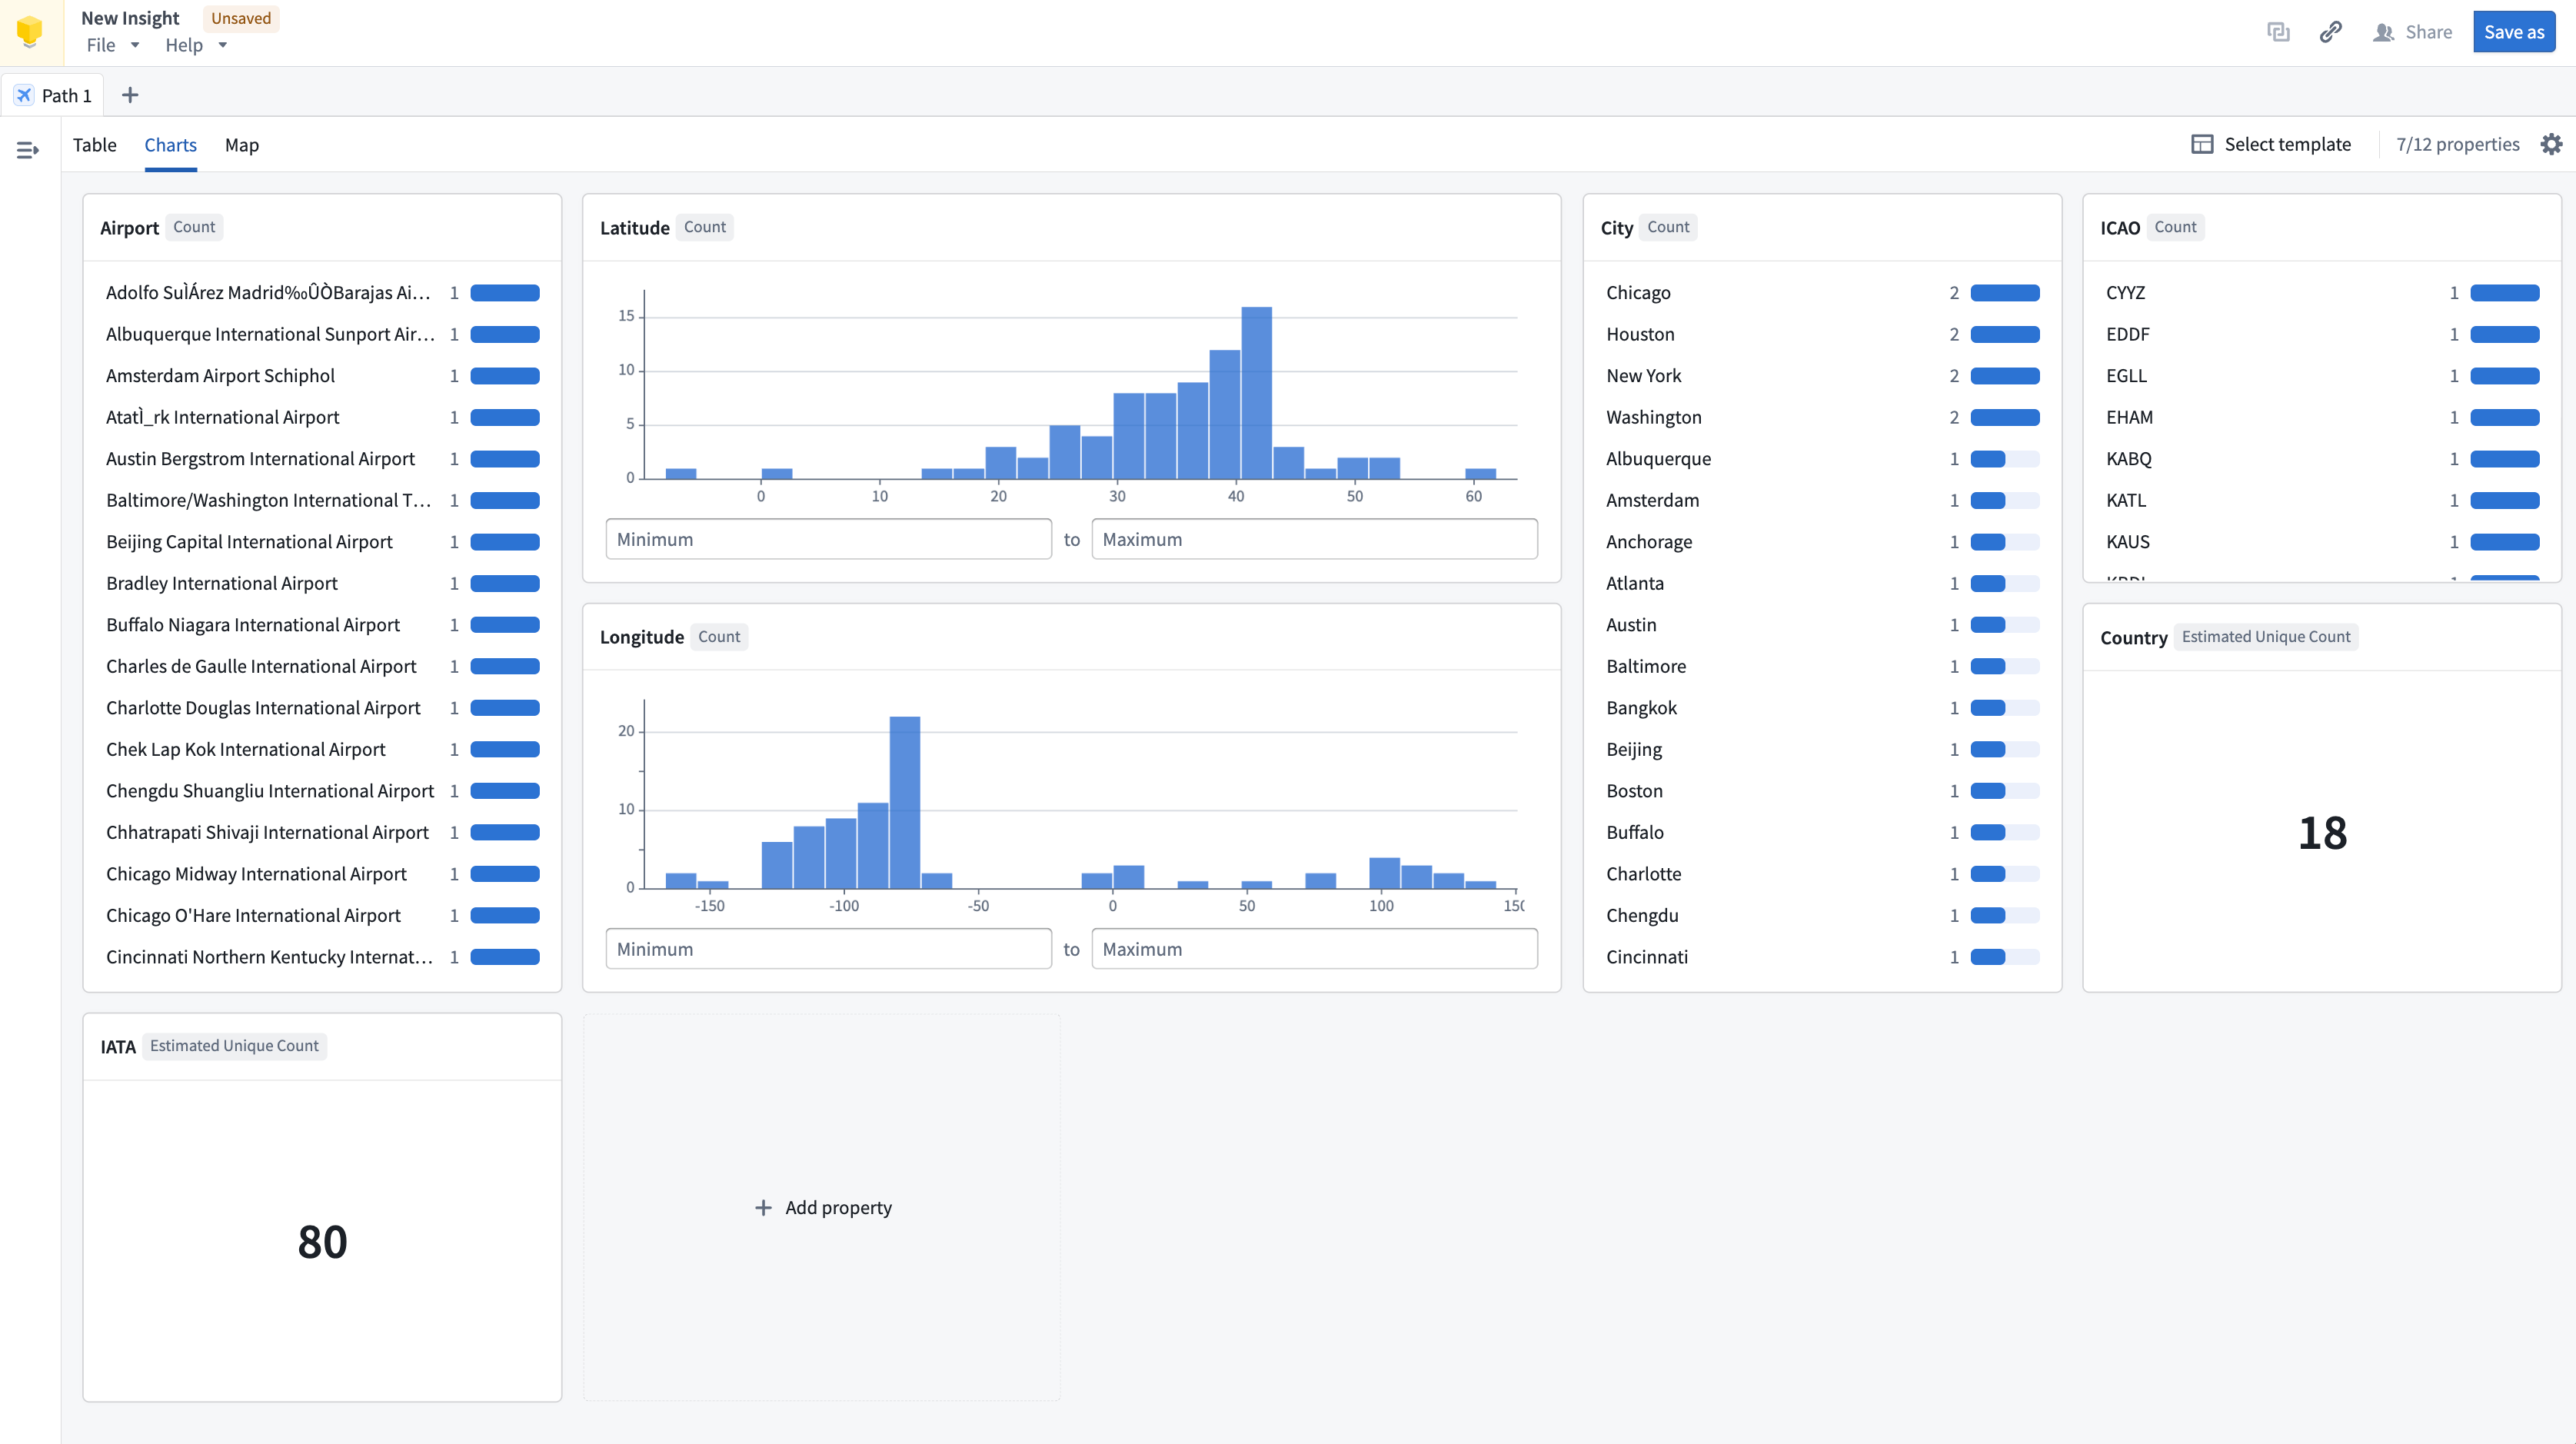
The Charts tab in your Insight workbook provides an out-of-the-box visualization for each property in the analysis path. Eight properties are shown by default and can be modified using the Edit property card layout panel found by selecting the gear icon in the top right corner.
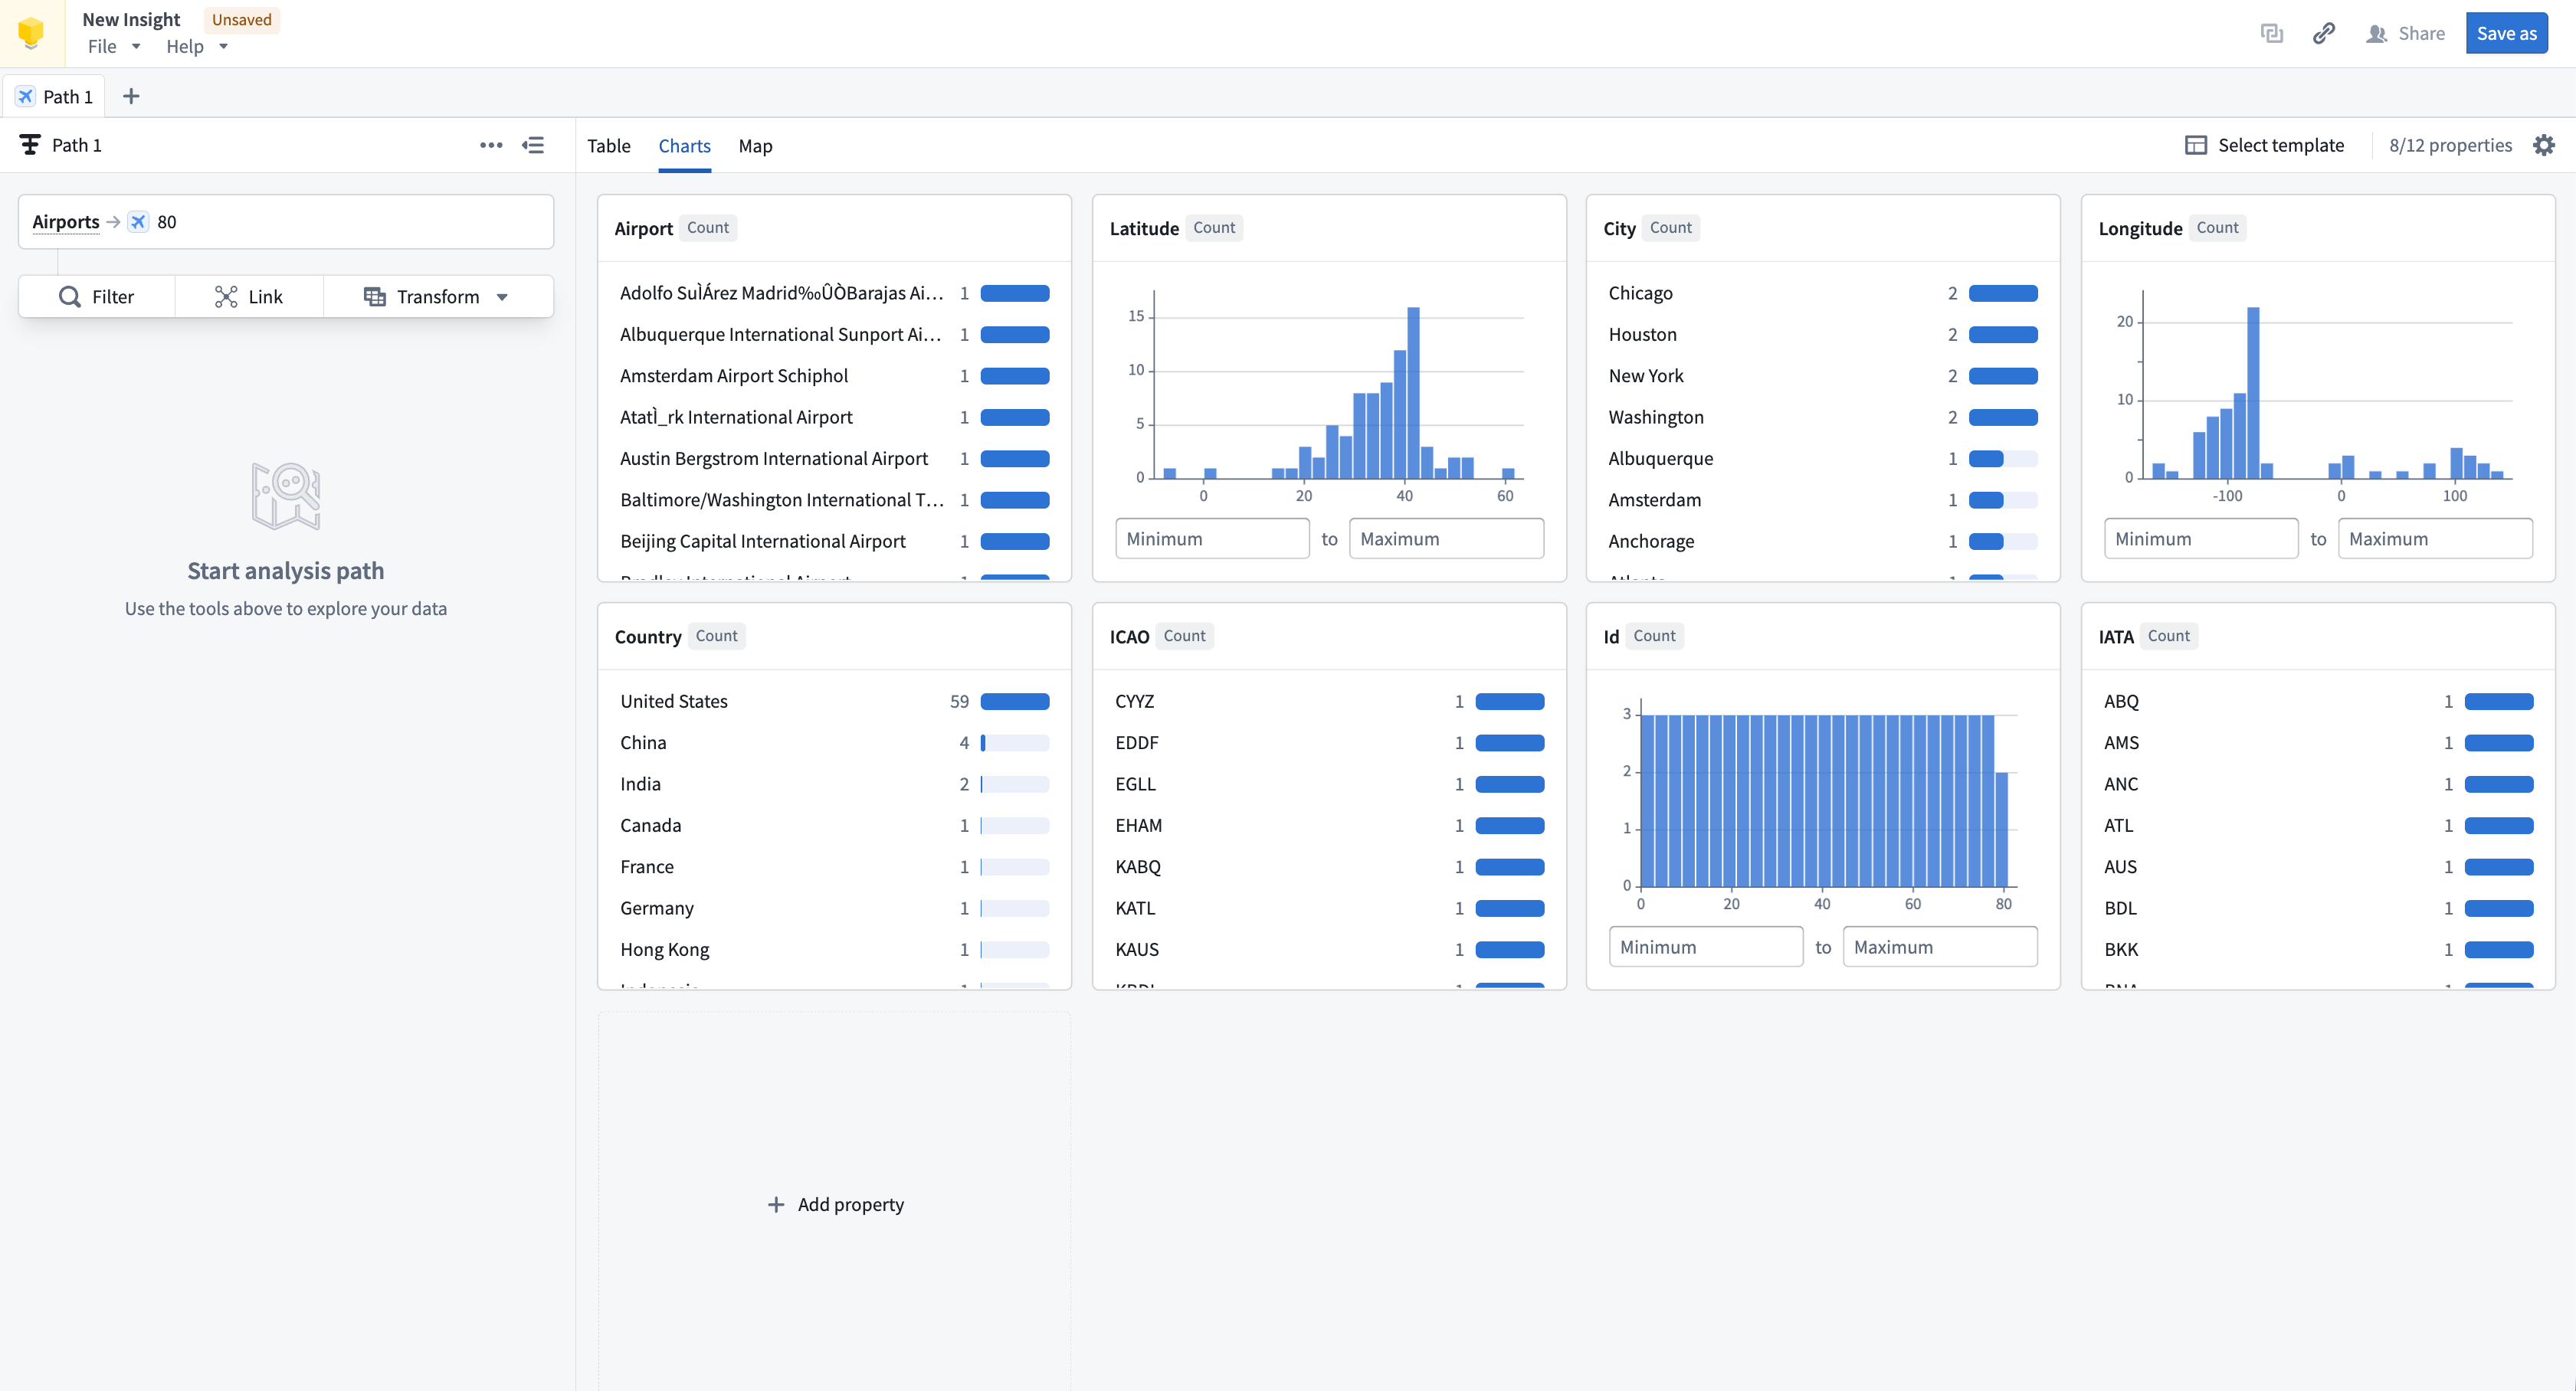
Charts provide a quick visual summary of all properties in the analysis path. When combined with saved layouts, the charts section can be configured as a shareable dashboard view. Charts can also be used to filter data; selecting a chart provides the option to apply it as a filter. Chart cards can be repositioned within the layout, and charts will resize responsively based on browser or screen size.
Manage charts
Charts are uniform in size by default but can be extended to double their width or height. Charts can also be reordered by dragging them to the preferred position.
Types of charts
The chart type available depends on the property type:
- String: Histogram and single stat of count
- Numeric: Distribution and single stat with aggregation options
- Timestamp/date: Distribution
- Geographic properties: Not supported in charts. View geographic properties in the Map tab.
- Struct/array of structs: Not supported in charts
- Media reference: Not supported in charts. View media references in the Table tab.