- Capabilities
- Getting started
- Architecture center
- Platform updates
Use the expression board
In addition to visual tools like the histogram and chart, Contour also offers an expression board that lets you work with Contour’s rich expression language to derive new columns from your data, perform complex filtering, or perform complex aggregations. Contour's expression language is a custom language that incorporates a number of functions from SparkSQL.
- When using the expression editor, use the ? icon for a quick reference of the expression language.
- As you type, suggested functions appear in a dropdown. Click or use the Enter key to select a function.
Column names are case-sensitive. Additionally, when selecting a column, you may write the column name with or without double quotes. For example, year("birthdate_col") is equivalent to year(birthdate_col). For consistency, column names in this documentation are written with double quotes.
Adding an expression board
You can add an expression board to your Contour analysis from the toolbar as demonstrated in this overview:

This example uses the open source data from the U.S. Bureau of Transportation Statistics.
Configuring the expression board
The expression board has two modes: a library of saved expressions and an editor.
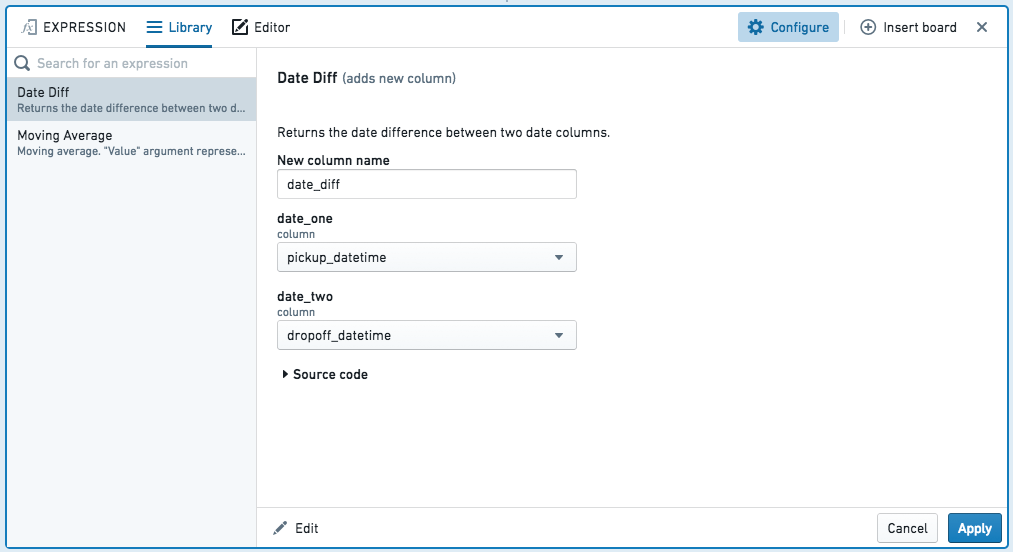
Library
The library lets you re-use expressions written by you or others, with arguments:
Editor
Within the editor, there are four categories of expressions you can write:
- Add new column
- Replace column
- Filter
- Aggregate
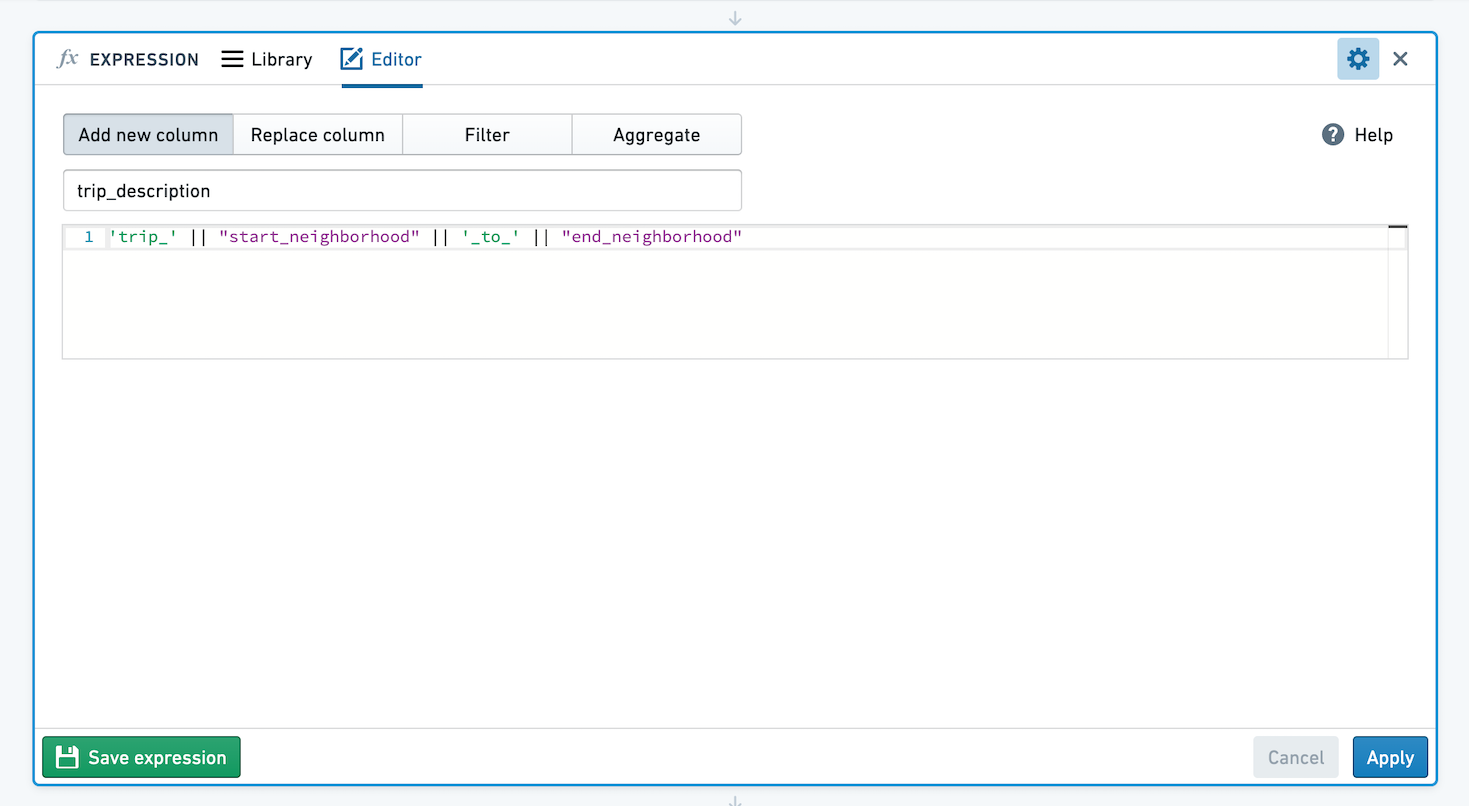
Adding a new column
Enter the name for your new column, and the expression to build it. For example, create a new column by extracting the year from a birthday using year("birthdate_col"), or create a column with a taxi trip description string by concatenating values from other columns:
Replacing a column
Select which column you want to replace, and the expression with which to replace it.
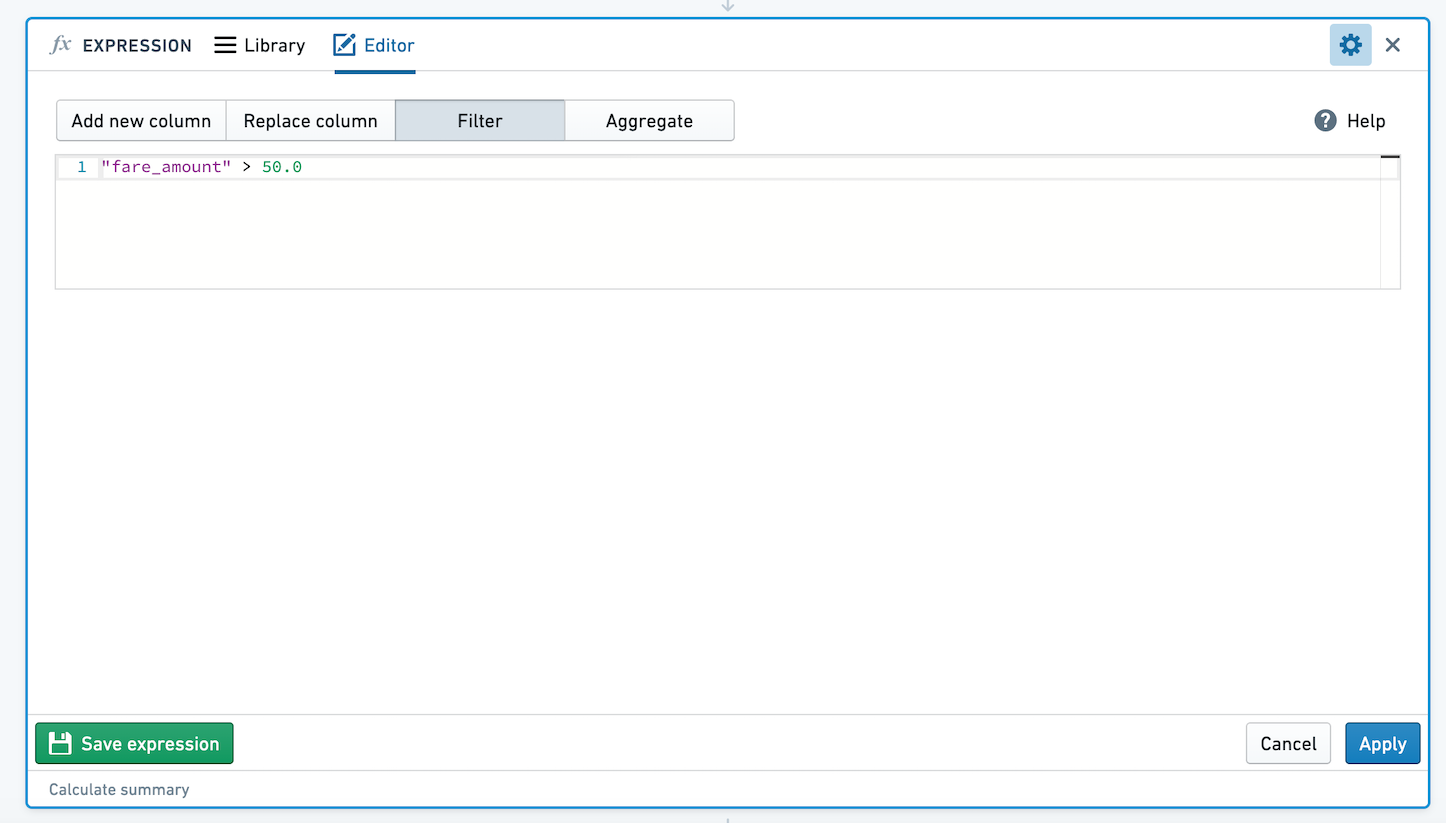
Filtering data with expressions
Define a filter condition by entering an expression that evaluates to a Boolean. Your data will be filtered to all rows in which the expression evaluates to true. For example, filter to only people born in 1981 using year("birthdate_col") == 1981, or filter a table of taxi trips to only trips with fares of more than $50:
You cannot use window functions (OVER syntax) in filter expressions, due to a limitation of SparkSQL. You can use them to create new columns, as demonstrated later.
The following section contains examples of filter expressions you can use in Contour.
Common examples
Compare a column to a static value
"taxi_fare" < 25.0
"birth_date" == '1776-07-04'
In the expression board editor, null = null produces true. This is different from SparkSQL, where null = null resolves to null.
Filter with a not-equal-to operator
Filter to all rows where league_id is not equal to ‘NHL’:
league_id != 'NHL'
Compare two columns
"age" < "average_age"
Filter to rows where tip percentage (tip divided by fare) is greater than or equal to average_tip_percentage:
("tip" / "fare") >= "average_tip_percentage"
Remove rows with nulls
Filter to all rows where category is not null:
not isnull("category")
Split a column using a special character
Split categories column by |. Since | is an example of a special character, it needs to be escaped in order to be treated as literal.
SPLIT("categories", '\|')
Search patterns using LIKE
Use the SQL LIKE operator ↗ to search for patterns in column values.
Match all country names that end in A:
"country_name" LIKE '%a'
Filter on multiple conditions
Combine two or more filter expressions with AND or OR:
("start_borough" == 'Queens') AND ("end_borough" == 'Queens')
"department" is 'sales' OR "department" is 'r&d'
Find row of MIN or MAX
A common task in data analysis is to find the row with the minimum or maximum value for some column within a partition. For example, you might have a dataset with patient records and want to find the earliest date that each patient visited the office. You can use two expressions to find these rows.
You must derive a new column first and then use that to filter, rather than doing everything in the filter expression. This is because you cannot use window functions in filter expressions, due to a limitation of SparkSQL.
First, derive a new column to find the min or max value for the partition. In the following example, we determine the most recent taxi ride each cab (identified by medallion number) has given, creating a new column most_recent_ride:
max("pickup_datetime") OVER (PARTITION BY "medallion")
See Advanced expressions: Window functions if you need a refresher on using window functions (OVER).
Then add a filter expression comparing each row’s pickup date value to the max value for its partition:
"pickup_datetime" == "most_recent_ride"
Aggregating data with expressions
This mode lets you aggregate your data using group by expressions and aggregate expressions. You can have zero, one, or many group by expressions, and you can have one or many aggregate expressions. Each group by and aggregate expression must be given a name, and the resulting table will have a new schema consisting of one column for each expression.
For example, given the following expression aggregating average taxi trip distance by start neighborhood:
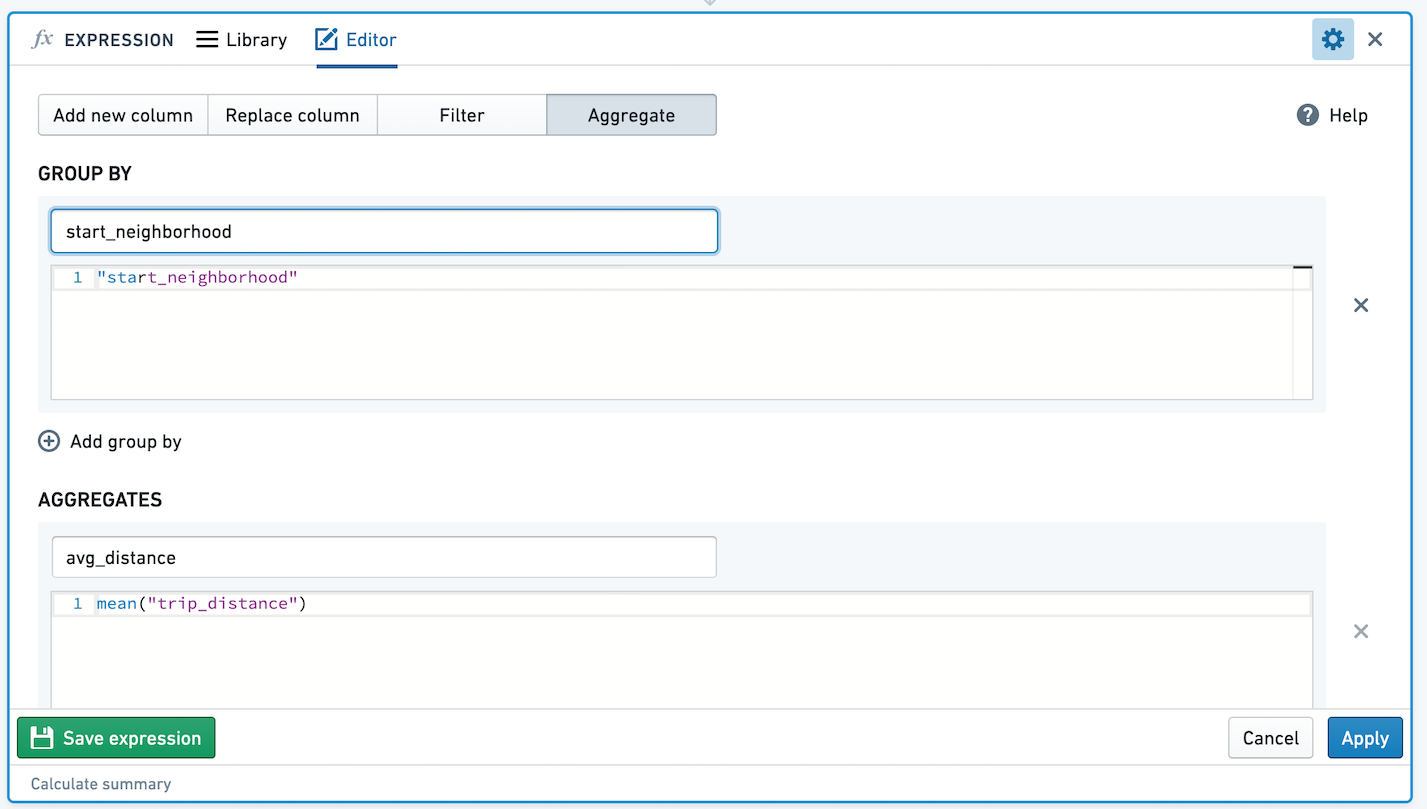
The resulting table would look like this:
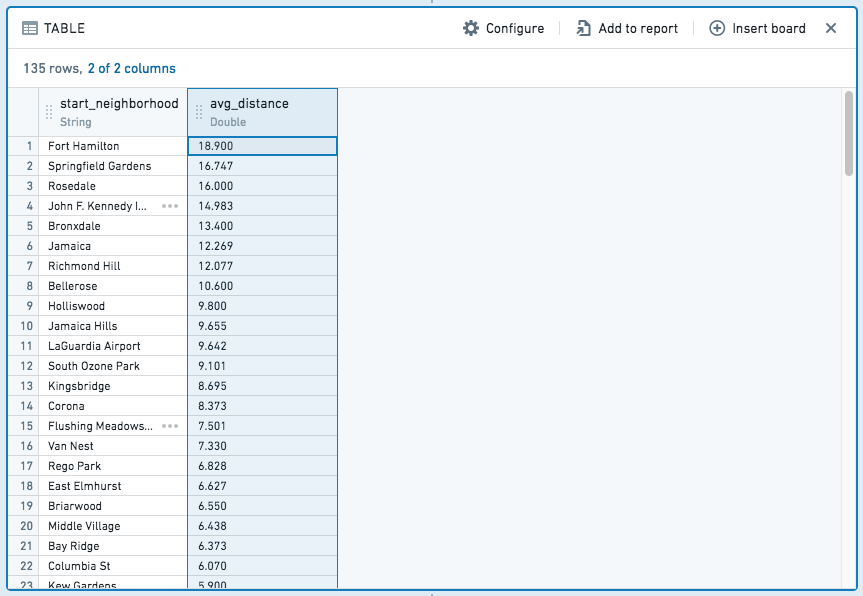
In contrast to add-column and filter expressions, aggregate expressions result in a completely new table, with columns for each aggregate and group by partition.
For example, given a notional dataset like the following:
| id | name | sport | birthday | number_of_gold_medals |
|---|---|---|---|---|
| 1 | Jane | Swimming | 6/29/1985 | 6 |
| 2 | John | Gymnastics | 2/19/1971 | 3 |
| 3 | Mike | Swimming | 3/23/1971 | 7 |
| 4 | Michelle | Gymnastics | 9/12/1971 | 5 |
If you want to know how many total gold medals were won, you would use:

which would give you the following table:
| sum |
|---|
| 21 |
If you want to know the total and average number of gold medals won by birth year and sport, you would use:

which would give you:
| birth_year | sport | sum | average |
|---|---|---|---|
| 1971 | Swimming | 7 | 7 |
| 1971 | Gymnastics | 8 | 4 |
| 1985 | Swimming | 6 | 6 |
If you would like to perform analysis on the new table resulting from the aggregation, you can switch to aggregated data.
Saved Expressions
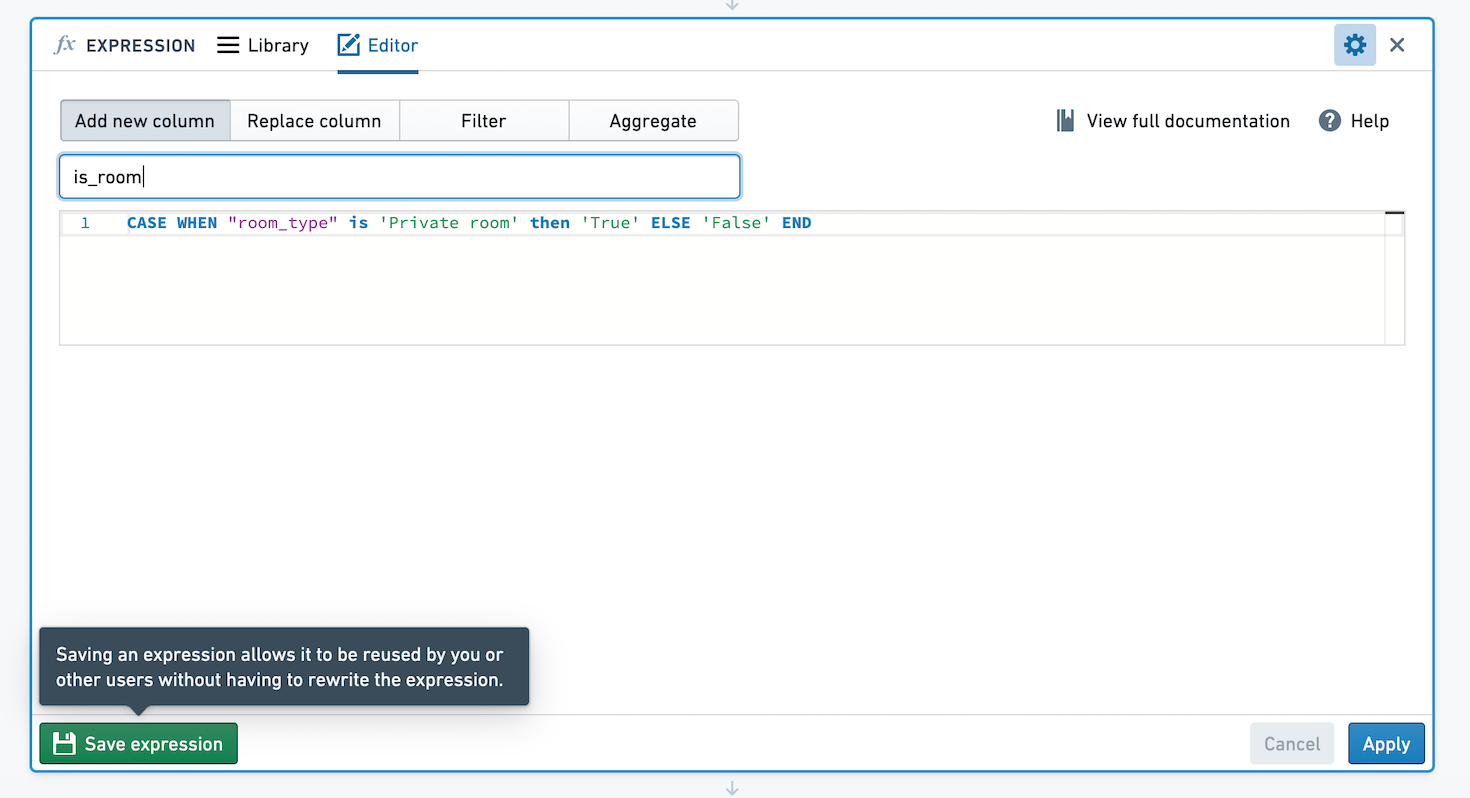
In Contour, you can save expressions to easily reuse logic across analyses and paths, and share logic with others. Let's imagine we've created an expression creating a new column, with value True if the column room_type has value Private room, and False otherwise. We want to save this expression so others can use this logic.
Click Save Expression in the bottom left hand corner of the Expression board.
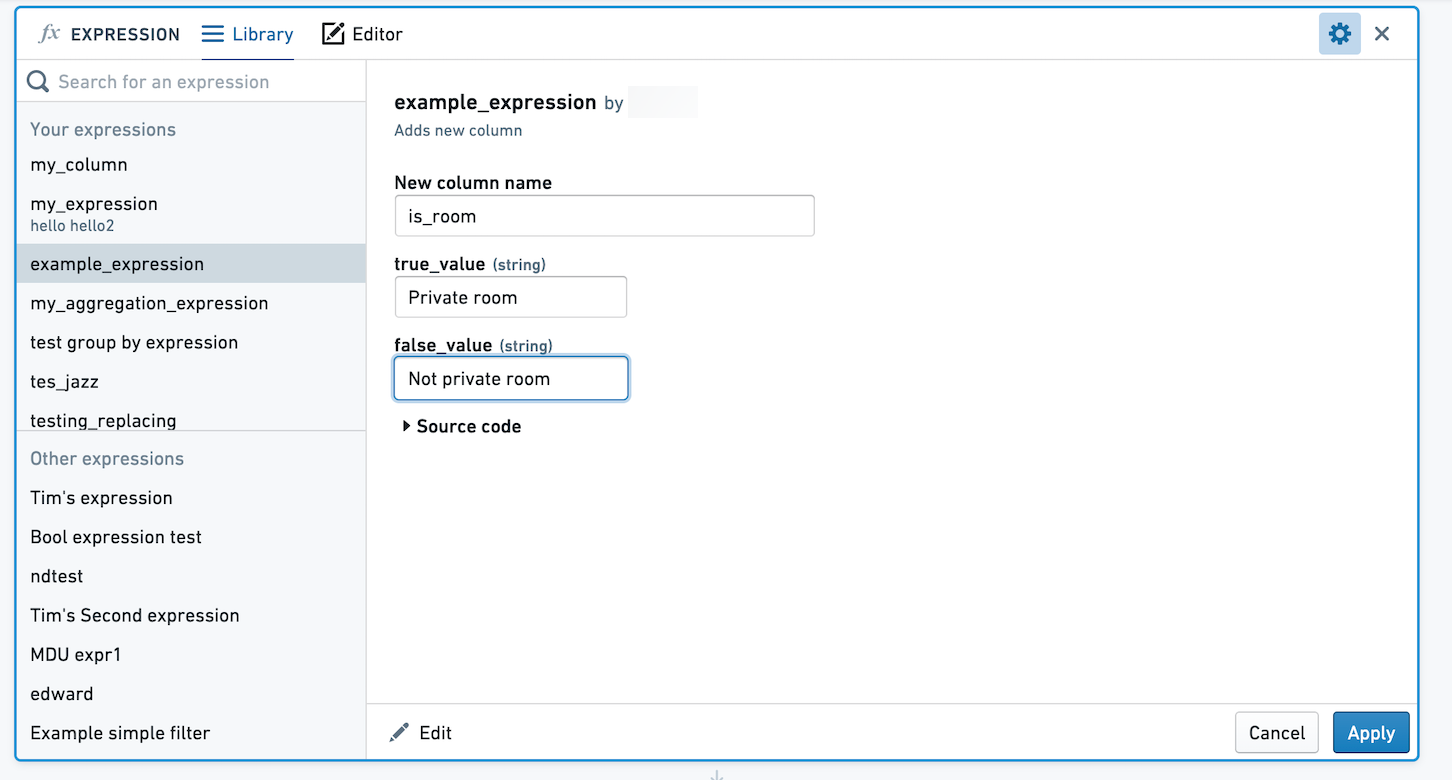
You can choose to save the expression with no arguments, or select values to define as arguments to the expression. If you save the expression with no arguments, when applied the expression's logic will remain exactly as you defined. If you choose to define arguments, users will be able to choose different values for the arguments. In the below image, we've made the True and False values parameterizable.
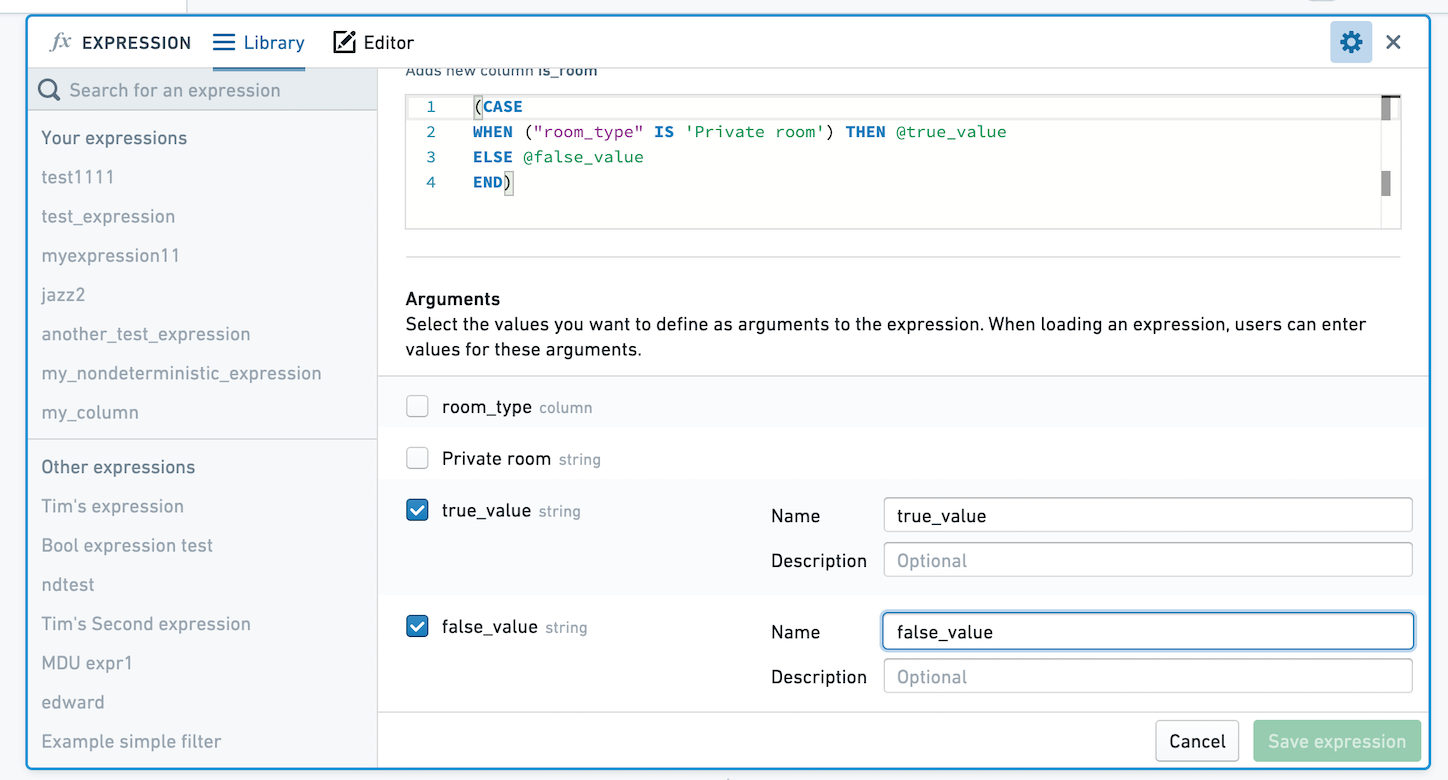
When you or another user selects this expression to apply, you'll be prompted to choose values for true_value and false_value. Here, these values are mapped to Private room and Not private room.
Saved Aggregate Expressions
Aggregate expressions are used to aggregate data based on zero or more group bys. If you save an Aggregate expression with zero group bys, users of the expression will be able to select an arbitrary number of column group bys.
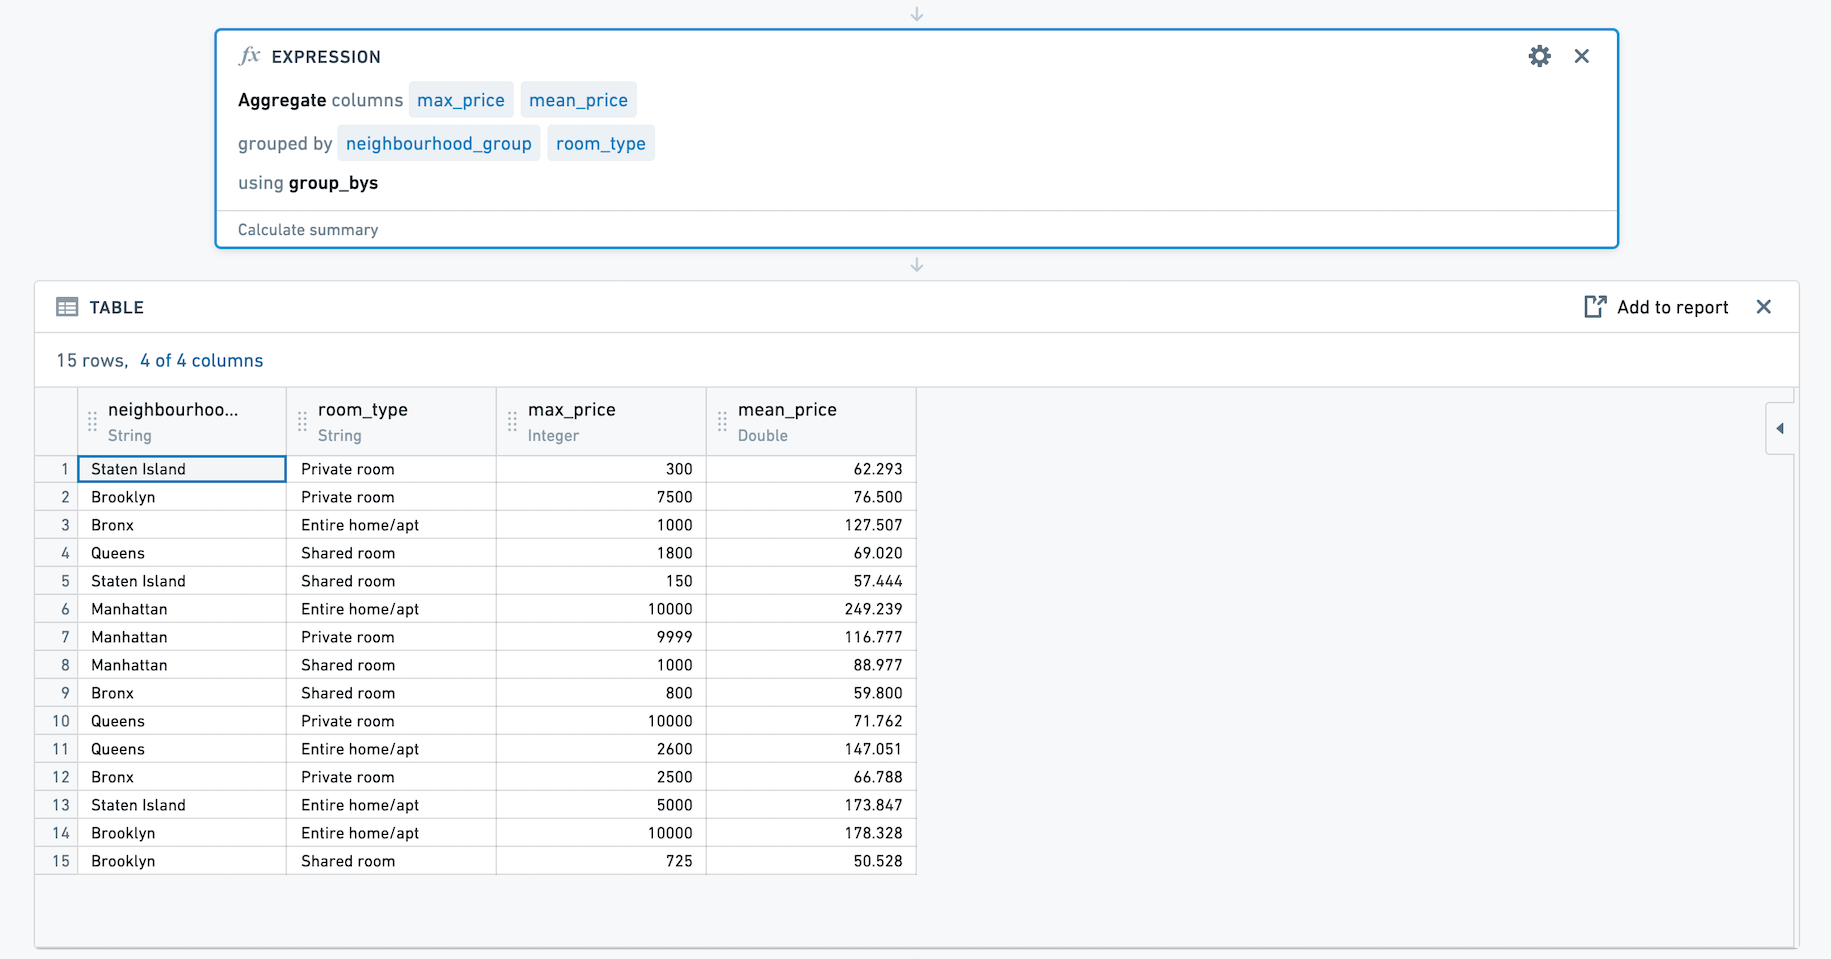
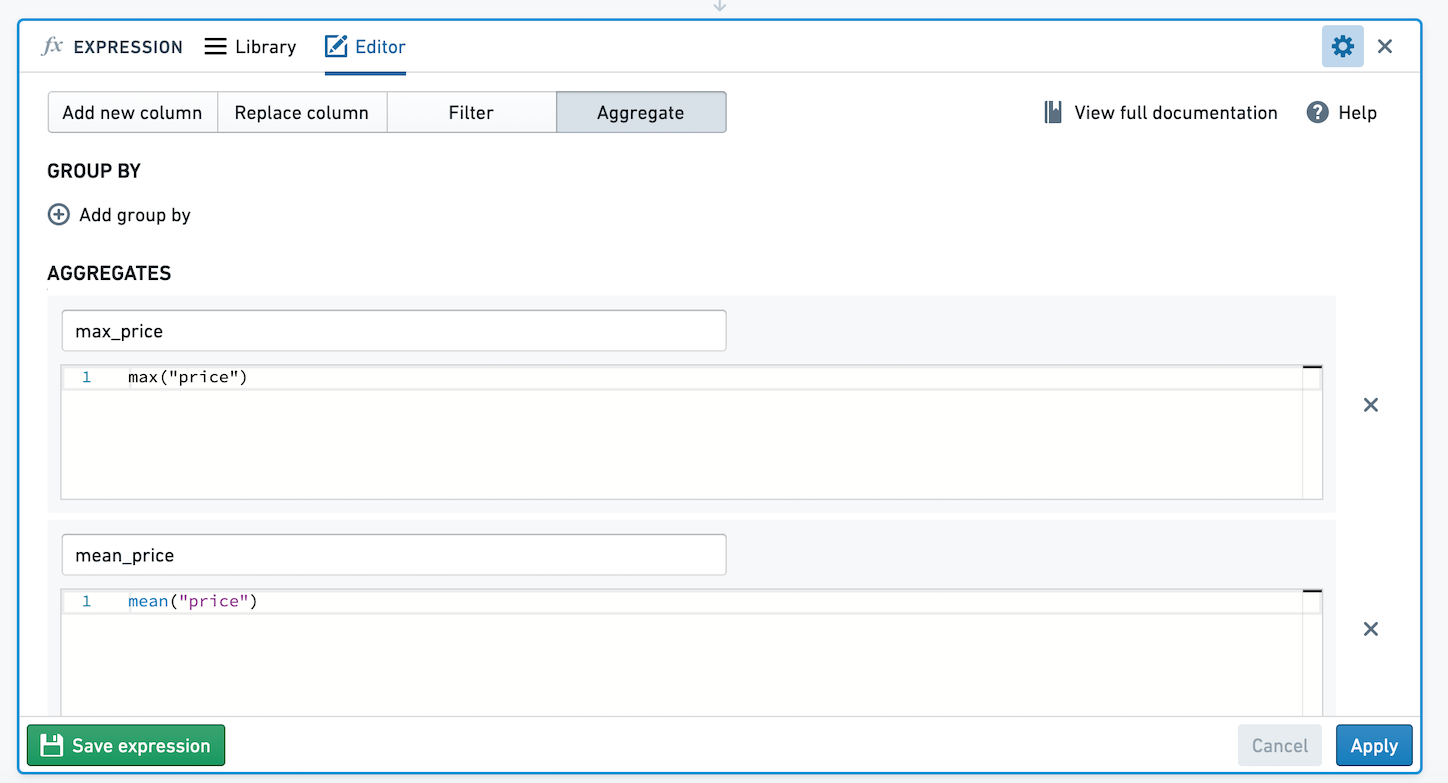
For example, below we have an aggregate expression with zero group bys and two aggregates using open source data from Inside Airbnb ↗. The aggregates calculate the mean and max of price. Let's save this aggregate expression.
When using this expression, we're presented with a column selector. We can choose to group by multiple columns. Here, we will calculate the mean and max of price for each combination of neighbourhood_group and room_type.
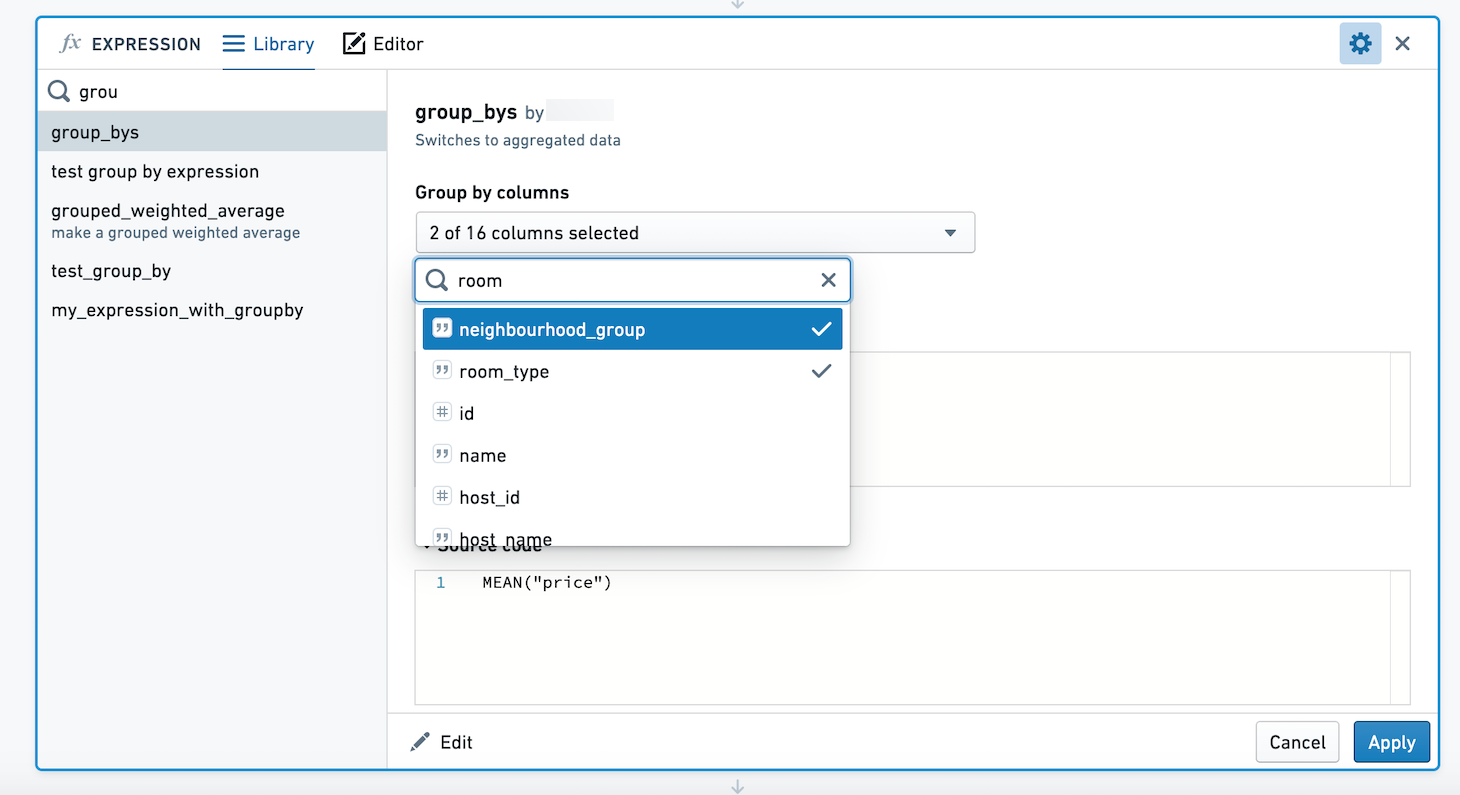
The resulting set has four columns, neighbourhood_group, room_type, max_price and mean_price.