- Capabilities
- Getting started
- Architecture center
- Platform updates
Derive relative dates
This guide will show you how to use Contour’s expression language to derive relative dates from your dataset.
In this case, we want to look at dates grouped by calendar week, and see rows that fall within the eight preceding weeks (i.e. not including the current calendar week).
To get there, we will derive a few intermediate columns:
- departure_week: determine the calendar week — which week of the year (1-52) this date falls on
- departure_year_week_as_integer: create an integer that is the year plus the calendar week (for example, “201501” is the first week of 2015)
- latest_calendar_week: find the most recent week in your dataset
And finally get to the column of interest:
- within_last_8_weeks: compare each date to latest_calendar_week to determine whether it falls within the eight preceding weeks (return true or false)
We’ll also derive a label column that can be used in charts to display the year and calendar week nicely: departure_week_label.
There are simpler ways to calculate a straightforward “falls within the last eight weeks,” but this guide is intended to give as many examples as possible (and to show how you might use Contour to conform to explicit requirements).
Deriving relative dates
Start with a dataset that has a date column. Here we’re using a column called departure_date_time in the original dataset. You can change the column names as appropriate to your dataset.
You may want to filter down to a range of a few months for faster loading. Then, click Table to open the table view. In the table editing view, click Expression to derive each new column.
Alternatively, you can add expression boards directly from the path, without navigating to the table view.
departure_week
Name the first column departure_week.
We will use the week_of_year function to determine the week of the year for each date in the departure_date_time column. For weeks 1-9, we’ll use case statements to format the numbers with a 0 in front. The final column expression should look like this:
Copied!1 2 3 4 5 6 7 8 9 10 11 12CASE week_of_year("departure_date_time") WHEN 1 THEN '01' WHEN 2 THEN '02' WHEN 3 THEN '03' WHEN 4 THEN '04' WHEN 5 THEN '05' WHEN 6 THEN '06' WHEN 7 THEN '07' WHEN 8 THEN '08' WHEN 9 THEN '09' ELSE CAST (week_of_year("departure_date_time") AS STRING) END
You can also simplify the above by using the left padding (lpad) function instead of case statements: lpad(week_of_year("departure_date_time"), 2, '0'). This will add a zero to the left of any value that needs it to ensure that every value has a total of two digits.
departure_year_week_as_integer
In this column we’ll concatenate the year to the value in the departure_week column we just derived.
We will use the year function to extract the year from each date in the departure_date_time column. Then we’ll add the departure_week column to the result, using || characters to concatenate them. Finally, we’ll cast the resulting value as an integer. The final column expression should look like this:
CAST (year("departure_date_time")||"departure_week" AS INTEGER)
latest_calendar_week
Now we’ll find the maximum value in the column we just created — the maximum value should be the latest week in the data. (We’ll assume that the data is updated regularly, so “latest week in the data” is roughly equivalent to the current week.)
The syntax is a window function. If you’re interested in learning more about window functions, you can read the SQL documentation ↗ or see the Window Functions documentation; otherwise, simply copy the function:
max("departure_year_week_as_integer") OVER ()
This will create a column that is simply the maximum value of the range, so it will be the same in every row.
within_last_8_weeks
To derive this column, we’ll use a couple comparison statements to check whether the date falls within the eight weeks before the latest week of data. If it does, use TRUE for the value of that row. Otherwise, FALSE.
Copied!1 2 3 4 5 6CASE WHEN ("departure_year_week_as_integer" < "latest_calendar_week") AND ("departure_year_week_as_integer" > ("latest_calendar_week" - 9)) THEN TRUE ELSE FALSE END
departure_week_label
This column simply presents the year and calendar week nicely as a string, to use in labeling charts. We’ll use the year function to extract the year from each date, then add “.CW” and the calendar week.
Copied!1year("departure_date_time") || '.CW' || "calendar_week"
Now that we have all the derived columns, click Table to exit the table view (or simply carry on in your analysis if you added expression boards directly to the path).
Using relative dates in charts
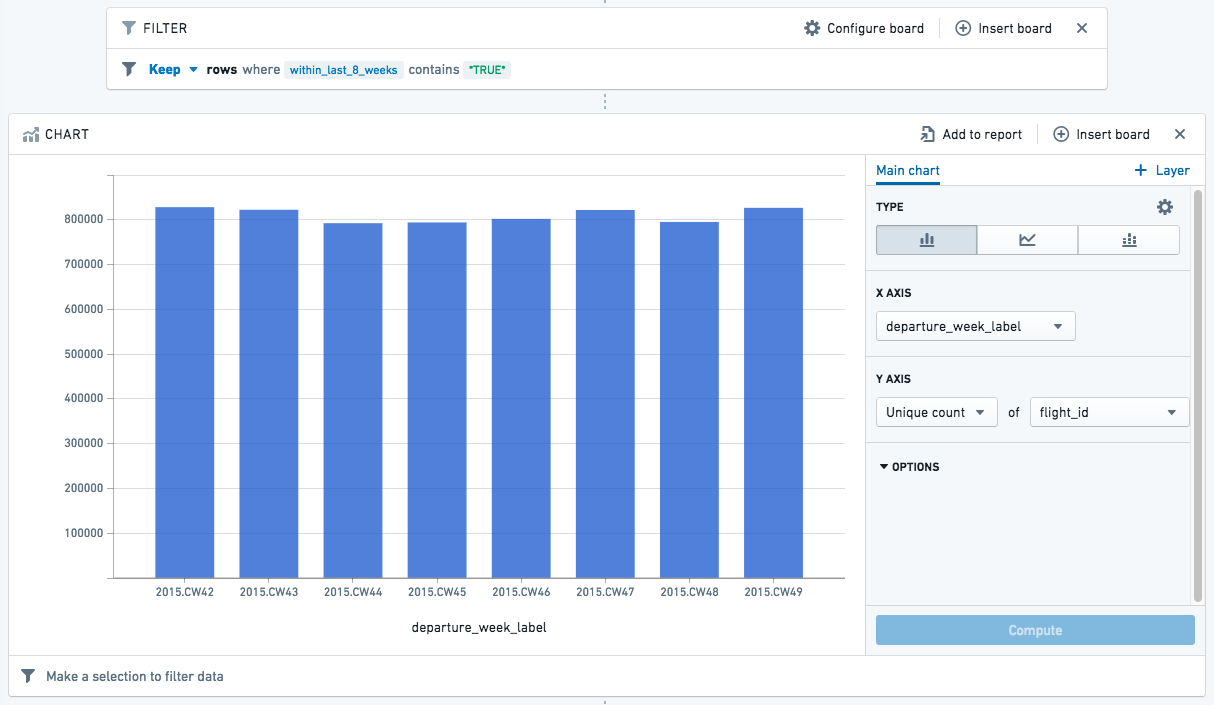
You can use a filter to keep only rows where within_last_8_weeks is true, then create a chart with the filtered dataset. In the following chart, we’ve used the departure_week_label to show the number of unique flights per week for the last eight weeks before the current date:
You can add this chart to a report, and refer to the chart regularly for an updated view of the past couple months.