Getting started
Creating a dashboard
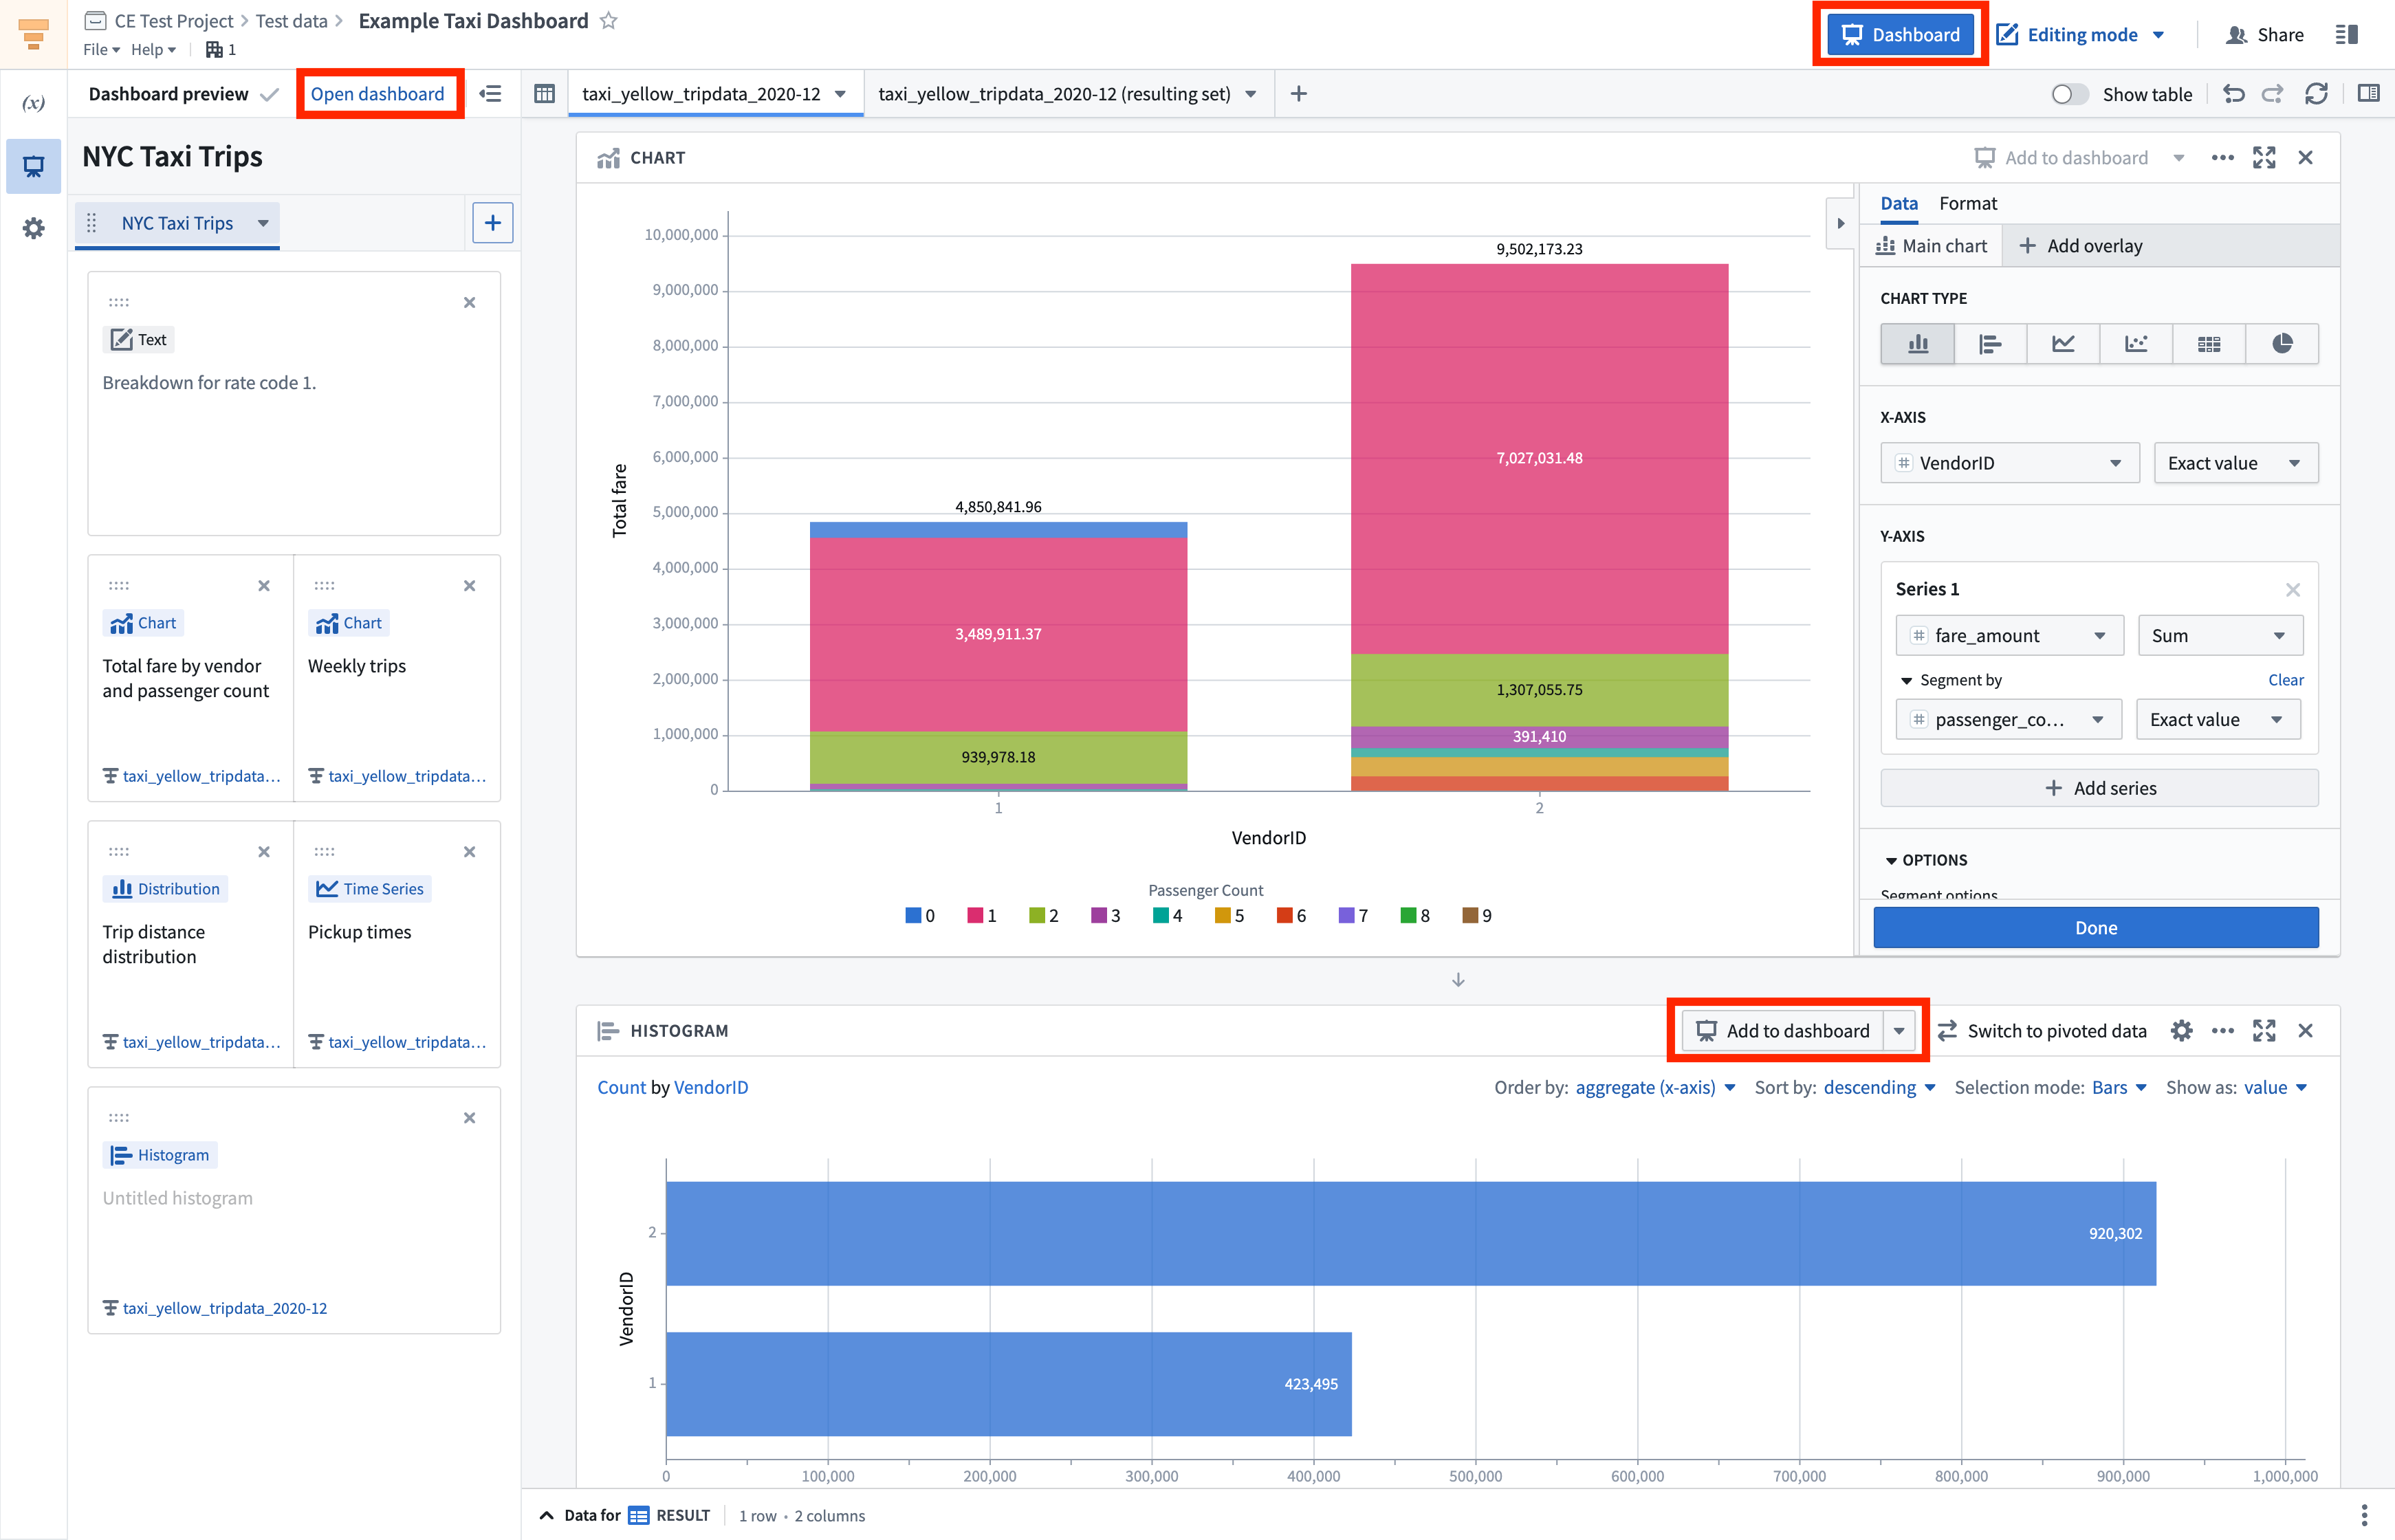
Each Contour analysis is associated with one Contour dashboard. To add a board to the dashboard, click the Add to dashboard button on the top right of the board. The dashboard preview in the left-hand panel will open and from there, you can add board titles, reorder boards using drag and drop, and name the dashboard. You can add all Visualize boards to a dashboard, excluding the Text and Map boards. See Adding text for information on how to add text descriptions directly to a dashboard.
To open the dashboard, select Open dashboard at the top of the dashboard preview panel, or click the blue Dashboard button on the top right of the analysis.
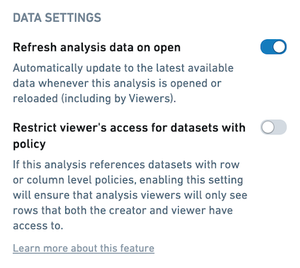
To ensure dashboard viewers always see the latest data when they open the dashboard, enable Refresh analysis data on open in the data setting for an analysis, as shown below.
Editing a dashboard
In edit mode, you can customize the dashboard by:
- Naming tabs, boards, and parameters
- Reordering boards and tabs
- Adding text
- Resizing boards and text
Tabs
You can organize your dashboard into tabs. Tabs can be renamed or dragged into a different order. Boards and text can be dragged from one tab to another.
When adding a board to the dashboard, click Add to dashboard to add it to the first available tab. Click the dropdown arrow next to the same button to add the board to a specific tab, or to create a new tab and add the board there.

Board reordering
Board reordering in a dashboard is purely cosmetic and will not impact your underlying analysis. For example, moving a Chart board above a Time series board in a dashboard will not move the corresponding Chart board above the corresponding Time series board in that dashboard’s source analysis. To reorder boards, drag by clicking and holding the leftmost button in the top right button menu for any board, as per below. You can add up to three boards per row.

Adding text
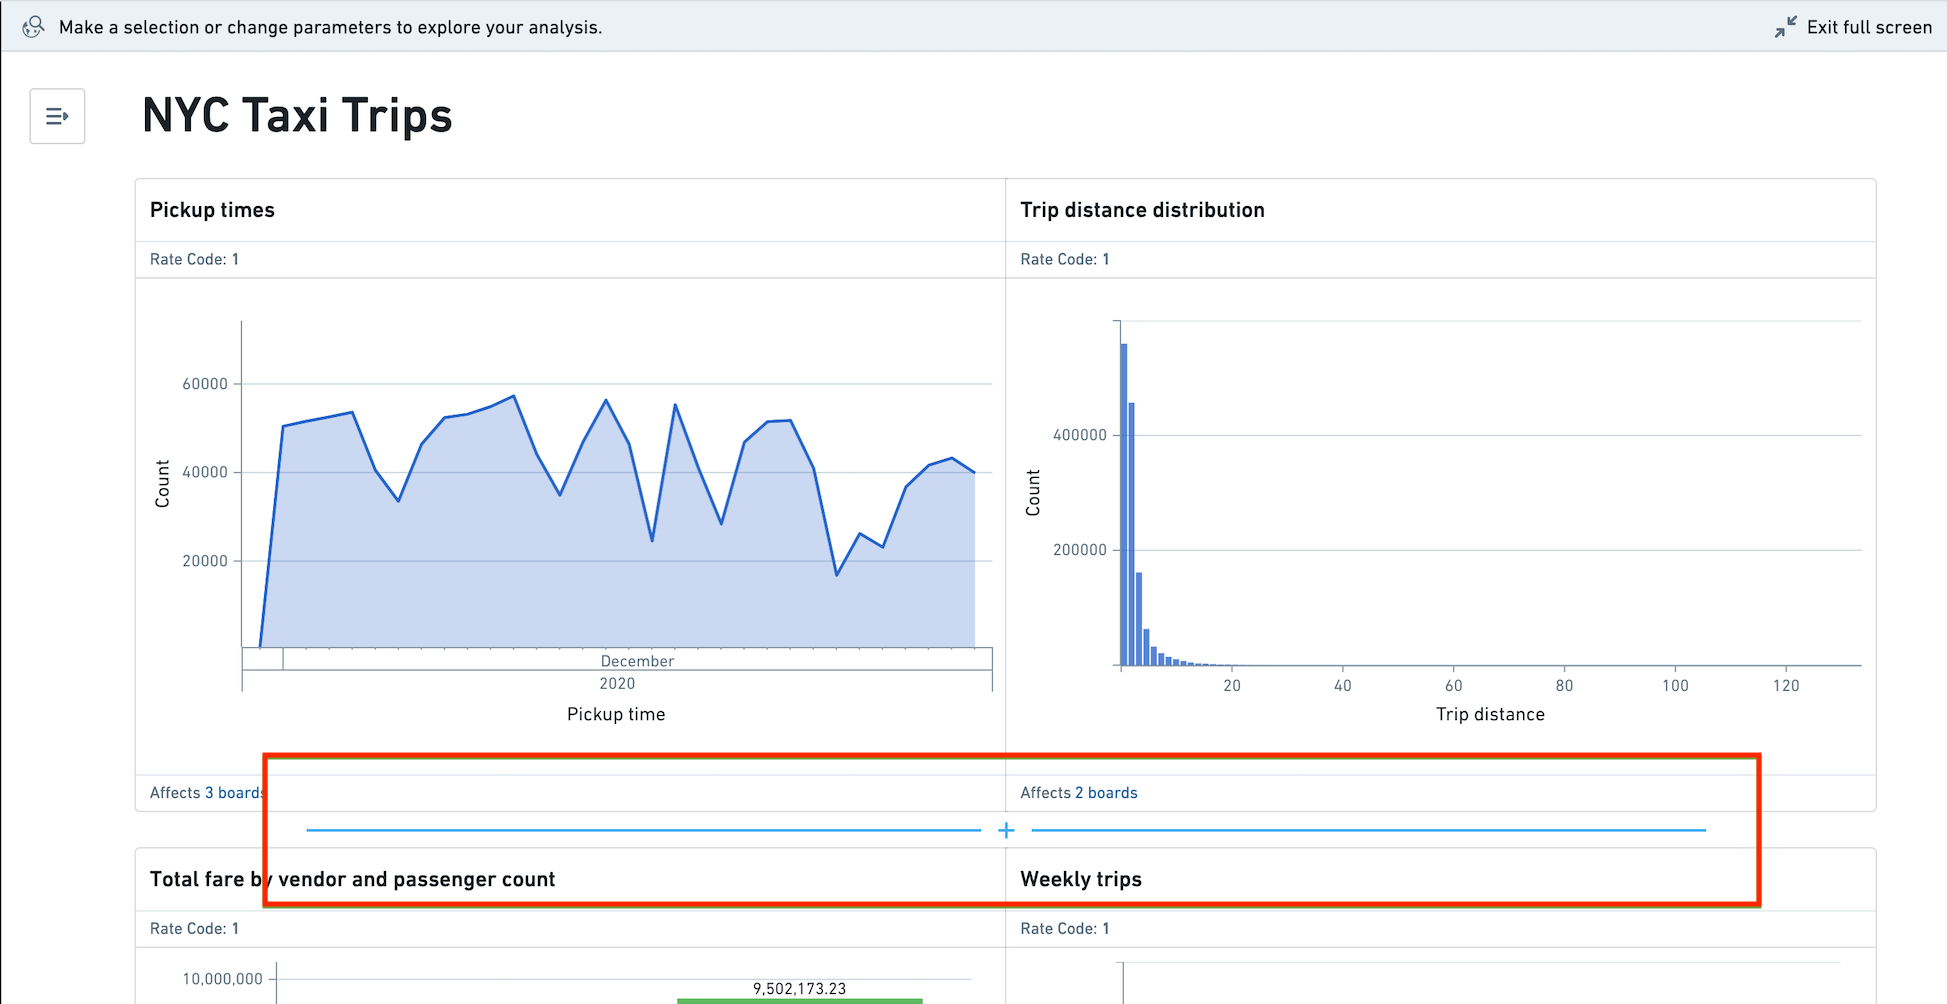
To add text to your dashboard, hover over the area you would like to place the text and click the blue + (plus) sign.
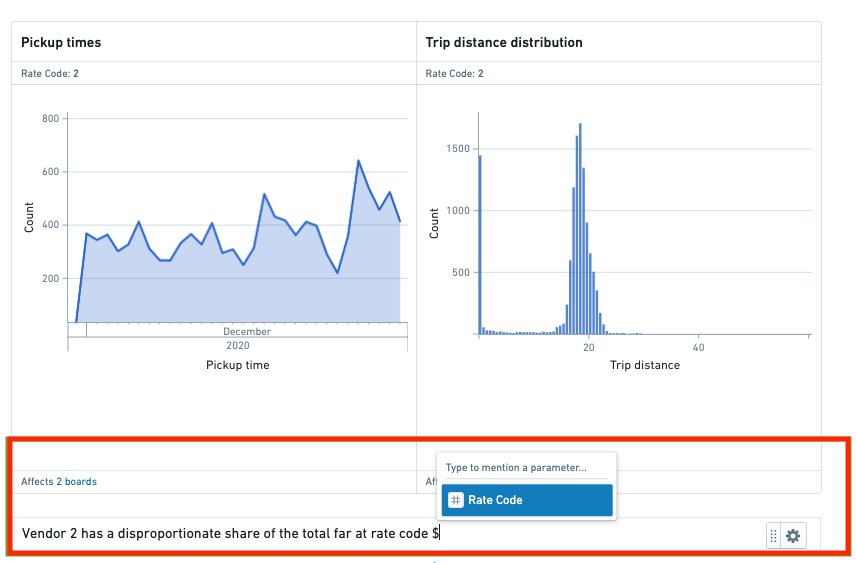
You can use parameters inline in text widgets, board titles, tab titles, and dashboard titles. To access the parameter list, type $ and choose a parameter name. As dashboard editors and viewers make parameter selections in the left panel, inline parameter values in text will update.
Resizing boards and text
When there are multiple boards or text boxes in a row, you can select Expand in the item's settings menu to increase its width. For rows with two items, this will result in a 2/3 - 1/3 layout, and for rows with three items, this will result in a 1/2 - 1/4 - 1/4 layout. To restore an item to its original size, select Collapse in the settings menu. Note that rows can only consist of a single item type - you cannot have a row with both boards and text boxes.
Viewing a dashboard
Dashboard viewers can make temporary dashboard overrides as they explore, such as choosing parameter values and making board selections. These temporary overrides do not persist after the dashboard is reloaded, and will not impact what other viewers see.
Parameter overrides
Dashboard viewers can change parameter values in the left sidebar. Viewers can see which parameters affect a given board in the board header.
Chart to chart filtering
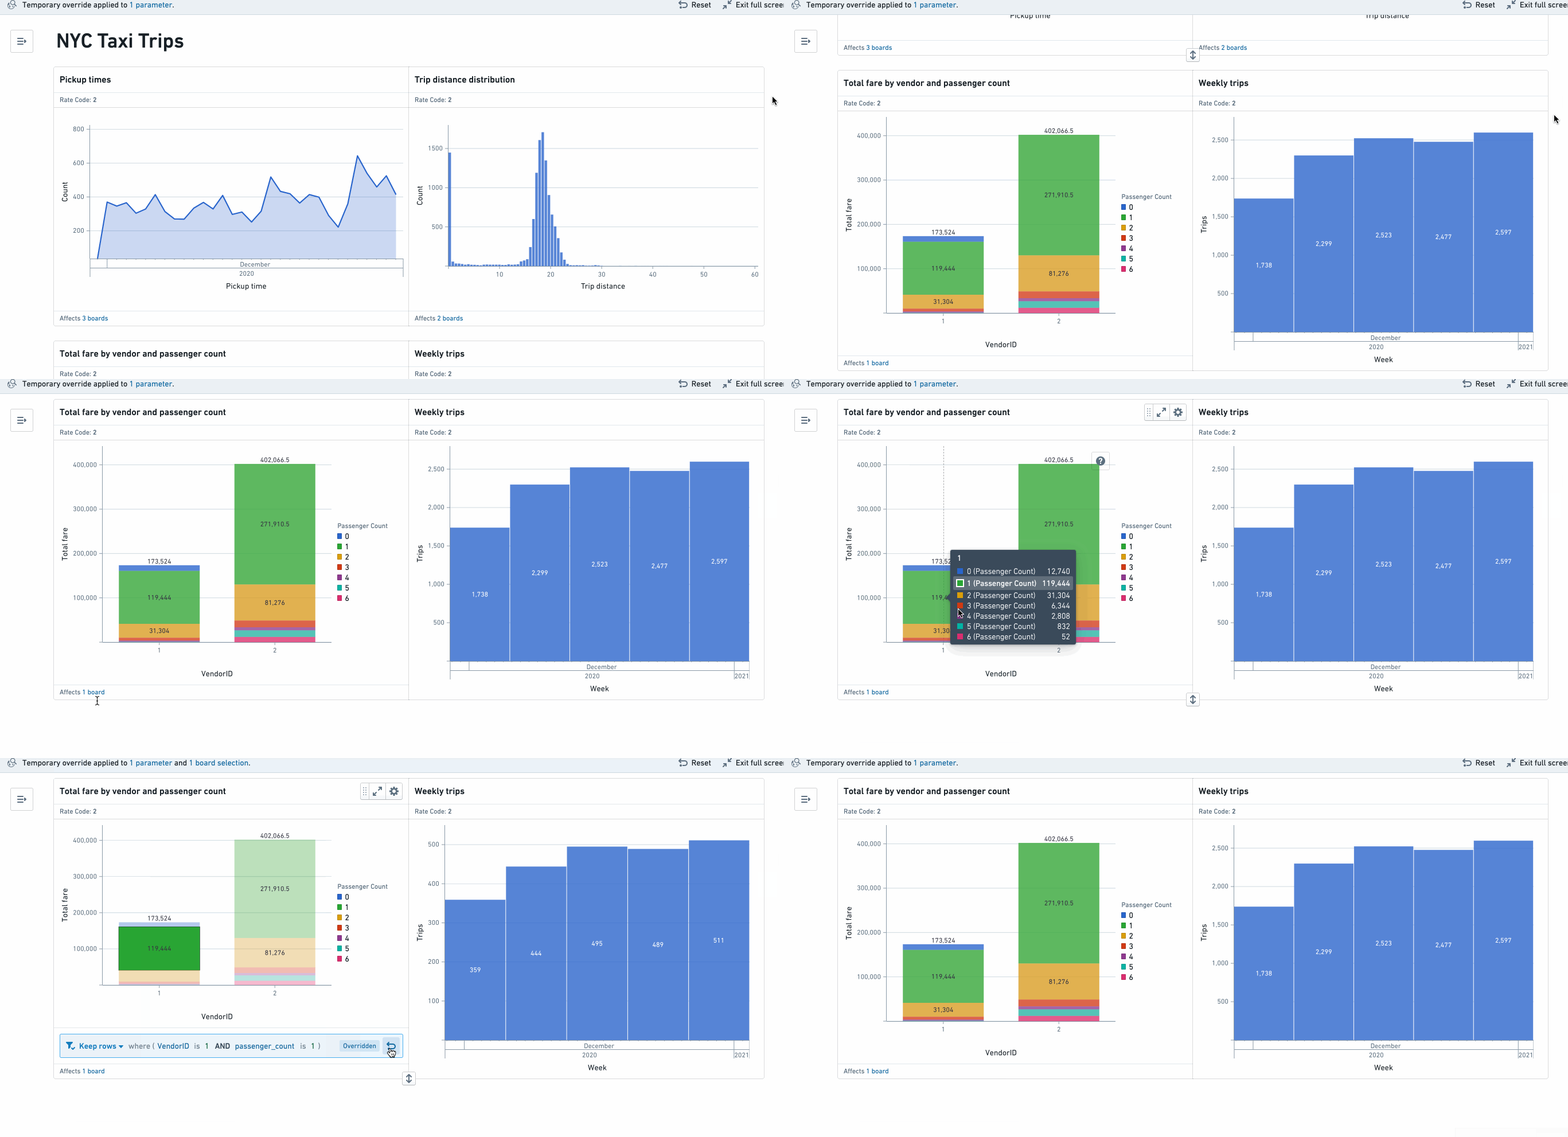
Dashboard viewers can make board selections that will propagate to any boards that are downstream within the analysis. This allows viewers to interrogate the data and drill into segments of interest. For a given board, the board footer displays which other boards would be affected by a selection.
In the video below, the user makes a selection on the board Total fare by vendor and passenger count, thereby affecting the downstream board Weekly Trips.
Share links
To create a share link with the current parameter values, click the link icon in the top right of the parameters panel. This will generate and copy your share link.
Boards fullscreen
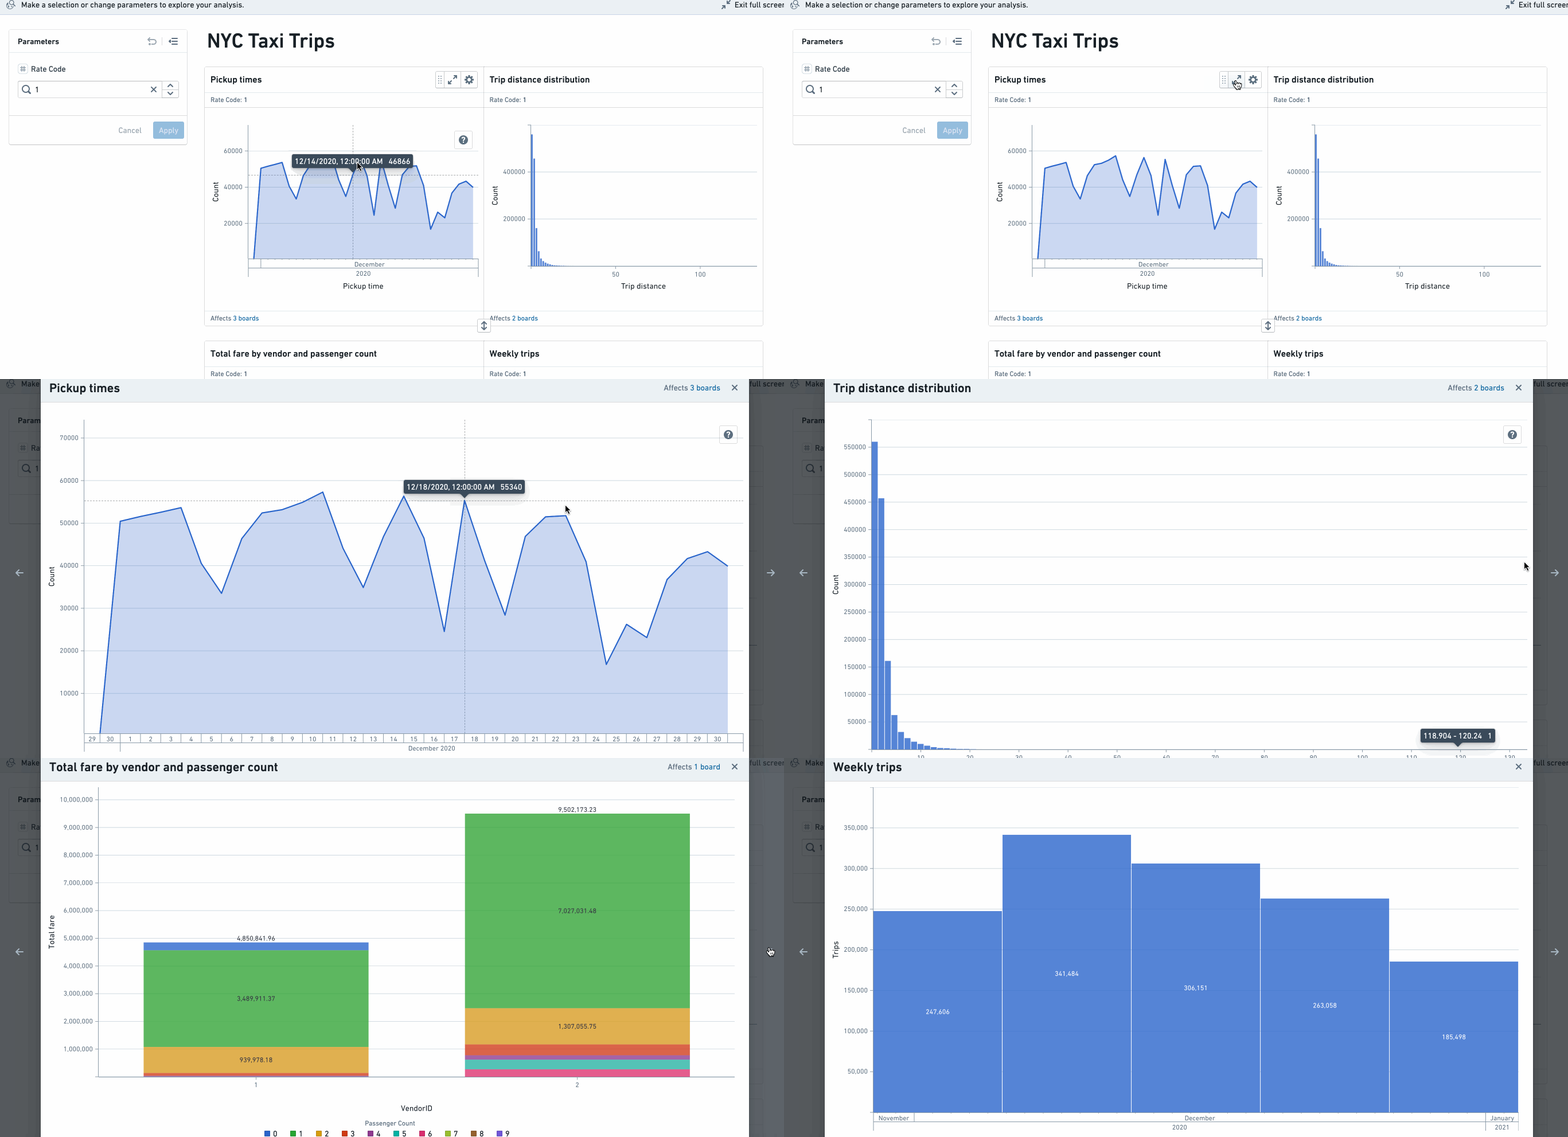
Viewers can also view each board in a fullscreen presentation mode. To enter full screen, select the  (expand) icon in the top right corner of any board. You can navigate through all boards in fullscreen mode using the arrow keys or arrow buttons.
Exporting a dashboard
Finally, viewers can export dashboards to PDF in either portrait or landscape orientation. Exported dashboards reflect the current state of the dashboard, including parameter overrides and chart to chart filtering. To export your dashboard, select a page orientation from the menu on the right side of the application header.
Foundry administrators can require users to provide justification before exporting a dashboard by configuring the Contour dashboard export checkpoint.