- Capabilities
- Getting started
- Architecture center
- Platform updates
Filter data
You can use many of Contour's visualization boards to filter as well as visualize data. This document explores how to use the histogram, filter, and chart boards to do so. Advanced users may want to look at Contour’s expression language for more powerful filtering options. The screenshots on this page use open source aviation data.
Histogram board
The histogram is one of the simplest ways to filter, and is recommended for visually exploring an unfamiliar dataset.
After creating a histogram, simply click on the bars to filter on them:
After selecting bars in the histogram, the bottom of the histogram will say Keep rows where column_name is value. This tells you that your working dataset has been filtered down to just the rows that have that value in that particular column. (You can use the dropdown selector to change Keep to Remove if you want to keep only rows that do not have that value.)
You can use multiple histograms in sequence to perform more complex filtering:

Filter board
The filter board works best when you already know what you’re looking for. The filter board is very flexible and lets you input exactly what you want to filter.
Add a filter board by choosing Filter from the action ribbon:
Click Add filter and select the name of the column on which you want to filter (you can start typing the column name to find it more quickly). Enter the values you want to filter to and add each value with the Enter key. Then click Save when you’re finished adding filters.
Use Keep if you want to filter down to only data that meet the set criteria, as shown below:
Use Remove if you want to exclude only data that meet the set criteria, as shown below:
Advanced comparisons
The above examples simply check whether a column value contains a word or phrase. However, there are many other comparisons available. Click where it says contains to see the full list, divided by category (click the heading names to change categories)
If you choose a column of a particular type (like a date or a number), Contour will automatically select the appropriate category for you:

Multiple data filters
- Use AND MATCHING if you want to filter to data that meet multiple conditions at the same time.
- Use OR MATCHING if you want to filter to data that meet multiple conditions but not necessarily at the same time/within the same row of data.
Adjusting filters
When someone creates a new analysis for a specific filter (e.g. carrier_code = DL), other people can easily replicate their analysis by changing the filter to their use case (e.g. carrier_code = UA) or removing the filter all-together to perform a global analysis.
In Foundry, analytical operations are applied to an entire column by default, in order to facilitate analysis of large datasets. If you would like to run an analysis on a smaller selection of rows (similar to selecting a specific cell range in Excel), filter the data down to the desired rows before applying the operations.
Wildcards in string filters
Some string filter types support the use of ? and * as wildcards. ? represents exactly one arbitrary character, while * represents a sequence of any number of arbitrary characters (that number can be 0).
The filters that support the use of wildcards are the following:
containscontains (with wildcards)is (with wildcards)
Despite the unintuitive naming, both contains and contains (with wildcards) support wildcards. The difference between these two filters is that contains allows wildcard characters to be escaped with two forward slash characters (\\), while contains (with wildcards) does not allow wildcard characters to be escaped. For example, a contains filter with value apples\\*pears will match the string apples*pears but not the string apples_pears. Conversely, there is no way to construct a filter that matches apples*pears but not apples_pears using a contains (with wildcards) filter, because the contains (with wildcards) filter will always treat * as a wildcard.
Because this difference in behavior between contains and contains (with wildcards) may not be obvious, Contour analyses with filter logic that depend upon this behavior can be difficult to understand and maintain. If you need to express a complex string match condition, we suggest using a matches (regular expression) filter instead of a contains filter with wildcard escaping.
Chart board
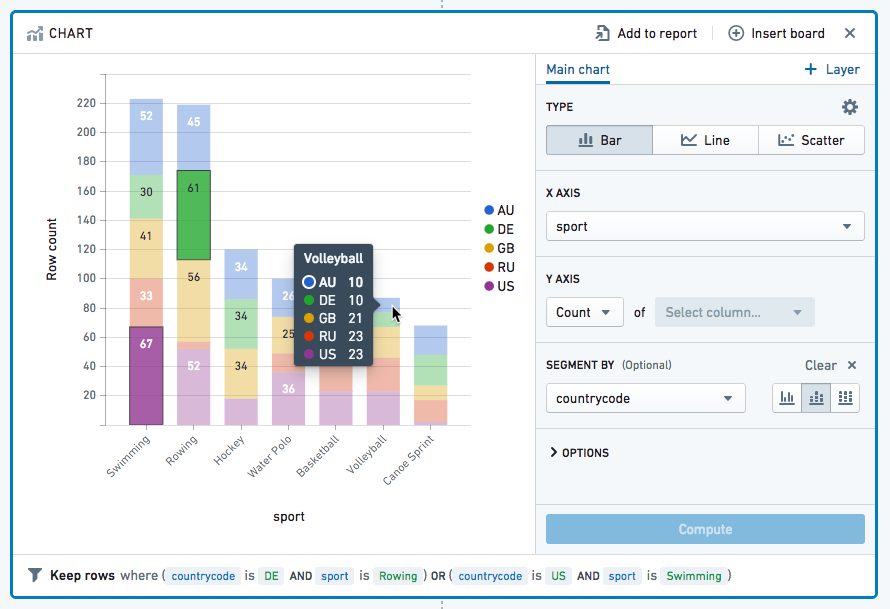
You can filter data on the chart by clicking on the chart area you'd like to filter; hold Ctrl on Windows or Cmd on macOS and click to select multiple segments. This will filter your working dataset down to your selection (similar to the behavior of histograms).
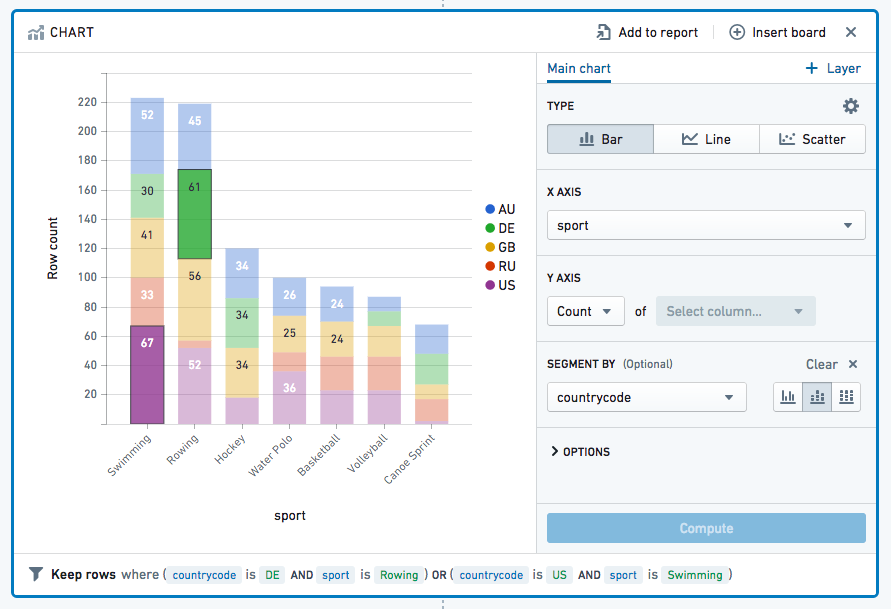
Hover the mouse cursor over a piece of data to see a key with the exact figure: