- Capabilities
- Getting started
- Architecture center
- Platform updates
Present visualizations
Once you have created a visualization in Code Workbook, you may want to present it to collaborators outside the context of a Code Workbook.
Add Visualizations to Notepad
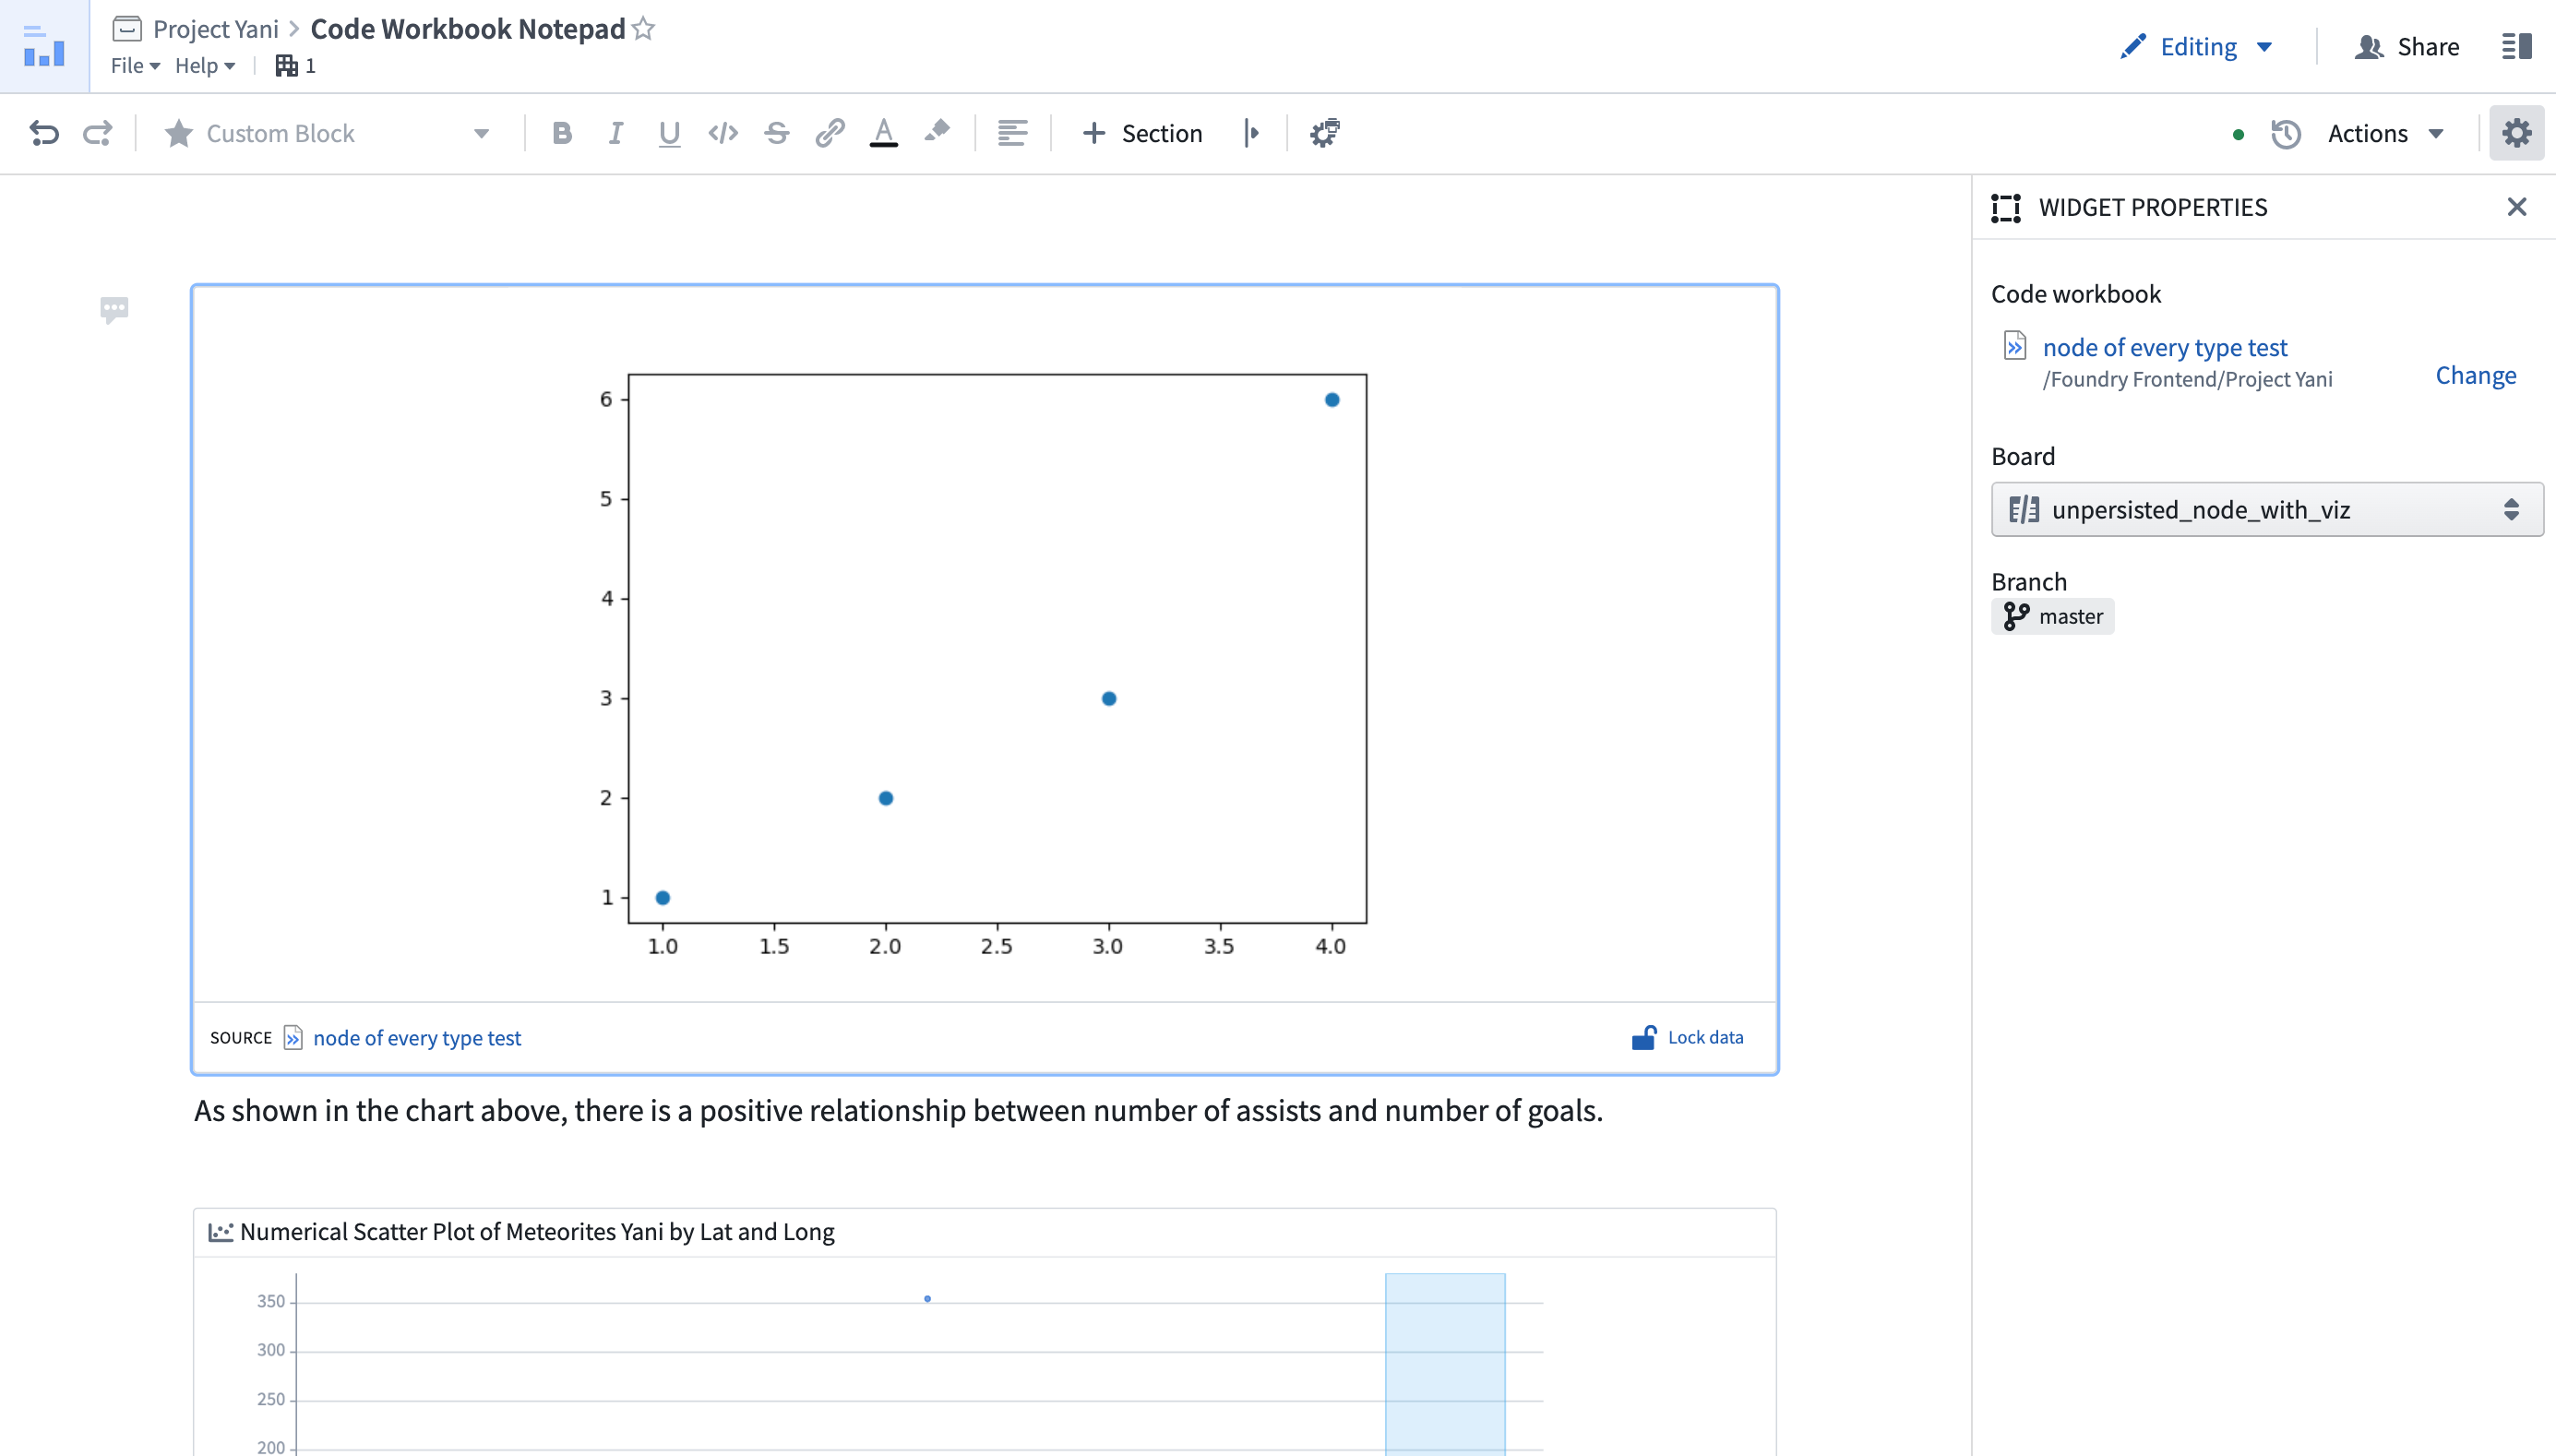
Visualizations generated in a Code Workbook can be presented in a Notepad document. You can embed various resources from across Foundry into a Notepad document, including Contour boards, Quiver canvases, and Code Workbook visualizations, and can annotate the document using text, tables, and images. You can also create Notepad templates, allowing users in a Workshop application to generate new Notepad documents based on a given blueprint. Learn more about Notepad.
You can add a Code Workbook visualization to a Notepad document by right-clicking a node on the graph and clicking Copy for Notepad. Now, the image is copied to your clipboard and can be pasted into any Notepad document.
Adding Visualizations to Reports
As of October 3rd, 2022, Foundry Reports is no longer available to new customers by default. Contact your Palantir representative if you have a use case that requires access to Foundry Reports. For existing users, Foundry Reports is still supported for creating dashboards with visualizations produced in a Code Workbook.
Visualizations generated in a Code Workbook can be added to a Foundry Report for presentation and collaboration. You can add a visualization to a Report by opening the Visualizations tab and clicking on Add to Report, or by right-clicking a node on the graph and clicking Add to Report.