Announcements
Map Layer Editor | Source GeoJSON from dataset
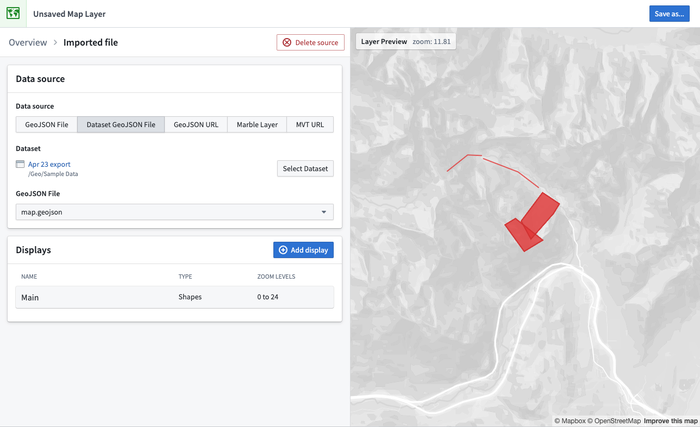
The Map Layer Editor allows users to create, edit, and preview map layers, which can be used in the Map application.
With this update, when creating a vector layer in the Map Layer Editor, you can now select GeoJSON files stored in datasets as a source of data. GeoJSON is one of the most common formats for geospatial data, so it's common to end up with GeoJSON files in datasets as a result of data connections or pipeline transforms. Use the Map Layer Editor to quickly create layers from your GeoJSON files and visualize your geospatial data!
External Transforms: Connect with code
Date published: 2023-02-23
Interface directly with external APIs using Python
Palantir Foundry now natively supports external transforms via Python code to facilitate API communication with third party providers. Instead of constructing a call with the Data Connection REST adapter to get data, you can interface directly with external APIs and make use of built-in SDKs where available. With the external systems setting enabled in Code Repository, you can:
- Bring external data into Foundry as regular datasets and benefit from the native Code Repository features.
- Use arbitrary libraries and SDKs encapsulating additional logic to facilitate complex queries to endpoints.
- Store, define, and apply the credential used for each API call directly from your repository.
Leverage SDKs to integrate data
External transforms enables you to leverage a third-party provider’s SDK directly for connecting to and interacting with external systems. This capability makes an API call from a Code Repository as seamless as if it were from your local development environment, saving you both time and effort. For instance, you can now forego writing logic to determine which records to connect to, how to get data from a particular format, or determine the frequency of ingests depending on the API. You can also use arbitrary libraries encapsulating additional logic — imported from the Libraries tab in Code Repositories — in your Python environment.
Set and forget connections and credentials
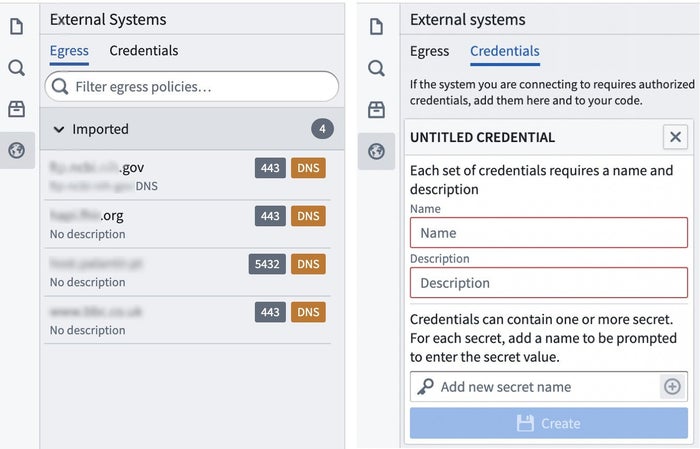
With external transforms, you can keep relevant information required for your external connection on hand and within the context of the code you author. Take advantage of existing connections — first configured in Control Panel — and store API access credentials directly from the External systems tab within Code Repository.
Author external transforms logic in Code Editor
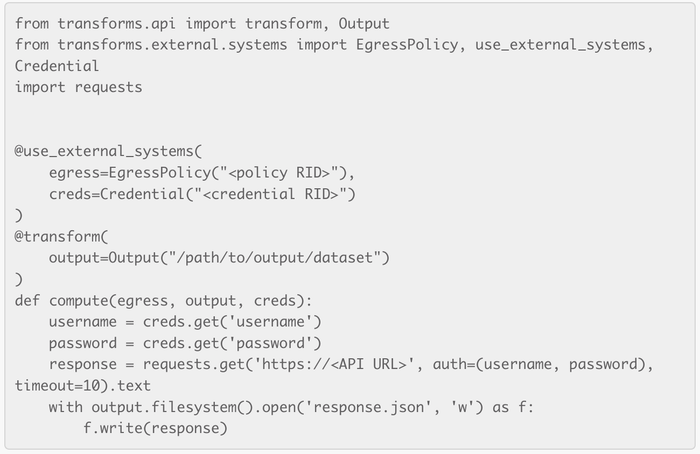
The set-up is simple. Just import the required libraries for writing transforms and external systems. The example shown here demonstrates an API call using External Transforms. The API response from this call is written to a Foundry dataset created in the specified location and ready for transformations in Code Repository or as part of your workflow in Foundry.
When should I use External Transforms?
External transforms allow you to make full use of developer tooling in Code Repositories, including branches, checks and CI, debugging, and release management as you would for regular data transformations in Foundry.
Use external transforms to leverage the ability to bring external data to Foundry as a regular dataset, use arbitrary libraries and take advantage of native SDKs.
For more information on how external transforms can be enabled and written, review the calls to external systems documentation.
Quiver: Custom visualization with Vega Plots
Date published: 2023-02-14
Create custom data visualizations in Quiver
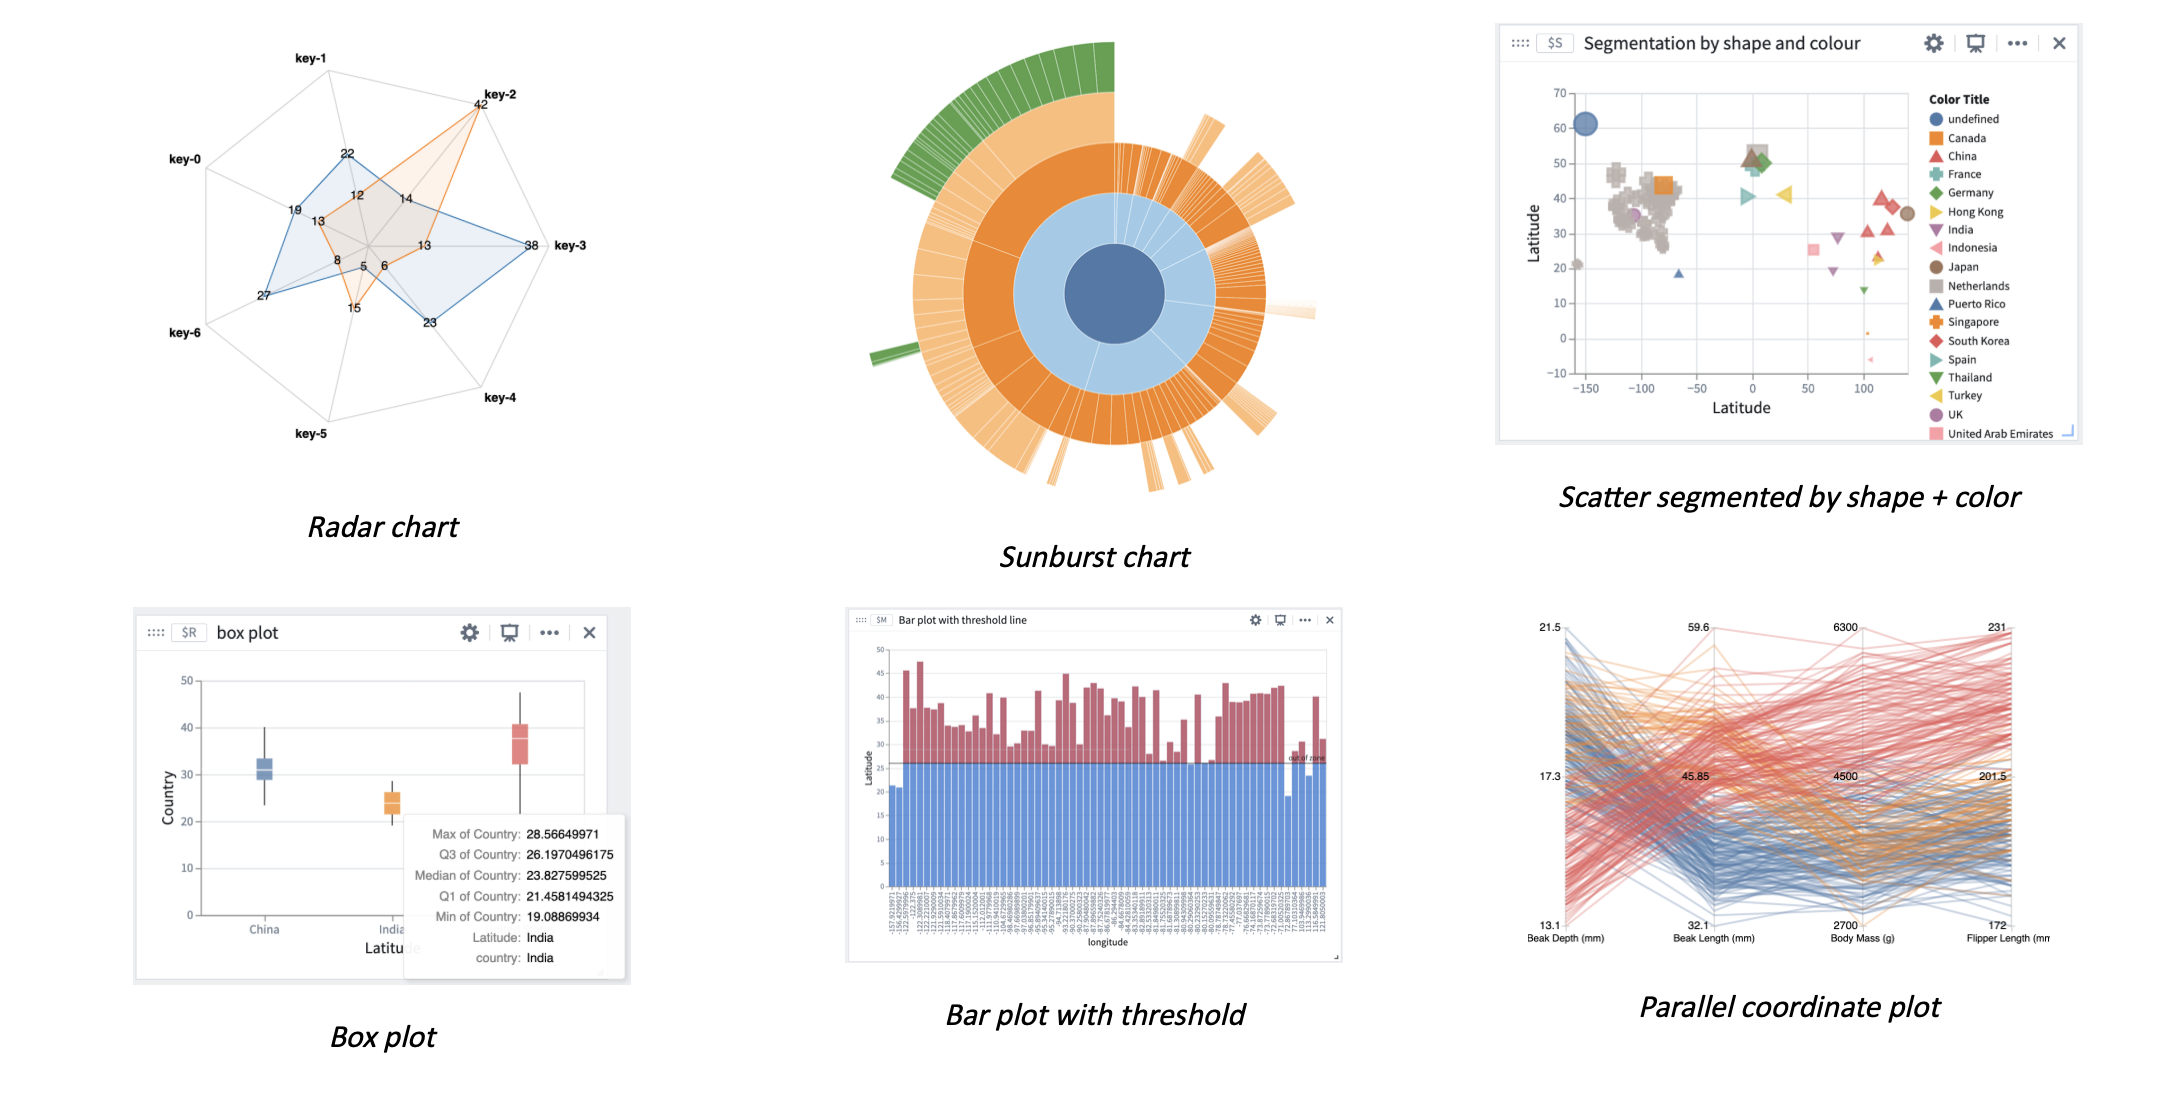
A rich set of visualization options are now available for data presentation in Quiver with Vega or Vega-lite plots. Vega is a visualization grammar that opens up a range of additional options to view your data on top of the Ontology and in other supported Quiver data sources.
In addition to the existing time series charts and objects charts, you can now create custom visualizations such as box plots, sunbursts, radar charts, and more. Vega plots can also be easily embedded in other applications, such as Workshop, where a Quiver dashboard can be added.
Use transform tables to create a Vega or Vega-lite plot
Vega plots can be created in Quiver from the main Chart toolbar or as a consequent action for transform tables. Transform tables are the primary input to Vega plots in Quiver and their use ensures that data can be loaded on the front-end with a consistent and standardized format, regardless of originating data source. Transform tables are also a useful tool for data preprocessing, such as deriving new columns, unioning, joining, or grouping. As a reminder, transform tables can currently be created from object sets, pivot tables, bar plots, and arrays.
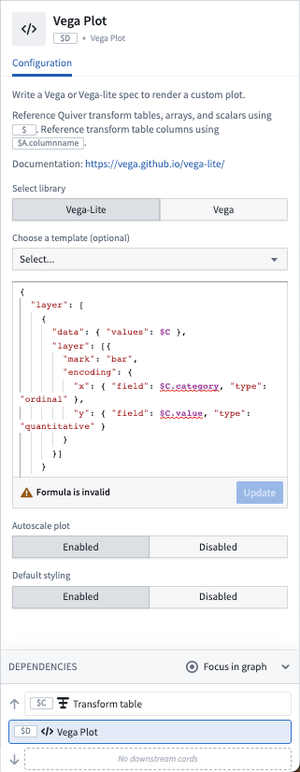
Reference transform tables in the Vega plot using their global identifier, for example $A. To reference specific columns in the transform table, reference using $A.column_name notation. Most Vega specifications start out by passing a transform table reference into the values key of the data section. Where applicable, arrays and scalar values can also be passed into the Vega plot using $ notation.
There are a number of preset Vega template specifications available for selection to pre-populate the JSON spec. Simply replace the referenced global identifiers with that of your desired transform table.
When should I use Vega or Vega-lite plots?
Use Vega and Vega-lite plots to visualize data from the Ontology and to present in Palantir Foundry applications wherever Quiver dashboards are supported.
Get started in Quiver with built-in design templates such as bubble, box, waterfall, sunburst and a number of other types of plots, or author your own. For authoring common visualizations in a more concise way, consider using the Vega-Lite library.
Review the Vega plot documentation located within the Quiver collection to learn more. For design inspiration and more advanced usage cases, review Vega ↗ and Vega-lite’s ↗ own documentation for a variety of visualization designs.
Workshop: New Links Widget
Date published: 2023-02-13
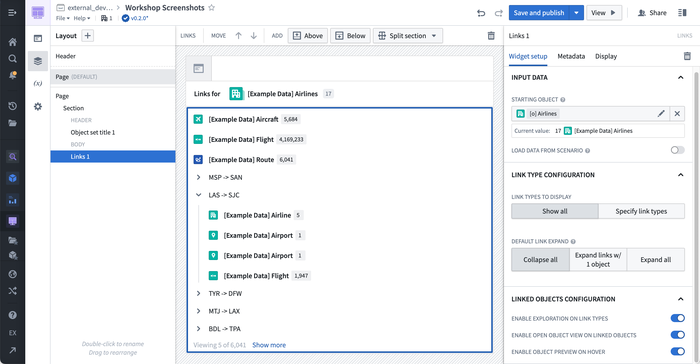
The new Workshop Links widget allows builders to display the links of an object set variable in a widget. Users can then drill down through links and linked objects, preview object properies, and open sets of linked objects for further exploration in Object Explorer.
Application builders can choose the input object set and select which links are shown, expanded, and sorted by default.
[Beta] Introducing Use Cases: Organize and build
Date published: 2023-02-06
Note that this is an announcement for a beta capability and therefore this application or feature may not be available on all Foundry enrollments.
Project overflowing with object types and actions types are used in your use case? Can't find input and output datasets when they're spread across projects? Or just looking to clean and organize the resources in your use case? The Use Case app provides a new framework to organize and consolidate the key resources and object types within a project.
The Use Case app solves two critical workflows; it guides new application builders by providing rails around creating workflows on top of the Ontology and it provides visibility and organization as builders prepare their use case for production.
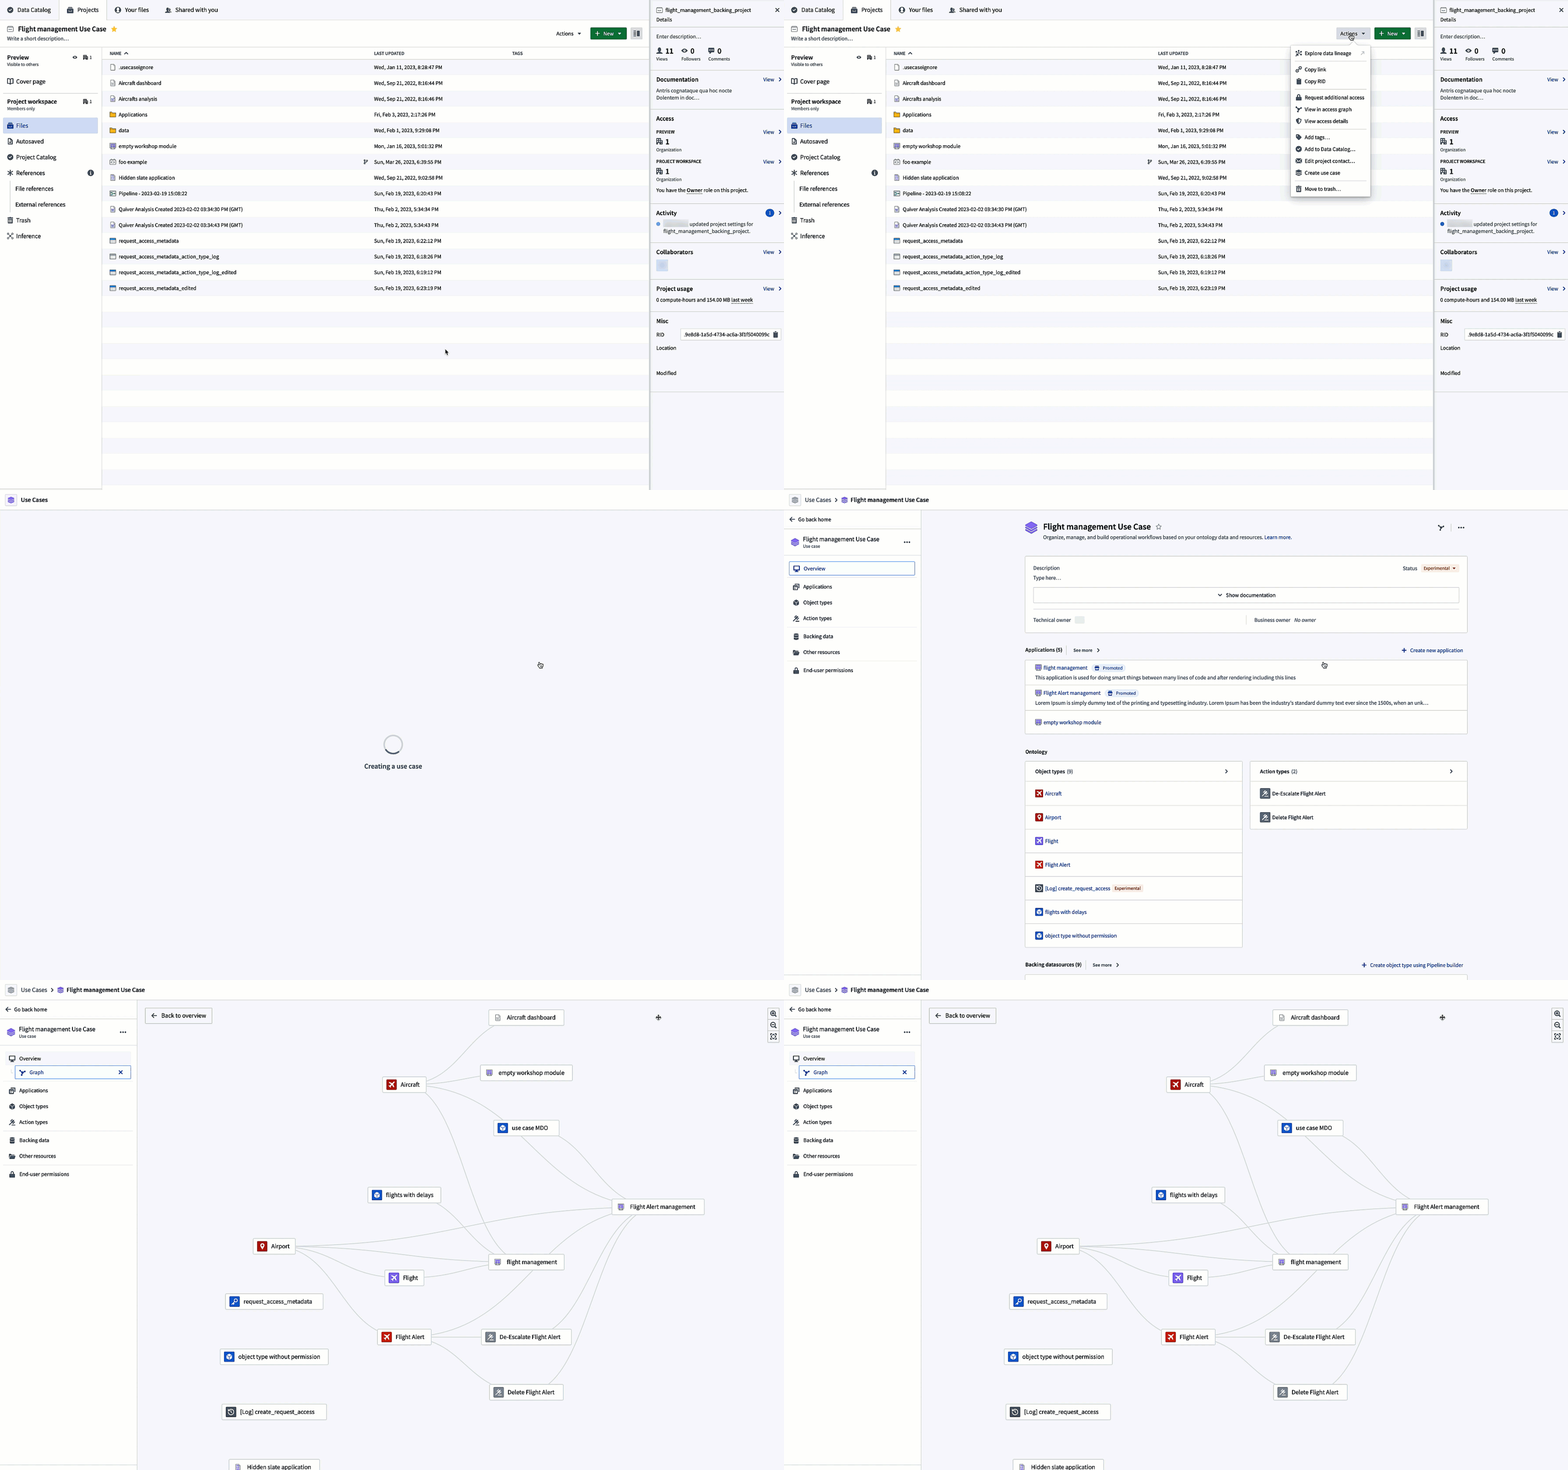
Visibility improves in both directions - the Use Case app gives a top-down view of resources and how they're related in the project, along with helpful rails and best practices for ensuring a use case is production-grade. Use Cases also show up in the Ontology Management App dependency view, making it easy to see all the various projects using any given Object Type.
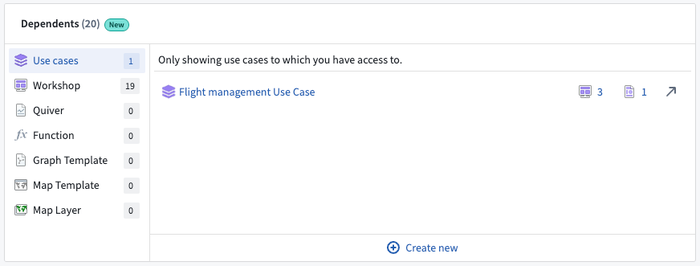
Dive in by creating a new Use Case or migrating an existing project. You'll find the Use Case app in the Application Portal.
Additional highlights
APIs
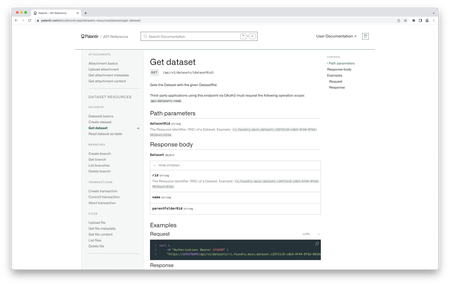
Dataset endpoints | APIs for Foundry datasets (including branches, transactions, and files) are now generally available. Previously, these endpoints were in public preview.
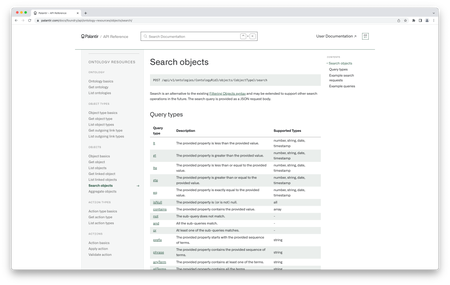
Search and aggregate objects | New "search objects" and "aggregate objects" endpoints are now generally available. Previously, these endpoints were in public preview.
Analytics | Contour
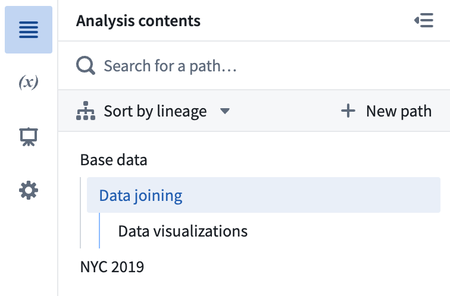
Enable contents side panel | Added a new sidebar panel to view the contents of the current analysis. Use this view to filter, organize, reorder, and navigate to paths in an analysis. The sidebar panel enables easy drag and drop reordering of paths within an analysis. For example, you can view the relationship between paths and explore which paths start from the results of other paths in the analysis.
Path descriptions | Paths can now be annotated with custom descriptions to describe their contents or purpose within the context of an analysis. To add a description, select the "Click to add a description" field at the top of a path.

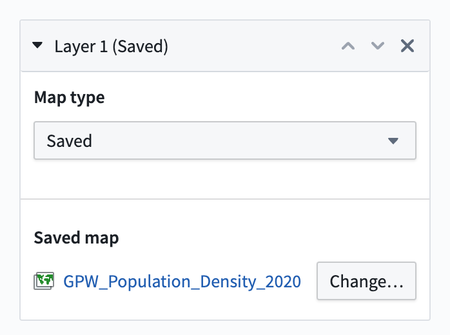
Add saved layers to Contour map board | Added a new layer type for saved layers to the new map board. You can now choose a saved map layer from your files to add to your map board.
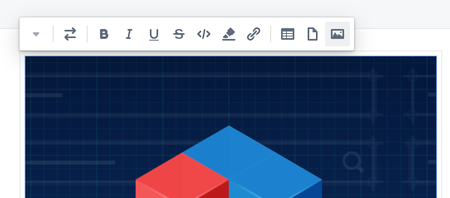
Add embedded images to Contour dashboard text cells | Images can now be embedded into text cells of dashboards. To add an image, navigate into a text cell and then select the picture icon in the toolbar that appears.
Analytics | Quiver
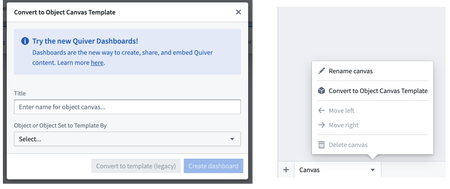
Remove creation of object canvas templates | Removed the option to create a new Object Canvas Template, as part of the transition to dashboards. Selecting New canvas now always creates a free form canvas. Existing templates will continue to exist and be editable, and converting a Free form canvas to an Object canvas templates is still possible using Convert to object canvas template, which will first prompt users to consider creating a dashboard instead.
App Building | Slate
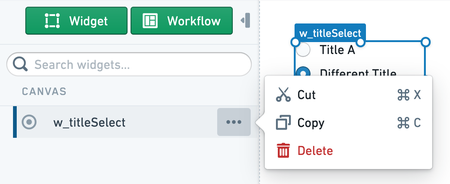
Copy widgets from the sidebar | You can now copy widgets into your clipboard directly via the sidebar in a new context menu.
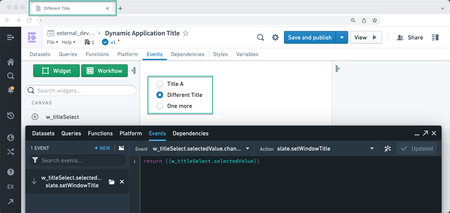
Add document title service for changing Slate tab title | You can now dynamically change the browser tab title by setting the slate.setWindowTitle Action in the Events panel.
App Building | Workshop
Pivot Table: support default sorting by aggregation column | Within the Pivot Table widget, builders can now configure default sorting criteria by either grouping or aggregation column. Multi-column default sorts are also supported.
Chart XY: Support for resizable scatter chart bubbles | Users can now dynamically or statically define the size of scatter chart bubbles within the Chart XY.
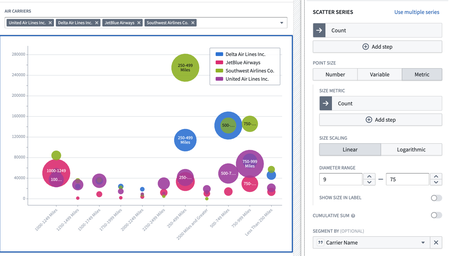
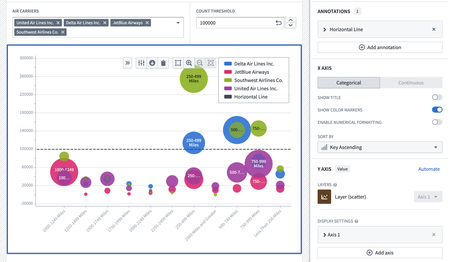
Chart XY widget: Support variables in chart annotations | Annotation series can now be both statically defined and variable-backed In the Chart XY widget. For example, a chart could be configured to have a dynamic annotation that represents a variable threshold / limit that changes as different objects are selected.
Data Integration | Pipeline Builder
Adding a new Aggregate multiple columns board | Added a new transform board called Aggregate multiple columns that allows for defining an aggregation expression and applying it on selected columns based on a condition statement.
Ontology | Object Explorer
Improved Object View editor start-up performance | The Object View Editor application has undergone a series of performance improvements, greatly improving the start-up time and reducing the amount of data it loads. Customers with more mature Ontologies should expect to see greater improvements, with load times being reduced from potentially upwards of 10 seconds down to consistent sub-second times.