- Capabilities
- Getting started
- Architecture center
- Platform updates
Announcements
Object Monitoring: Automated workflows
Date published: 2023-01-26
Trigger automated workflows for changes in business data
The Object Monitoring application is designed to keep users informed and enable automated workflows or alerting based on organizational events revealed in updates to data.
Palantir Foundry users can now use the Object Monitoring application to set up automatic notifications or trigger Actions whenever there are defined object data changes in the Foundry Ontology. Object monitors track saved searches and objects for users, run on top of data and can be incorporated into Foundry applications as monitoring and alerting functionality.
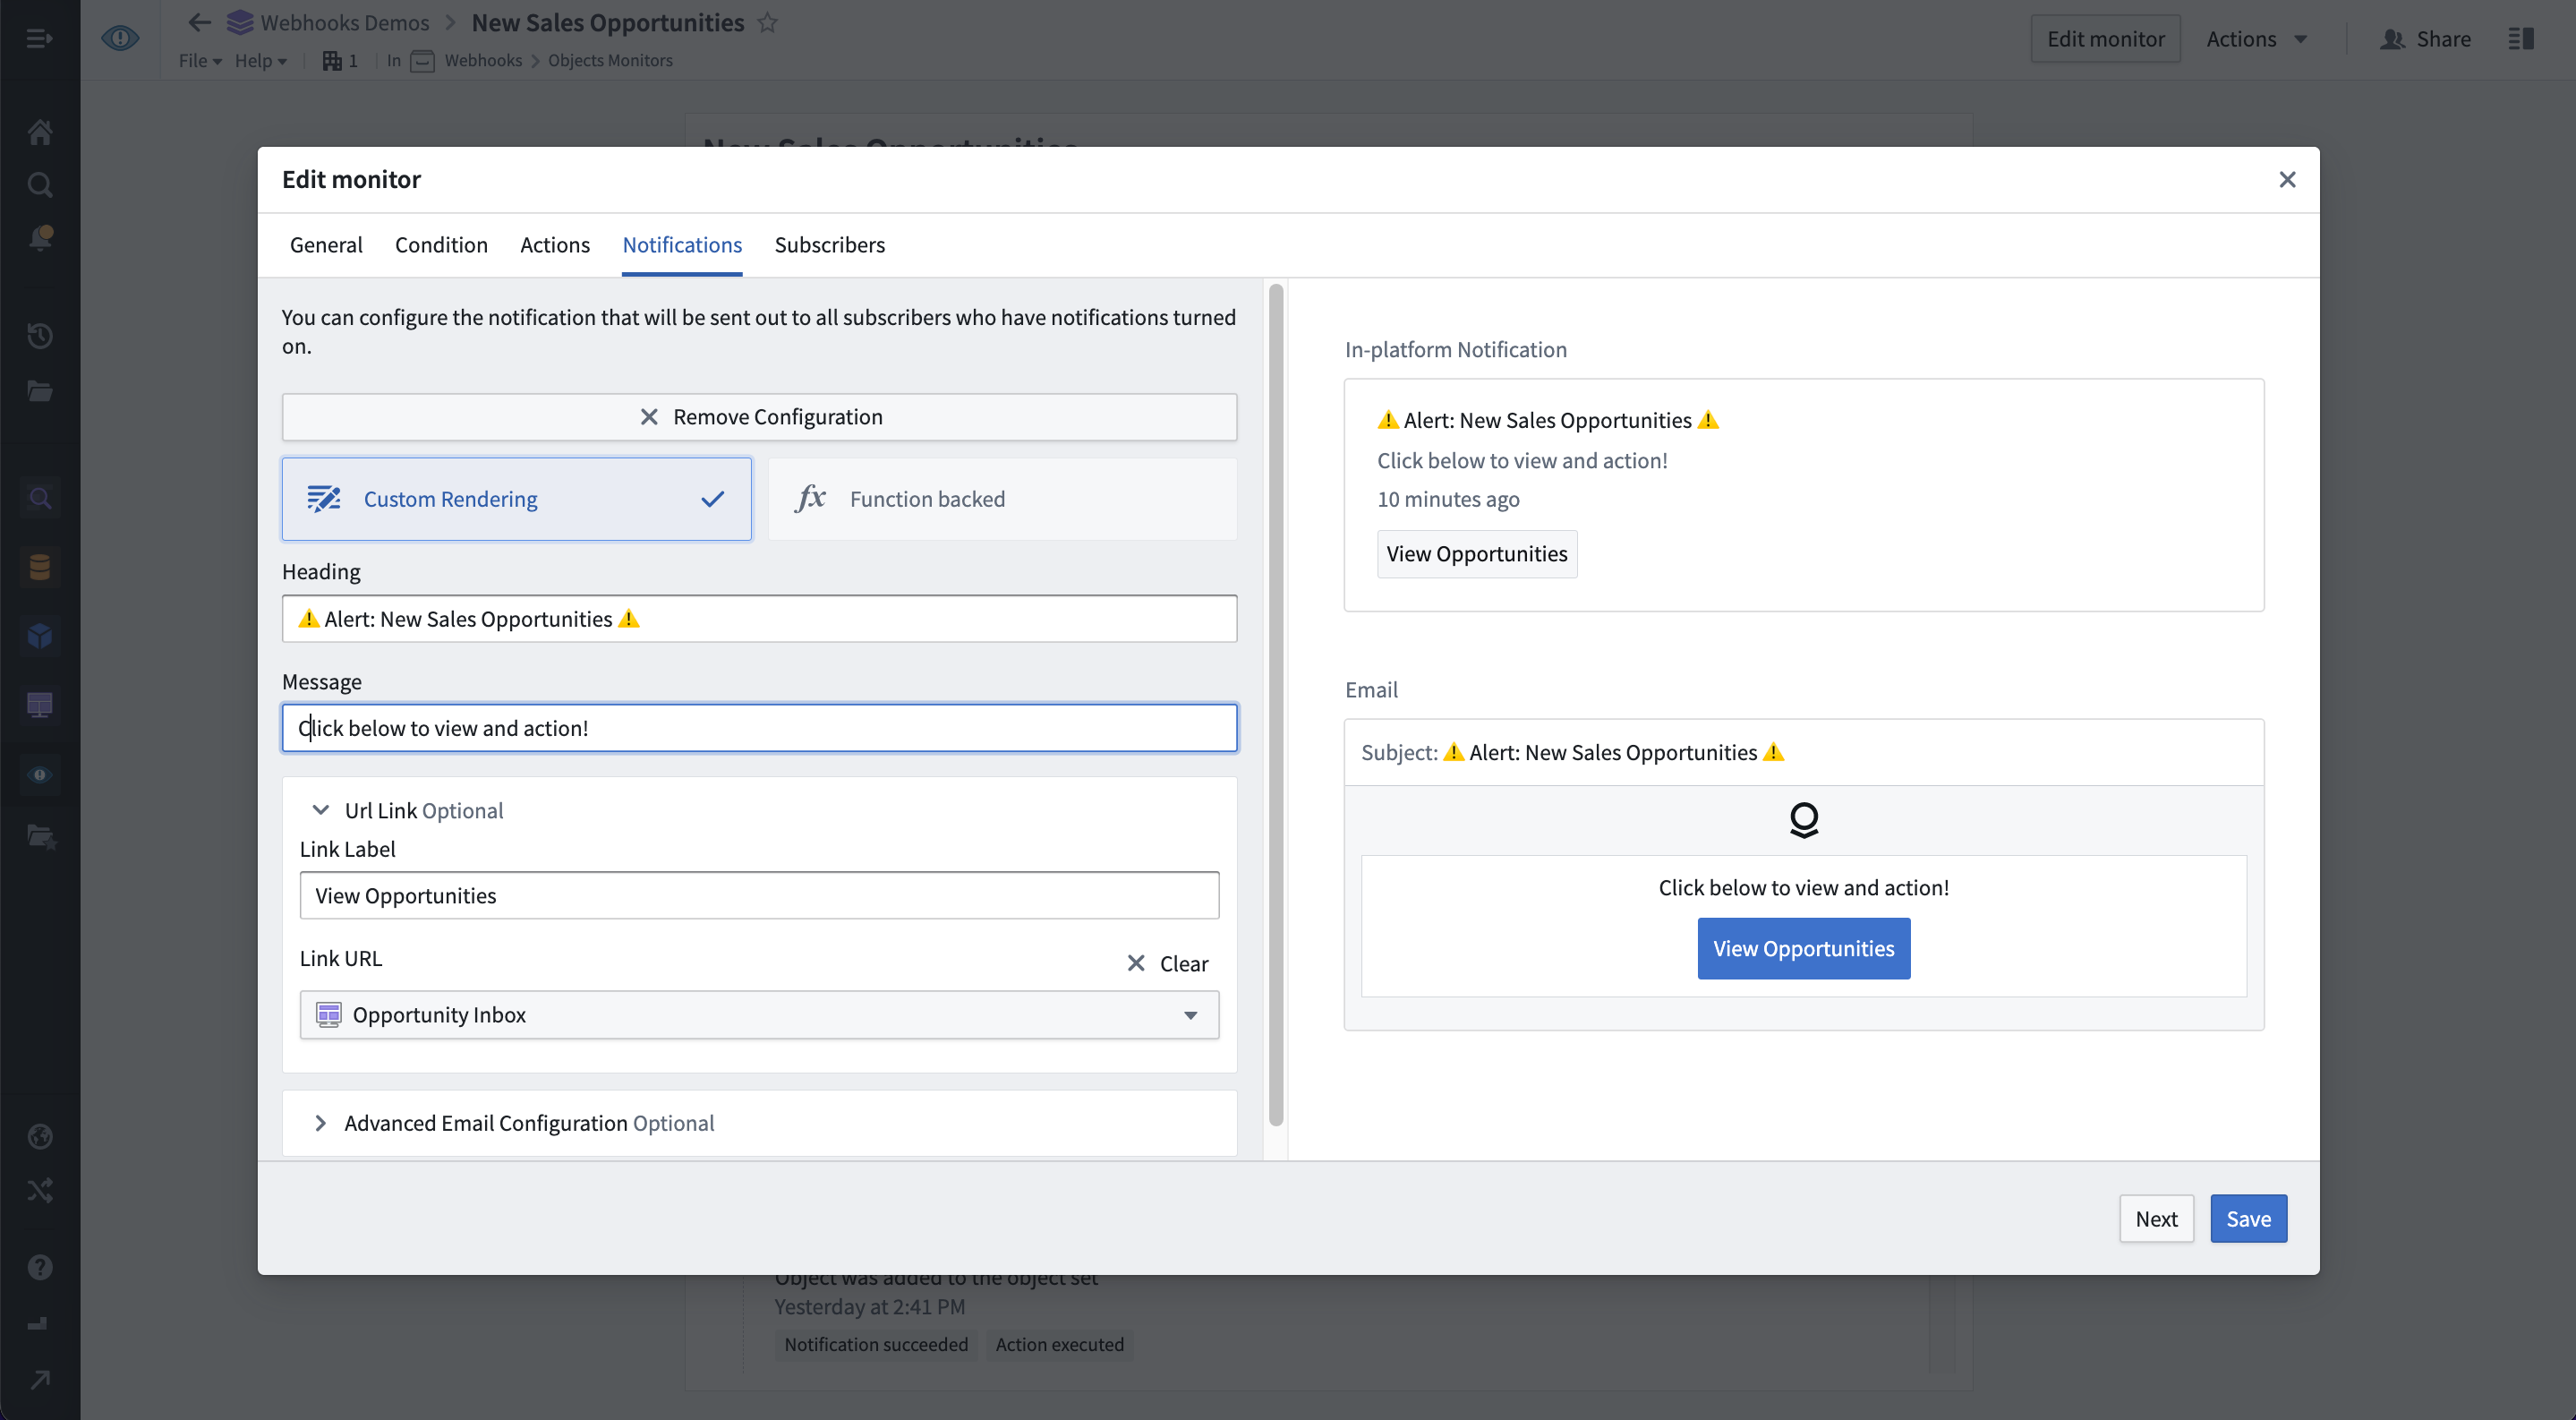
Set up and subscribe to notifications
By default, all users who can interact with Ontology data are able to configure monitors and subscribe users and groups to receive highly customizable notifications. These include customized HTML-based emails or pings on third-party platforms such as Slack, Twilio, Teams and more. Third-party notifications can be easily configured through an Action and a webhook.
Supported notification mediums include, but are not limited to:
- In-platform pop-up in the Foundry notifications center
- HTML-based email
- SMS via webhooks to a third-party service such as Twilio ↗
- Instant message via webhooks to a third-party service such as Slack ↗ or Microsoft Teams ↗
Automate your workflows with Actions
Object monitors may be set up to automatically perform Actions based on monitoring conditions. Actions may perform edits to data in Foundry Ontology or modify data in external systems via webhooks. Two example use cases for this are:
- Checking for data anomalies and automatically passing those objects into an Action with logic to remediate the issue.
- Automatically apply Actions when pre-configured event and time conditions are met. Actions can include making an API call to an external system via webhooks to apply a change directly in the external system.
Manage object monitors in one dedicated application
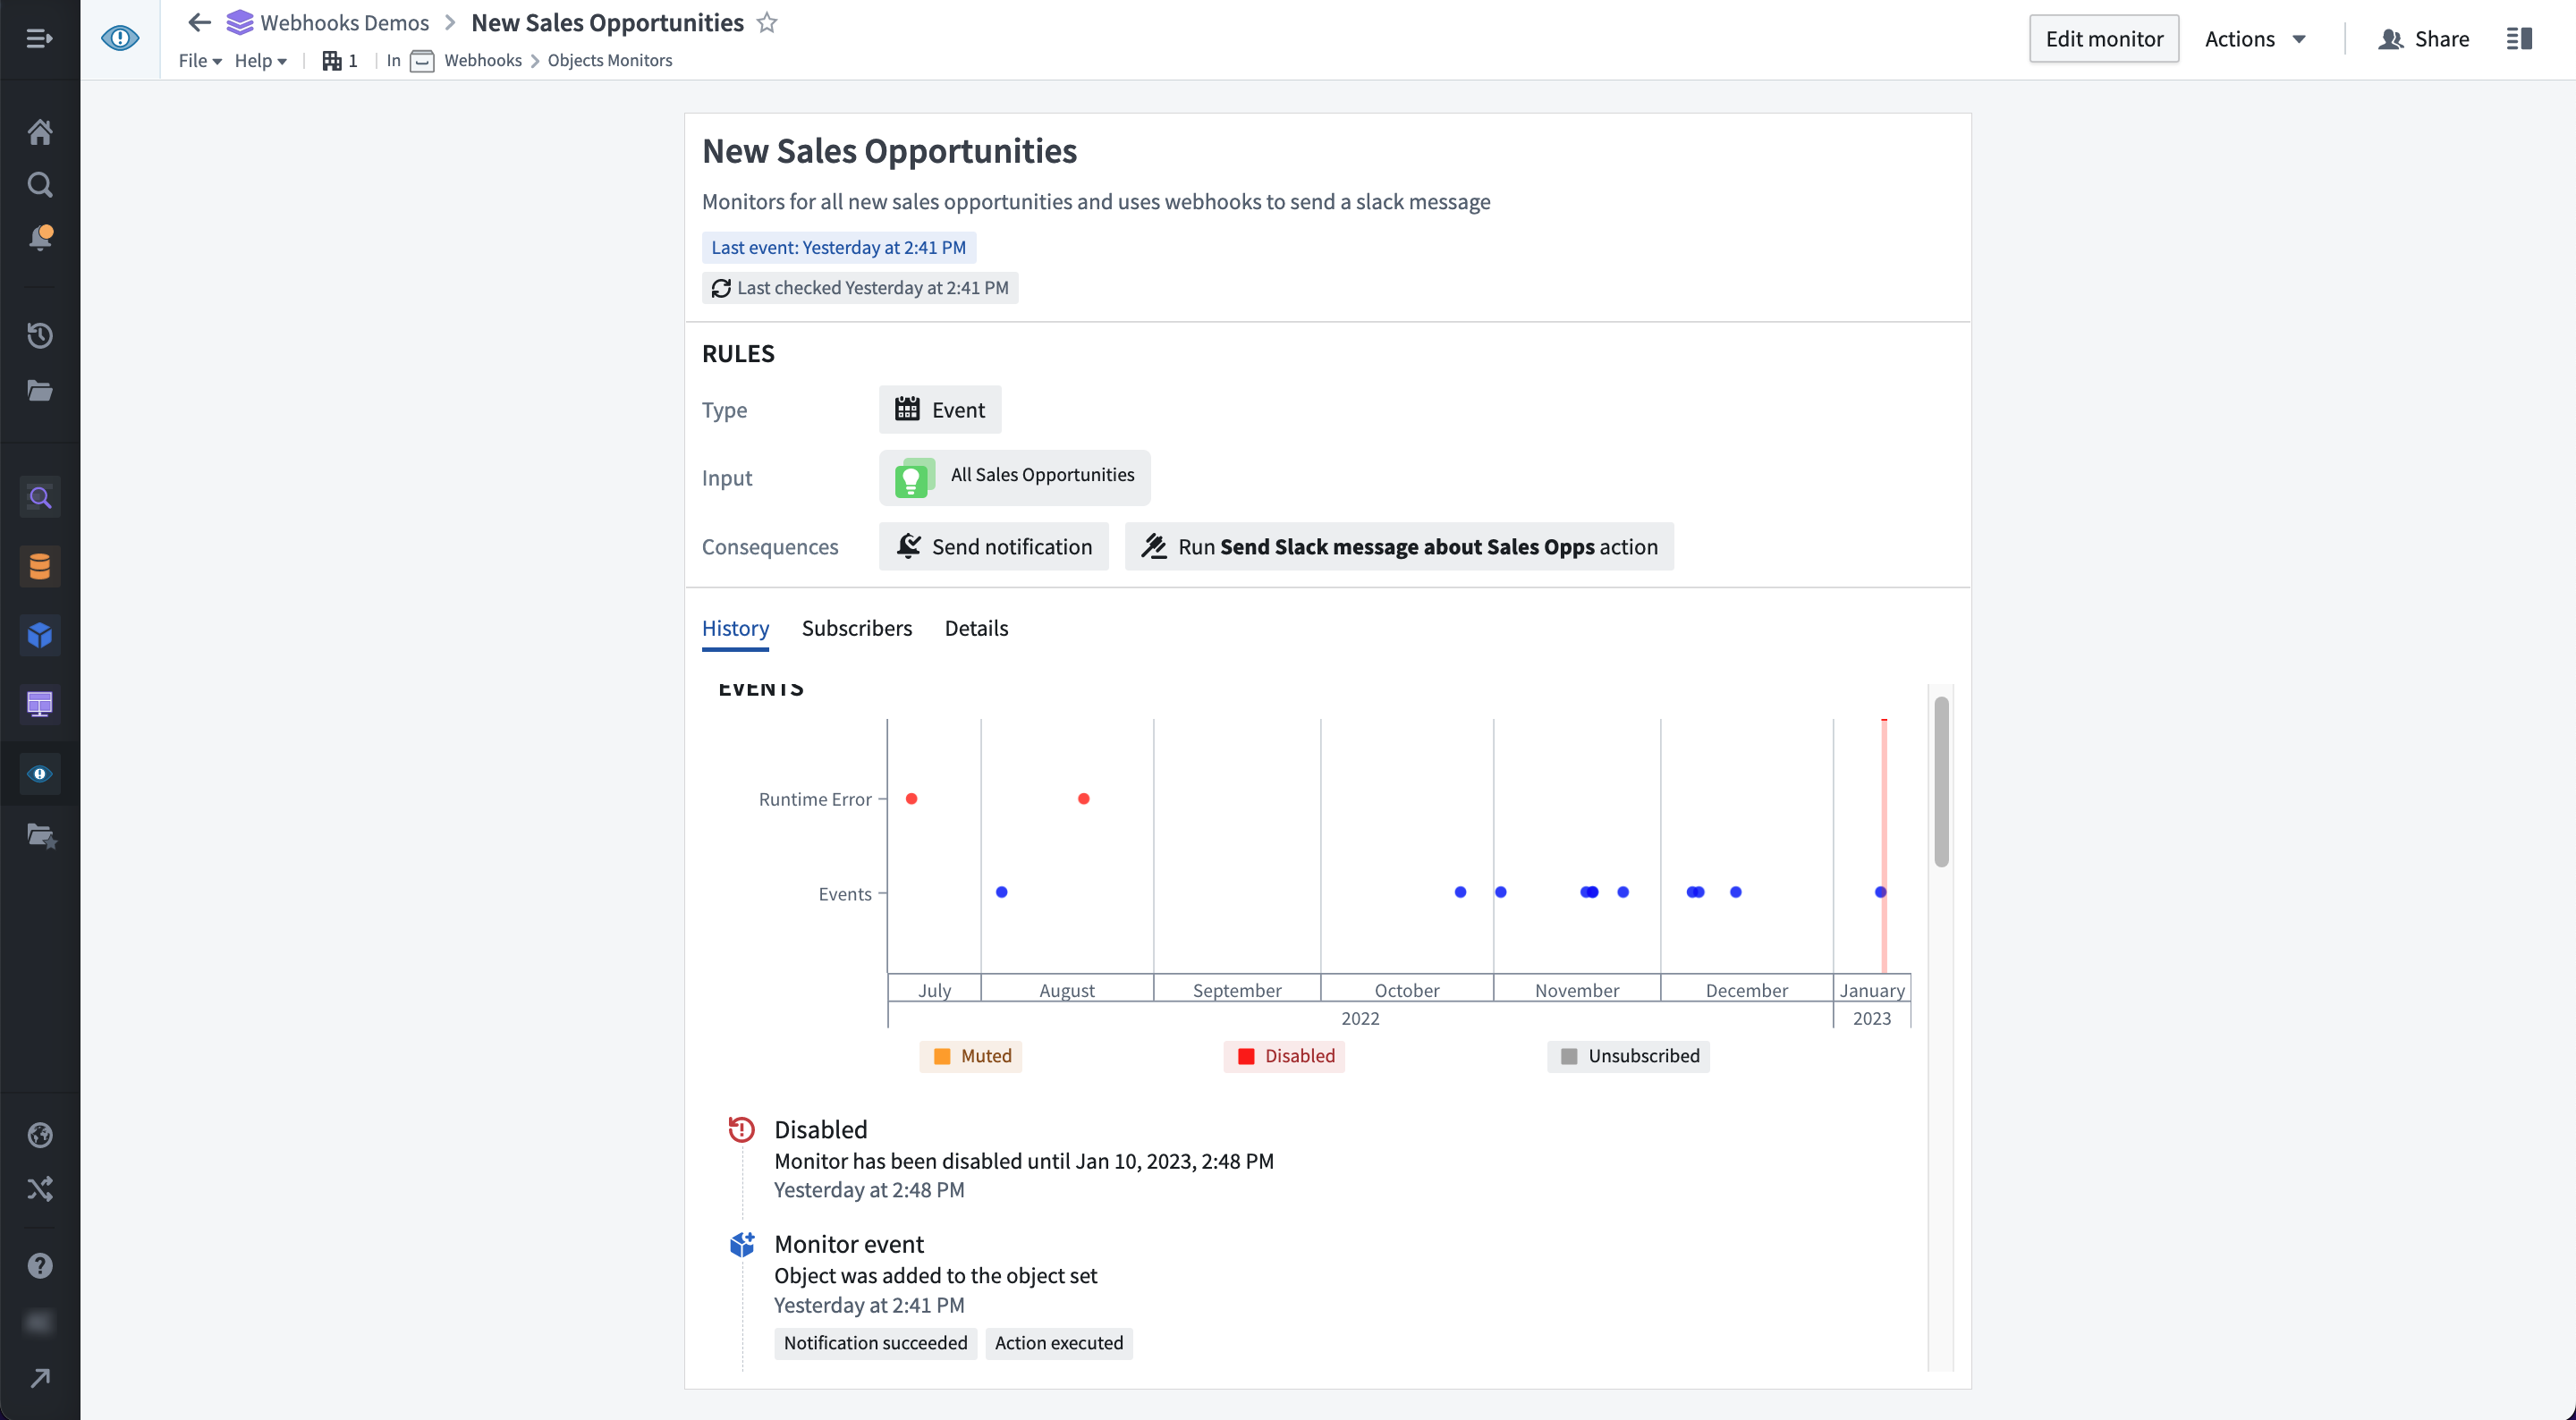
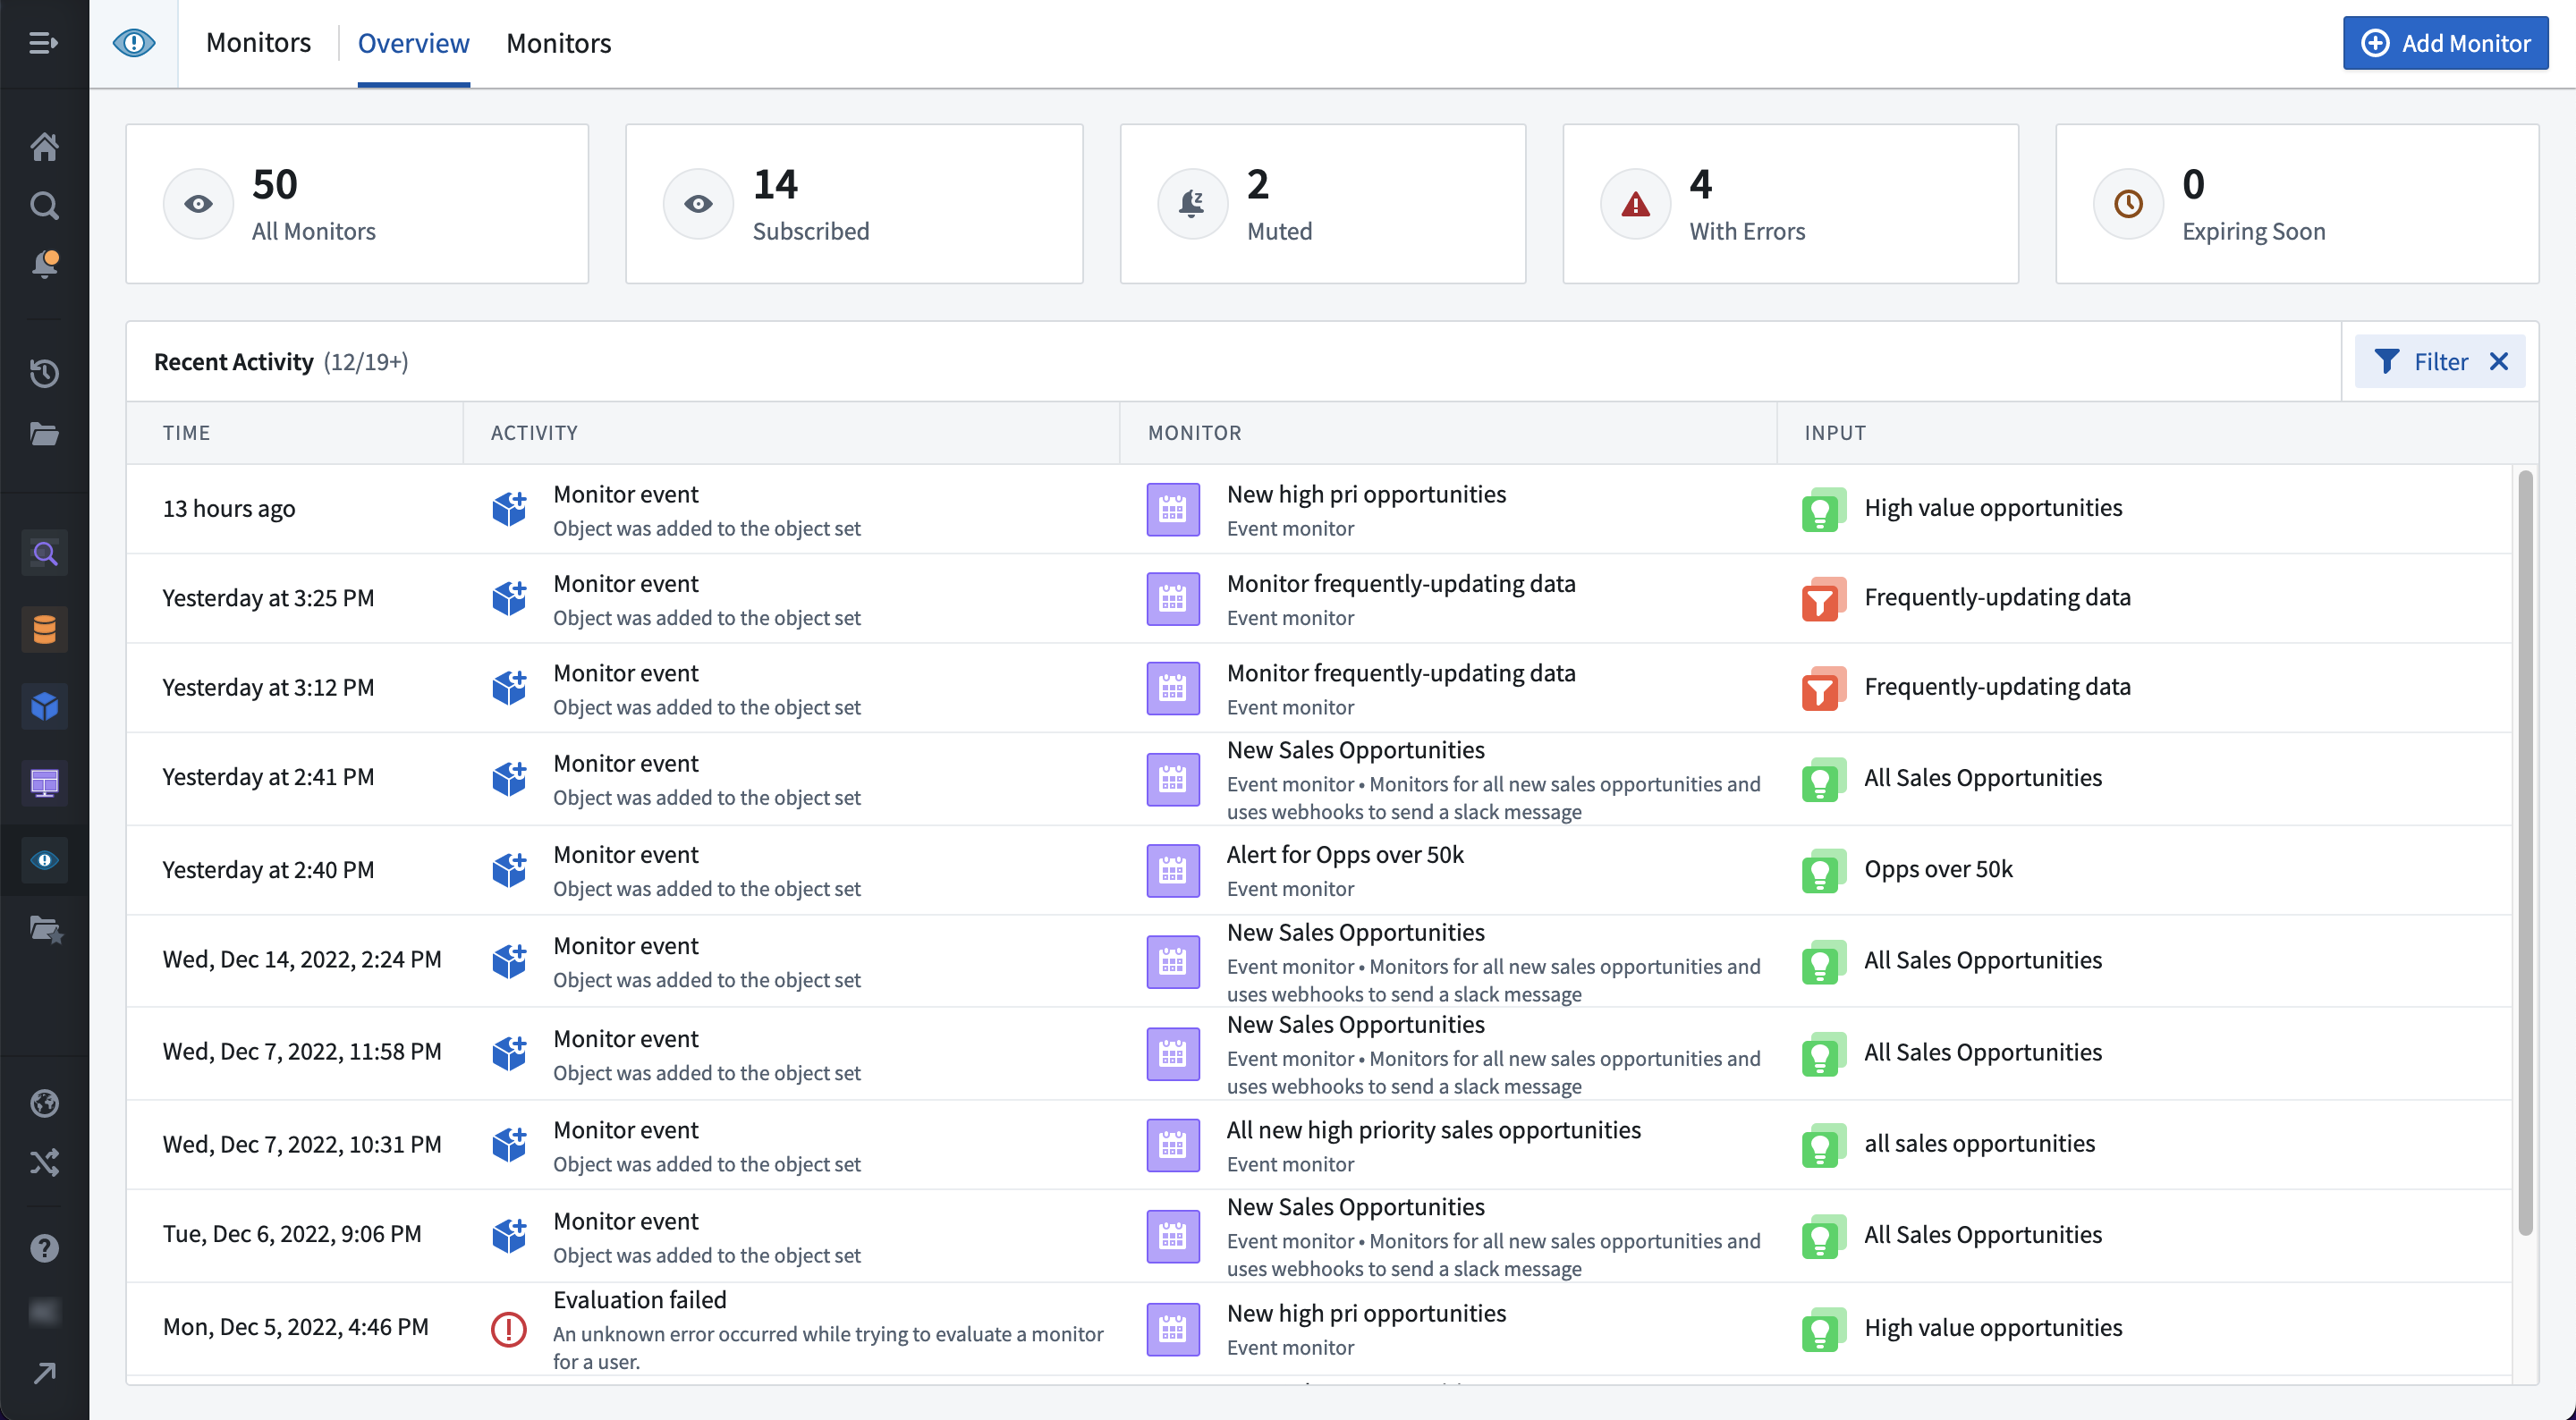
The Object Monitoring application provides a consolidated single view across all monitors users are subscribed to. From here users can monitor configured workflows and respond to global events as needed. From the interface, you can:
- View a unified activity timeline to track events across all of your monitors.
- Manage your active object monitors.
- Configure advanced functionality including:
- Function-backed conditions
- Custom notification rendering
- Diagnose address issues as needed.
When should I use Object Monitors
Use object monitoring when Ontology data updates automatically via a pipeline and users wish to receive notifications or trigger Actions based on those changes. Object Monitoring can also be suitable for workflow automation, when the automation should be triggered by Ontology data changes and the desired effects may be performed by a Foundry Action.
If you have workflows that require fixed-schedule triggering, evaluation on a user-configured schedule, or observation of changes in time-series properties, Foundry’s Pipeline Builder, Code Repository, and Foundry Rules remain best suited for your needs.
To learn how to set up object monitors to automatically notify or trigger Actions, have a look at Object Monitors documentation.
Workshop: On-the-go with Mobile Apps
Date published: 2023-01-17
Access and capture data from the convenience of your phone
Workshop now features mobile support to help you harness object type data from the Ontology, anywhere, at anytime using hand-held devices — without the need to download an app. You can use Workshop’s familiar point-and-click interface to configure an application for usability on a touchscreen device and provide a seamless in-browser navigation experience when users launch the application on a dedicated mobile app launcher.
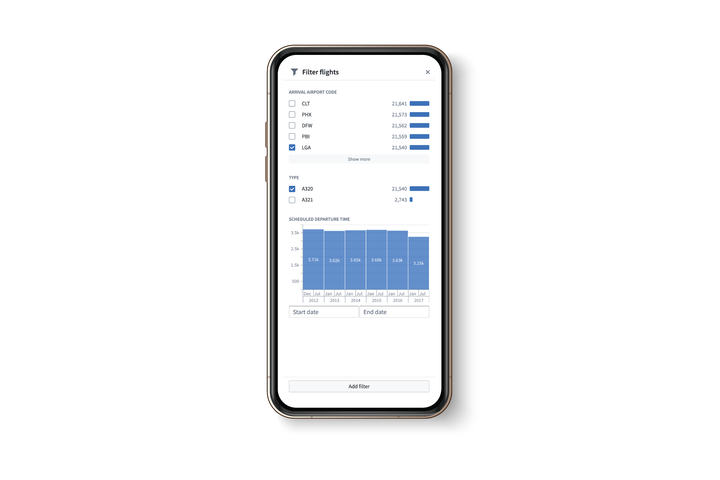
Known for its many interactive applications for desktop users, Workshop applications can now be optimized for access from anywhere — whether in a health clinic, at a customer site, or on the factory floor — enabling highly interactive, closed-loop workflows.
Unlock your field operations
In addition to serving as a flexible application builder with support for highly configurable layouts and widgets that enable a wide range of workflows, Workshop can provide a full spectrum of additional benefits for mobile users that include the following:
- Data from the Ontology surfaced in a wide variety of views such as text, lists, timelines, and more.
- A streamlined landing experience through the purpose-built mobile application launcher.
- Mobile-friendly interfaces, using built-in support for pages, drawers, and multiple page layout options.
- An intuitive navigation experience that conforms to iOS and Android design guidelines.
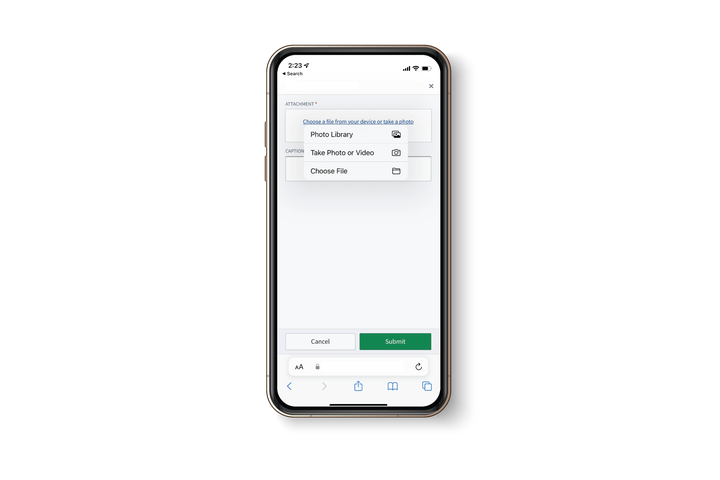
Physical data enrichment
Extending beyond traditional desktop features, mobile support makes it possible for on-the-go users to capture inputs directly from their physical environment. For instance, users can submit phone-captured images into Foundry, enable scanning QR codes with the QR Code Reader widget, or even set up geospatial awareness capabilities, such as surfacing nearby objects of interest from your enterprise data store.
When should I create mobile apps in Workshop?
To provide a uniform experience to users on any type of mobile device, Workshop applications can now be used through a mobile application wrapper that optimizes presentation and access from popular mobile web browsers. Consider creating mobile apps in Workshop for users who would benefit from the ability to access or update organizational data while traveling or working offsite in the course of their day-to-day roles. When enabled, remember to work with your IT organization to enable mobile browser access to applications.
Explore Foundry Documentation to learn how to build a Workshop application in mobile mode.
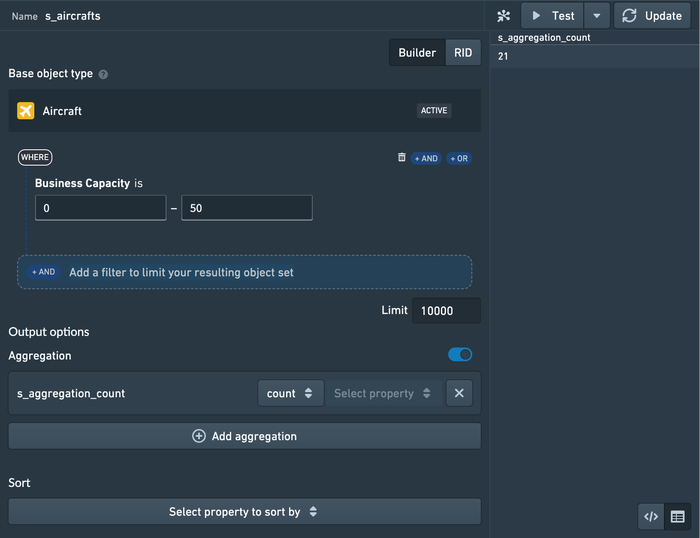
Slate: Calculate object aggregations
Date published: 2023-01-17
The Slate Platform tab now supports configuring aggregations on top of object set definitions. This removes the need to write aggregation logic in Typescript as a Foundry Function- though this remains a powerful and flexible approach - and makes it trivial to calculate simple metrics like sums and means without leaving Slate. Read more in the docs.
Pipeline Builder: Reuse logic with custom functions
Date published: 2023-01-17
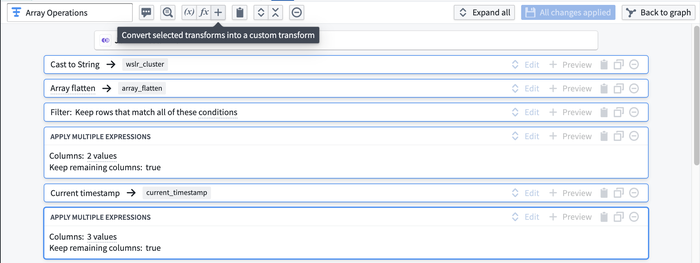
Logic often needs to be repeated across a pipeline, but it’s hard to maintain one source of truth when the same logic is scattered in multiple locations. Copying and pasting leads to logic duplication and an increasing support burden over time. In addition, it can be challenging to accelerate cross-organization collaboration when much of business logic is saved as code that requires specialized knowledge to update.
Now, you can create your own suite of functions within a Builder pipeline and use them as first-class transforms in your pipeline. A function can be created from a single board or multiple boards in a path. These functions are composed of human-readable parts, increasing accessibility for non-technical users in your organization to engage with the logic. You can create a new function via the Custom functions button on the graph view, or by highlighting a set of transforms and clicking the + button within a transform path.
Introducing Foundry Streaming: Operate in real-time
Date published: 2023-01-01
Foundry Streaming refers to a set of capabilities for Foundry that spans multiple products and workflows to enable end to end low latency pipelines. From real time monitoring and alerting to critical business decision-making, Streaming provides all the same primitives and scalability expected of Foundry while maintaining consistent low latencies and high throughput. To see how all the pieces fit together, check out this short demo ↗ bringing together streaming sensor data for alerting, analytics, and operational applications.
Data connections to real-time sources
Streaming sources: The Data Connection application now supports a streamlined setup for connecting to Kafka streams.
Push-based sources: With streams, Foundry also supports push-based ingestion to support event-based workflows. Push-based record ingestion in Foundry follows the same principles as typical REST services. Through a series of REST endpoints, we expose a push-based API that can consume records and write them into streams and datasets. Find all the details to get started configuring these sources in the documentation.
Streaming transforms in Pipeline Builder
Authoring logic on top of streaming sources is typically complex and fragile, which prevents operational applications from taking advantage of these low-latency sources of truth. With Pipeline Builder support for streams production-grade pipelines are easy to configure and secure with an ever-growing list of available transformations, joins, and aggregations supporting streaming data. Streaming pipelines can be used to back time series as well as Ontology object types.
For streaming pipeline logic that cannot be expressed in Pipeline Builder, Foundry Authoring supports creating user-defined functions (UDFs).
Analyze and build with streaming data
Streams modeled as time series can be used in Quiver and Vertex for live analysis of real-time operational and IoT data. Foundry Rules supports building alerting and monitoring workflows on top of streaming time series. Modeling the streaming data as time series properties of Ontology object types brings streaming data to the operational edge and unlocks additional functionality in Workshop charts, maps, variables, and other application-building components. Putting these components together brings real-time data to operational decisions making; view an example in this short demo ↗.
What's next?
Foundry Streaming already unlocks the value of real-time sensor and other live data sources. The following is what we expect to be available by the end of 2023:
- Stateful streaming functions: stateful streaming is the most challenging form of streaming to build correctly. With that in mind we are spending an additional season to harden the APIs before rolling the capability out widely.
- Hitting external compute from streams: Often times you want low latency applications to reach out of Foundry and query external compute resources, like external models or lambdas. We are investing in the infrastructure for this capability and piloting with early adopters.
- More data connectors: Kafka is a good start but there are many more streaming sources that deserve a first-class data connector. If you have a need for a specific connector, reach out to a Palantir representative.
- Data export: To close the loop, streaming data sometimes needs to flow back into source systems after being enriched and transformed in Foundry. We have beta versions of a few of these export connectors and are investing in first-class export solutions.
Additional highlights
Administration | Resource Management
Overview tab | The new Overview tab in Resource Management allows users to understand their resource usage at a glance and drill down into areas of interest.
Analytics | Contour
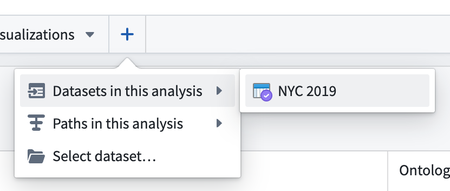
Resources in analysis menu | When adding a new path to an analysis, there is now an additional option to select from "Datasets in this analysis". This can be used to quickly start a new path from a dataset already referenced elsewhere in the analysis.
Analytics | Quiver
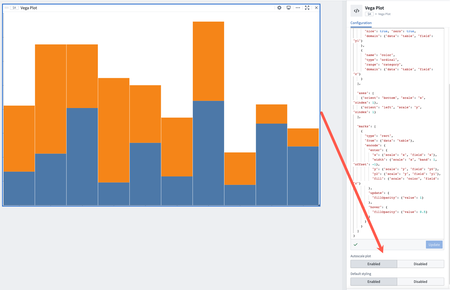
Add toggles to disable our vega default injections | Added toggles to the Vega chart to disable default autoscale or style options and use the user-provided Vega spec instead for full control over the Vega chart appearance.
New string casting transforms | Added three new string casting transforms: string to number (in the Numeric menu), string to date (in the Date/Time menu), and string to Boolean (in the Boolean menu).

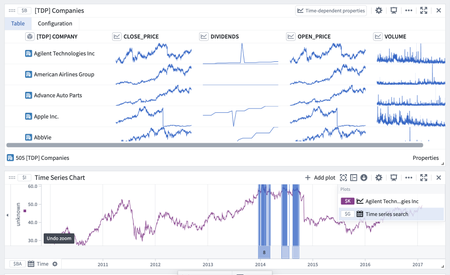
Updated Time Series Search (TSS) and Multi Time Series Search (MTSS) | Released improved single and multi time series search capabilities that visually display when certain conditions are met on one or more time series plots. Search results are displayed as events in an events plot. Run a single search which satisfies one or more conditions, or search across each row of a transform table (limited to 1,000 rows). To search over an object set, add a transform table from the object set and search over the transform table.
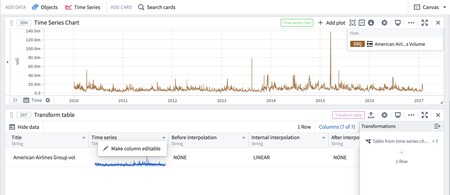
Time series columns in transform tables are now editable | The "create values" and "edit values" transforms now support the time series data type. Users are now able to swap a time series with data coming from another time series, or add a time series column that shows a specific time series by default.
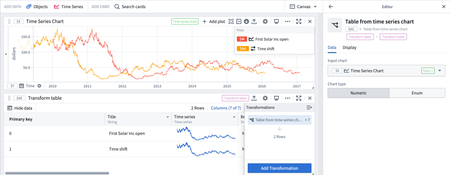
Open chart plots as rows in a transform table | It is now possible to open time series from a chart as rows in a transform table, allowing for quick editing and transformation of time series data. Each time series plot shows up as one row in the table.
App Building | Slate
Customize filename in function export | When exporting a CSV in Slate using the .exportCsv action for a query or function, you can now specify the output filename by returning a string value in the event JavaScript like { fileName: <<custom_string>> }.
App Building | Workshop
Chart XY widget: support for cumulative sum series | The Chart XY widget now includes a front-end option to display a given series as a cumulative, rolling sum rather than as individual bucket values.
Data Integration | Data Connection
Snowflake source available for all enrollments | The dedicated Snowflake connector is now available for all Foundry enrollments.
Data Integration | Pipeline Builder
Enable changelog write mode | Builder now supports writing output datasets as changelogs for use in the Ontology and other places. This can be configured through the pipeline outputs panel by editing an output and selecting Configure changelog.
Model Integration | Modeling
Updated Modeling Objectives documentation | Released new documentation for the updated Modeling Objectives application and new model evaluation functionality. Updated content includes explanations of modeling objectives and model evaluation, revised tutorials, and code examples.
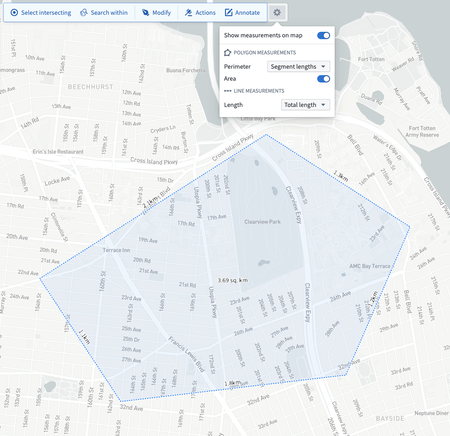
Ontology | Map
Shape measurements | Measurements, including the total shape perimeter, shape area, and per-segment length are now displayed when drawing a line or polygon on the map. The measurements units can be configured to imperial or metric.