- Capabilities
- Getting started
- Architecture center
- Platform updates
Dashboards
There are two primary ways to build interactive dashboards from Foundry analyses: Contour dashboards and Quiver dashboards. In some circumstances, you may want to use a Code Workspaces dashboard, Notepad, or a custom application instead. This page discusses which tools you can use and when you might use them.
Learn more about the differences between Contour and Quiver.
Contour dashboards
Contour dashboards are used to present content from a Contour analysis, such as analysis results and findings. These dashboards support chart-to-chart filtering, inline parameter references, a fullscreen presentation view, and PDF exports.
Learn more about Contour and Contour dashboards.
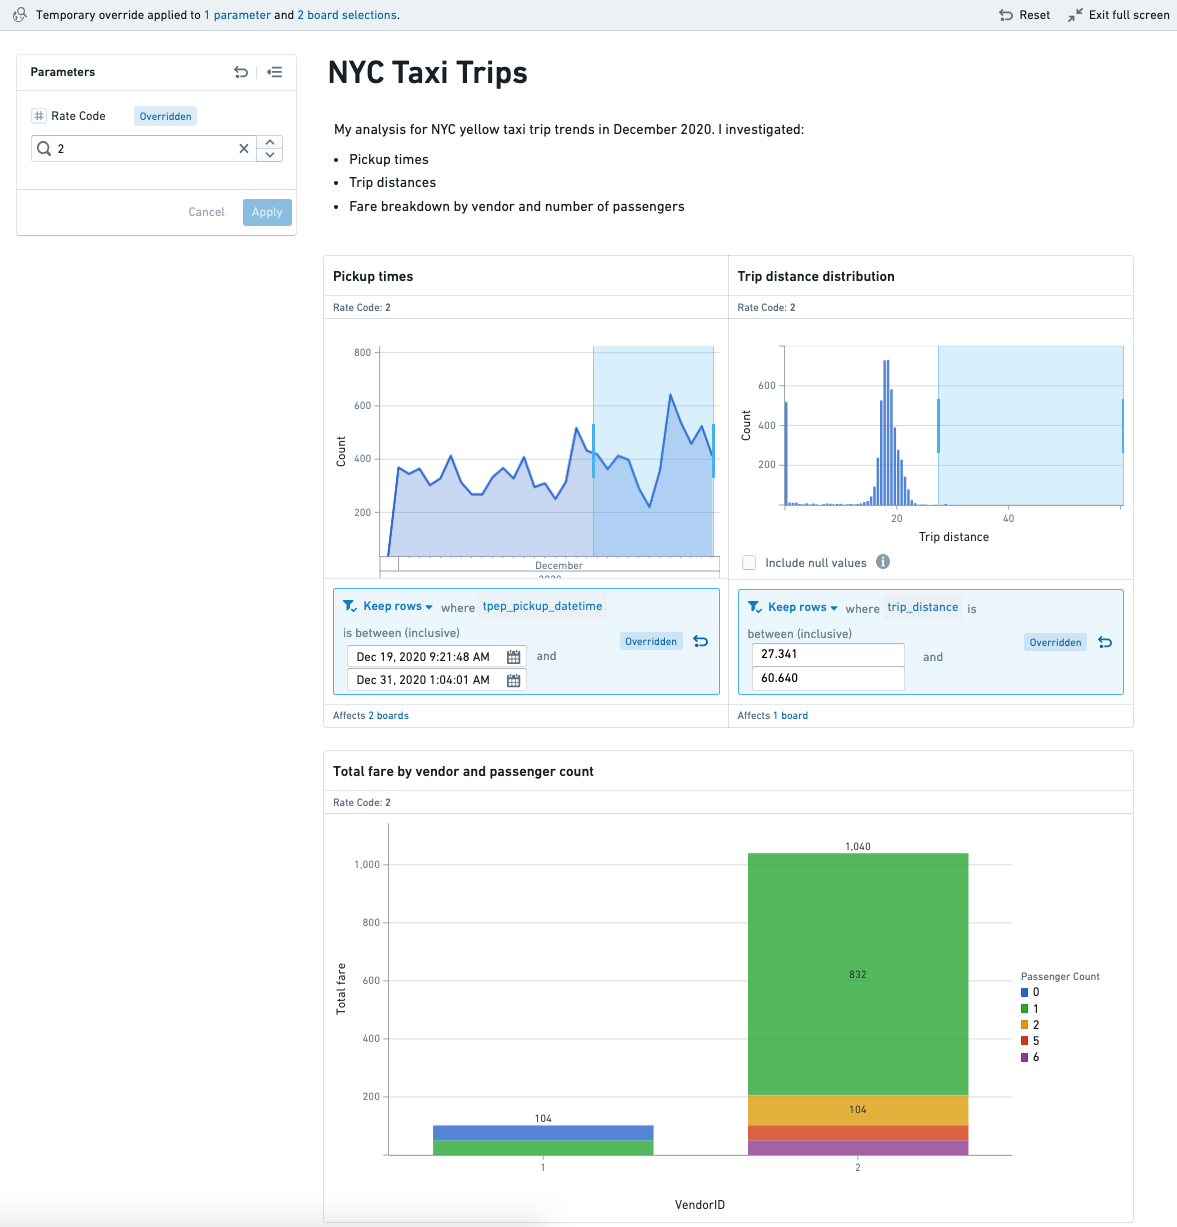
This screenshot uses open source data from the NYC Taxi & Limousine Commission ↗.
Quiver dashboards
Quiver dashboards are used to present content from a Quiver analysis in a read-only, interactive dashboard.
Quiver dashboards can be used as standalone dashboards or embedded in Object Views, Workshop applications, or Notepad documents. Quiver dashboards can also be displayed in Carbon and delivered directly to operational users.
Learn more about Quiver and Quiver dashboards.

Code Workspaces applications
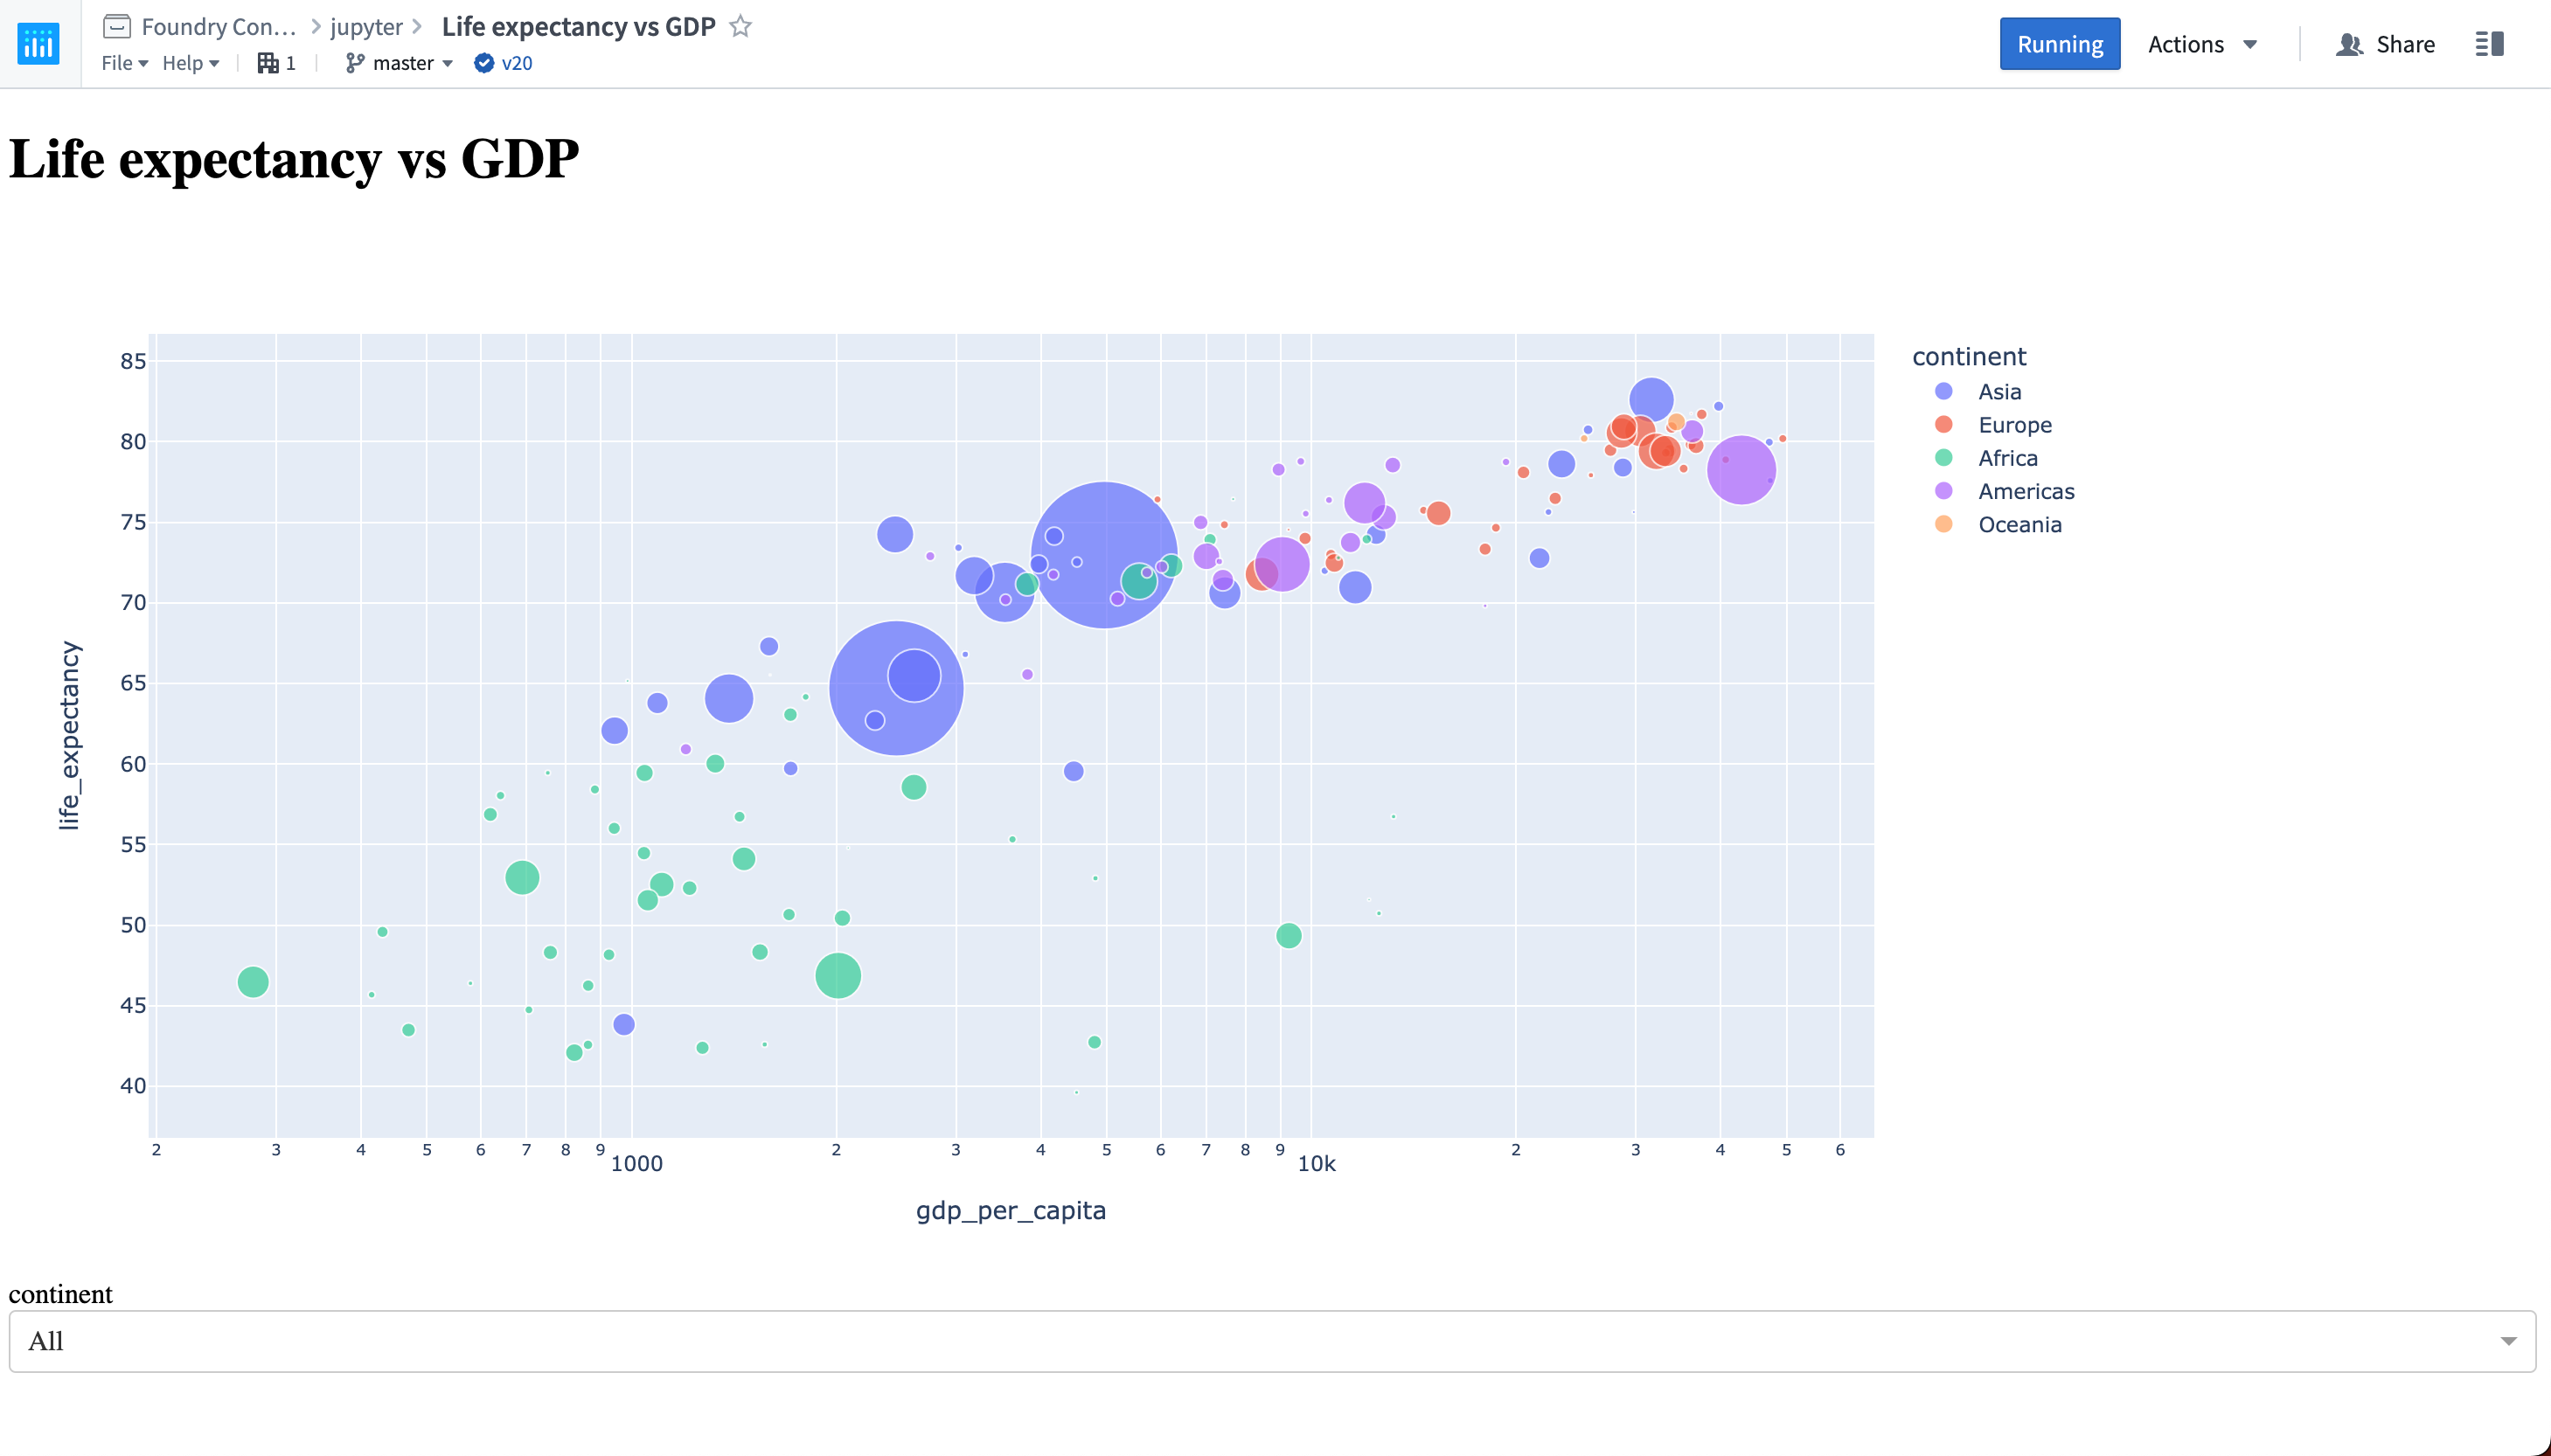
Code Workspaces currently supports Dash ↗ and Streamlit ↗ for Python applications and Shiny® ↗ for R applications. Users can create application workflows directly in Code Workspaces with Foundry’s version control, branching, and data governance features built-in.
Learn more about Code Workspaces and Code Workspace applications.
Other presentation tools
Notepad
Contour dashboards and Quiver templates are best suited for direct consumption within Foundry, as their interactive design allows users to work with live data using parameters and chart selections. In contrast, Notepad is designed for reporting workflows that focus on creating static content that may be exported. In addition, a Notepad document can include content coming from multiple applications (including Contour boards and Quiver cards), while Contour dashboards and Quiver templates only support content from their respective applications. Due to the focus on static content, users cannot conduct analysis or create charts in Notepad directly.
Learn more about reporting workflows.
Custom applications
Contour dashboards and Quiver templates are optimized for easily presenting an interactive view of analytical results, while application building tools (such as Workshop) may be a better fit for some use cases. Specifically, if your use case requires full customization and layout flexibility, multi-step workflows, or writeback, you should consider Foundry's application building tools.
Quiver dashboards can be embedded in Workshop applications to make more complex analytical content available to operational users.