Announcements
Pipeline Builder: Next-gen data integration
Date published: 2022-08-18
Designed to enable fast, flexible, and scalable delivery of data pipelines
Building pipelines at scale is often a costly and gated endeavor, requiring extensive technical knowledge, budget, and time allocation to ensure healthy, comprehensive pipelines. With such baseline requirements, data integration can be inaccessible to many users, costly to conduct, and incredibly difficult to maintain.
We created Pipeline Builder so users can focus on describing the pipeline they want to build without worrying about the details.
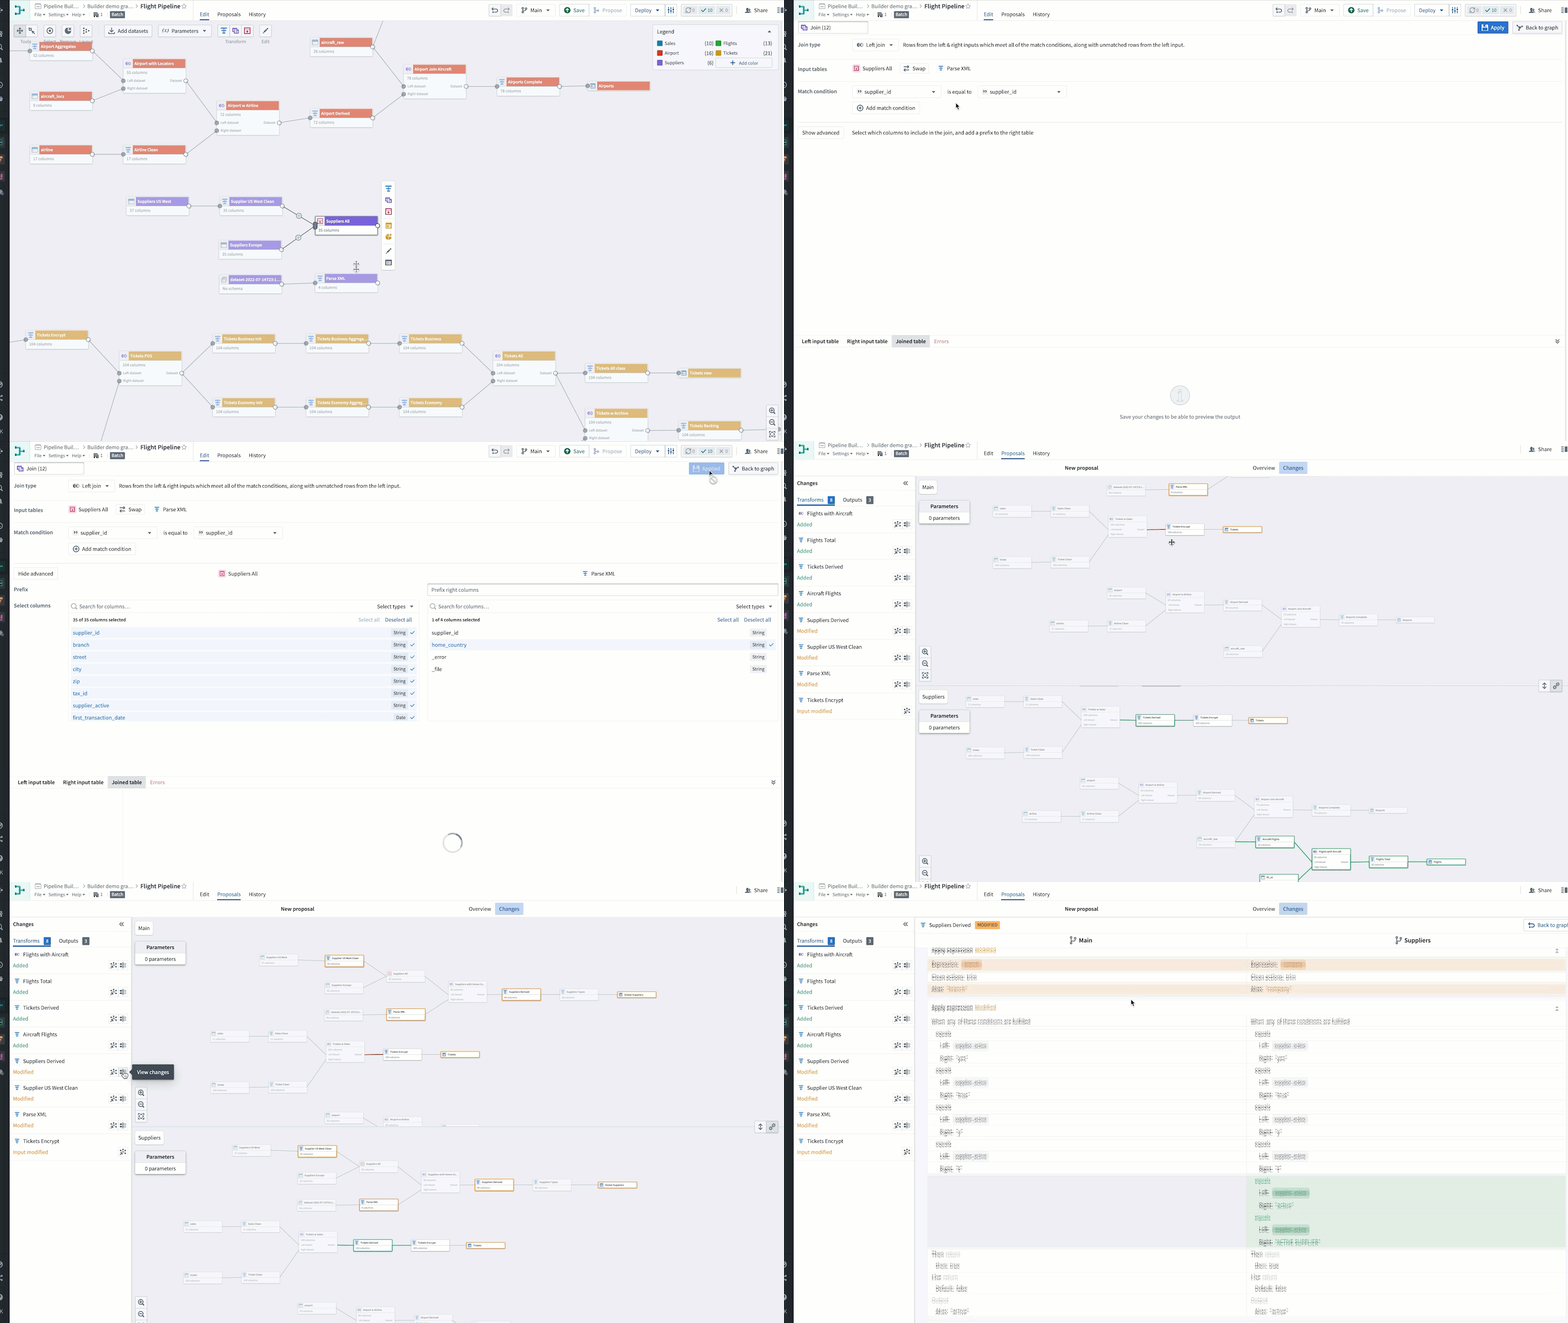
Building pipelines at speed
Pipeline Builder provides managed, serverless support for batch, micro-batch, and streaming workflows across the full range of target outputs, while builds, refreshes, and other orchestrations are handled together at scale.
- Immediately apply transforms to data (structured, unstructured, IoT) without needing to spin up environments or write boilerplate code.
- Receive instant feedback on failed builds without needing time- and resource-exhaustive checks through entire datasets.
- Debugging is made easier with granular column provenance across an entire pipeline.
- Benefit from Foundry’s world-class security primitives, including purpose-based access, Palantir’s Cipher for selective encryption, and more.
- Pipeline Builder only materializes data necessary to fulfill the specified targets of pipelines, enabling savings on compute and storage at scale.
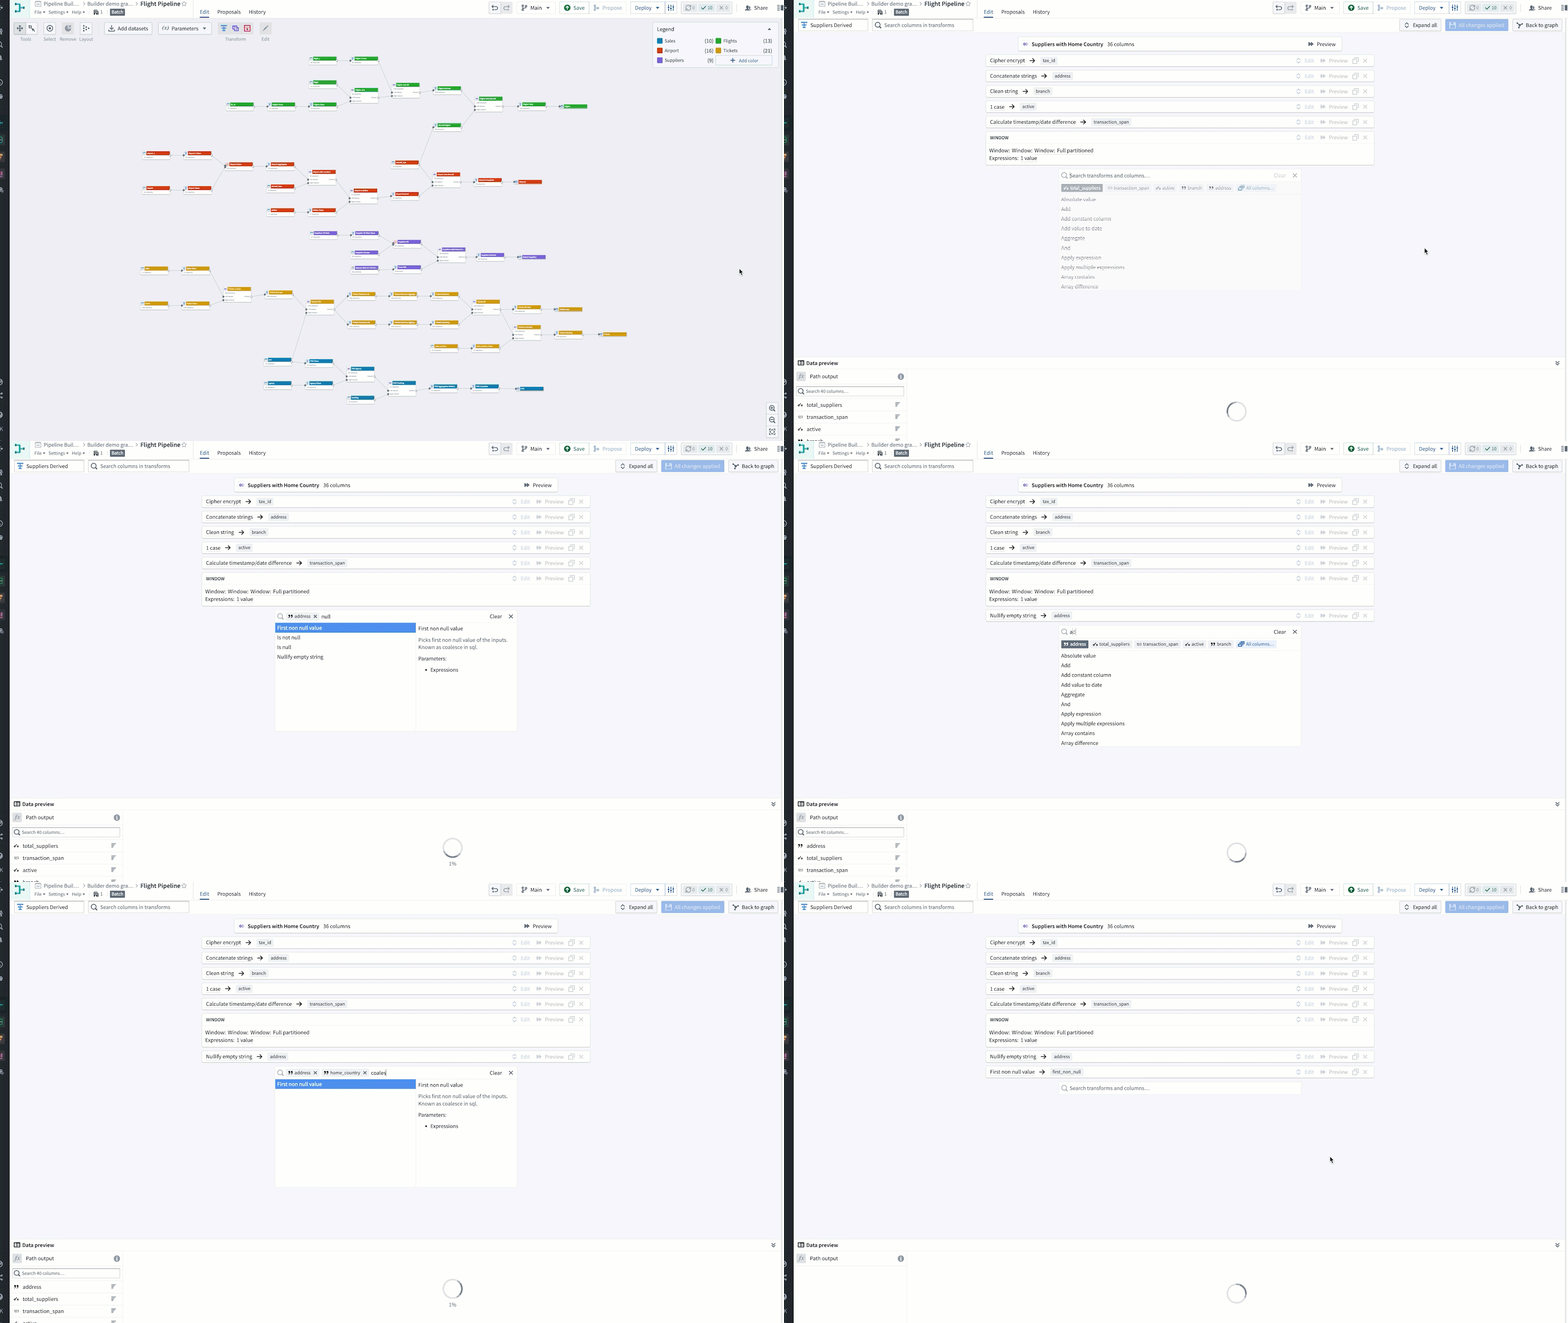
Streamlined data integration without sacrificing versatility
Builder is designed to fit any data integration need with hundreds of commonly used functions as well as the capability to easily add new ones. Pipeline Builder is also back-end extensible, with the ability to employ different execution engines, (e.g., in-memory engines for small-scale data; Spark for classic batch-based pipelines; Flink for low-latency, streaming pipelines). Builder’s backend ensures a consistent experience regardless of underlying compute modality.
Additionally, multiple users can now provide input through the pipeline build process, independent of considerations on their technical ability. Collaboration and export to code are such essential factors built-in to help ideate, create, and review. If needed, you can use the "Export to code" feature to obtain a Java Spark version of your pipeline.
When should I use Pipeline Builder?
Pipeline Builder creates end-to-end pipelines from data sources to final outputs using Palantir’s comprehensive suite of built-in data transformations. Use it when integrating data towards analysis and application building.
If code is required for highly customized integrations, Authoring can be used to apply transformations on your data using SQL, Python and Java. For most workflows, Pipeline Builder and Authoring complement each other, with the outputs of an Authoring repository being accepted as inputs to Builder pipelines, and vice versa. Both tools offer collaboration through version control. Following integration, for analytics, we’d recommend tools such as:
- Code Workbooks: Use the interactive console for rapid iteration on transformation logic, ad-hoc data exploration, creation of detailed, interactive images with commonly used packages (Matplotlib, Plotly, Seaborn).
- Quiver: Use for search and visualization of native time series analysis and object data. Leverage advanced analytical workflows in the Ontology layer through a visual point-and-click interface and a powerful charting library. Quiver analyses can be templatized into read-only dashboards for broader consumption.
Pipeline Builder is a powerful data integration tool that can encompass the end-to-end creation and management of your pipeline. To learn more about Pipeline Builder, watch our launch video ↗, or review our documentation on Pipeline Builder.
Notepad: Modern reporting in Foundry
Date published: 2022-08-15
Quickly share insights and automate report generation
Notepad is a rich text editor that empowers users to share insights generated in the Foundry platform and automate ongoing report generation. Reports generated by Notepad are backed by Foundry’s ontology, allowing users to quickly understand the history and context of any data source used in the document. With historical lineage, your team can readily explain past report versions or decisions by tracing original inputs. Additionally, a Notepad document further helps connect the dots by showing relevant or related content that used the same input data.
With the readily-available context and knowledge, users are empowered to build workflows on previous findings instead of starting entirely from scratch.
Next generation reporting with Notepad
Notepad is a rich text editor with the ability to embed a growing number of sources from across the entire Foundry platform - including Contour, Quiver, Foundry Code Workbook, and Object Explorer. Notepad enables document templatization, allowing you to create the latest version of your periodic reports in just one click.
- Embed charts, tables, and graphs from other Foundry applications. Read about all the supported integrations on our public documentation.
- Maintain structured links to embedded objects and resources which automatically become part of the underlying ontology. Clear lineage around the inputs to any given document supports reproducibility and comprehensibility.
- Freeze content to capture point-in-time context.
- Templatize documents to easily create report versions based on new inputs.
- Export to PDF and print all Notepad documents with granular control over export presentation (embed appearance, page breaks, etc.).
Using Notepad to its fullest potential
Notepad was designed to cover a variety of use cases ranging from ad-hoc to templated periodic reporting:
- Ad-hoc note-taking: Integrate process artifacts and results from other Foundry analytics applications like Quiver. Copy and paste charts and tables to allow for persisting and precise documentation.
- In-platform documentation: Deep integration with platform resources support the direct creation of documentation.
- Periodic reporting: Use templates to create blueprints that allow you to generate an up-to-date report in one click.
- Templated exports: Documents and embedded artifacts are optimized for export. Use templates to generate and download an export-friendly PDF for sharing.
Notepad's robust integration with Foundry apps and flexible editing options help it meet your needs across a variety of use cases.
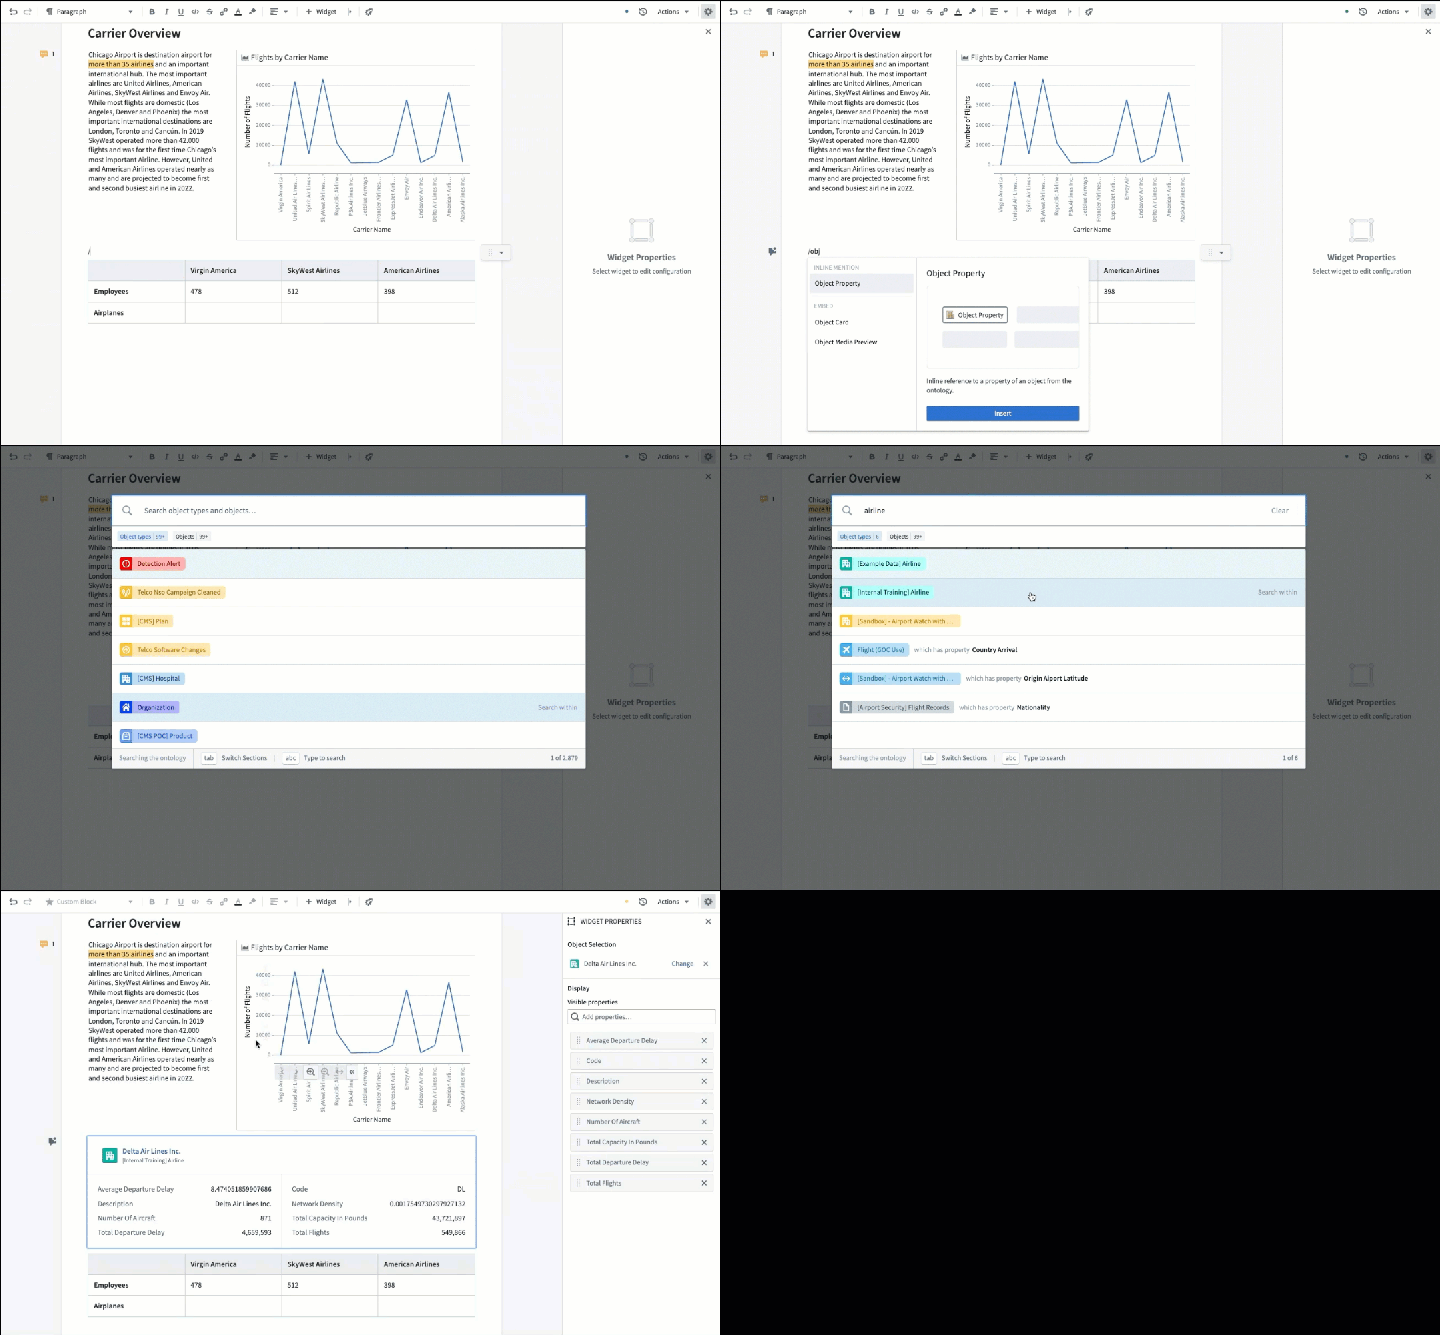
When should I use Notepad?
Use Notepad to consolidate insights and create documents that are intuitive to build and consume. Consider your end output to discern the Foundry ecosystem tool most suitable for you: Notepad is recommended for the majority of reporting use cases based on live-updating and static documents. To perform dynamic filtering based on user inputs or chart selections, such as a dashboard to present analytical findings, consider:
- Quiver dashboards for object or time-series data
- Contour dashboard mode for tabular data
- Workshop for low-code or no-code and dashboards more advanced operational applications
If you want to learn how to seamlessly report on and build documents that integrate across products in the Foundry ecosystem, see the Notepad documentation.
Slate: Global stylesheets
Date published: 2022-08-11
Slate global stylesheets provide application builders a one-stop-shop for styling multiple Slate applications.
Slate enables users to create and apply custom styling to any application, but maintaining consistent styles across a variety of applications in your organization can be challenging and resource intensive. With global stylesheets, app builders can apply their custom branding across all Slate applications with just one click.
One style, everywhere
You can now create a tight, consistent, and recognizable visual brand, even as several people build out applications.
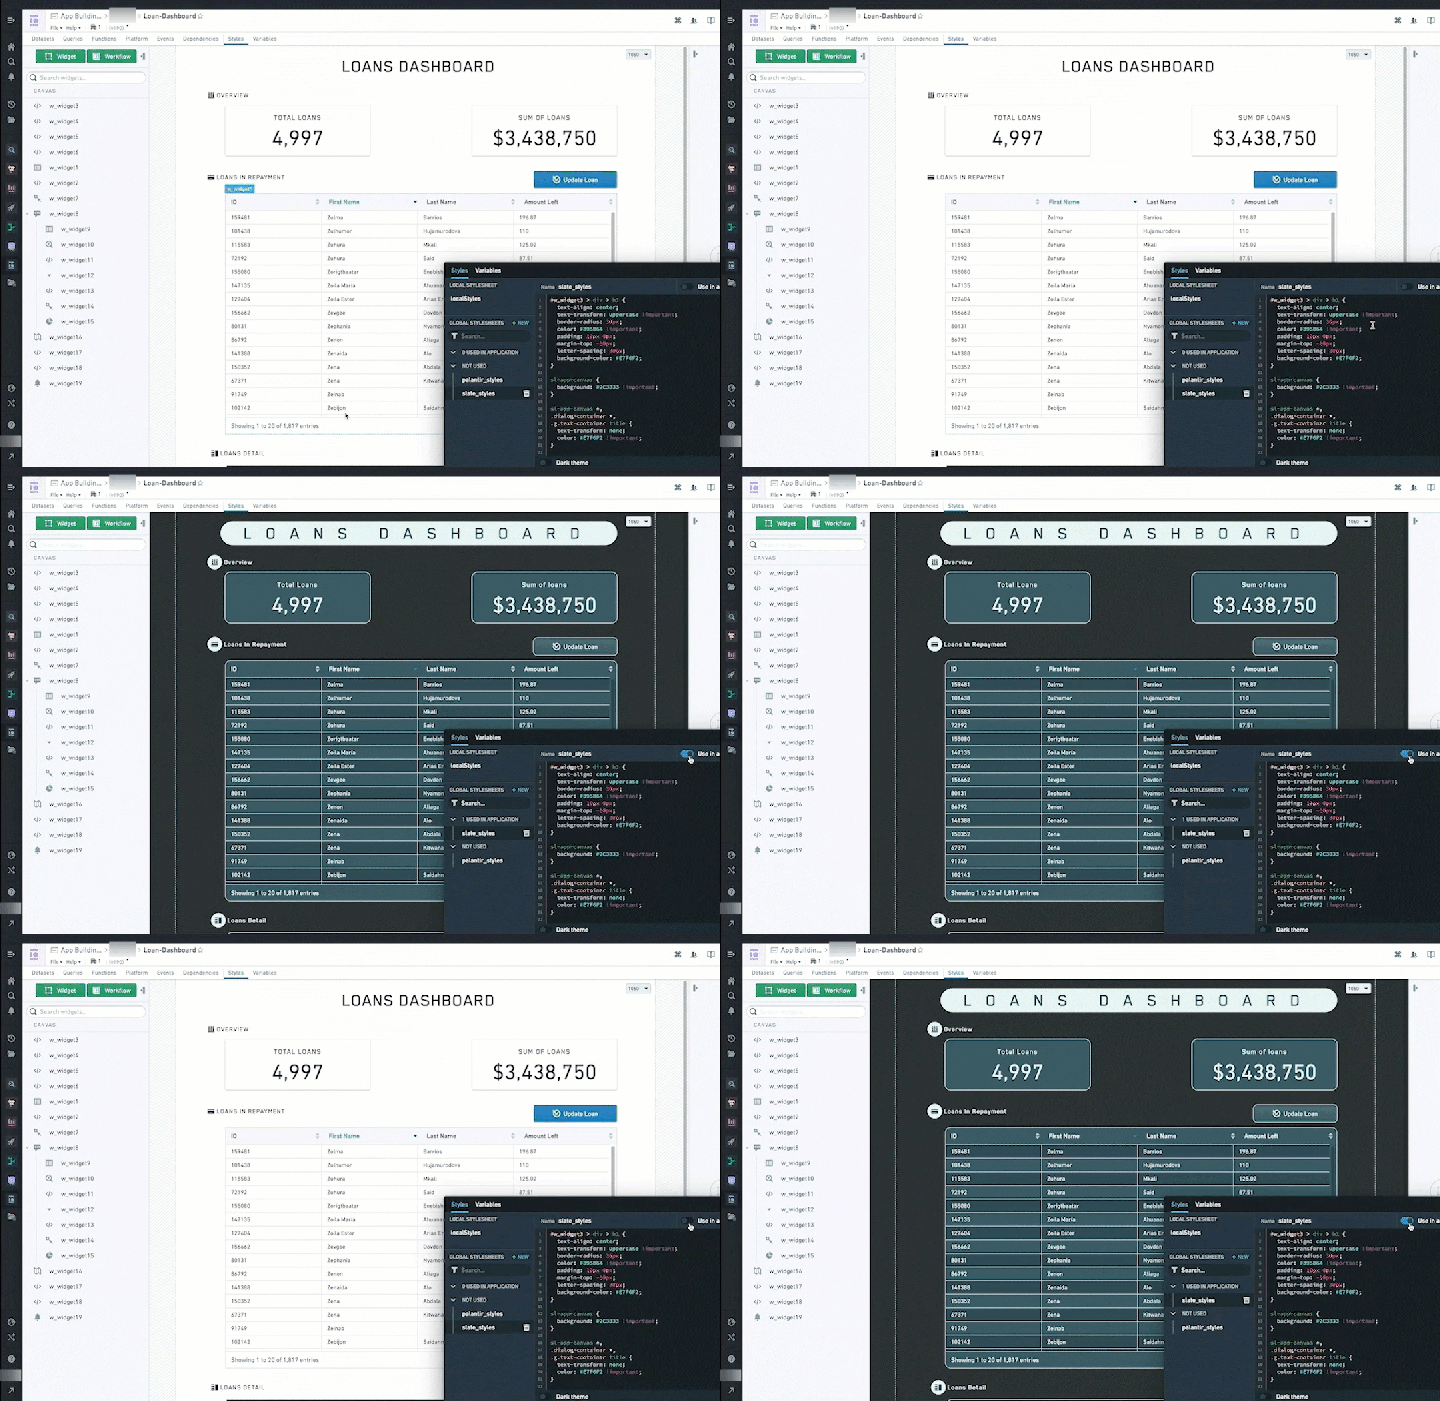
As stakeholders often use more than one Slate application in a workflow to dive into data, builders can now use global stylesheets to craft a consistent style across all applications to ensure a uniform look and feel. Build a global stylesheet whenever you need to introduce application consistency and accessibility across your user base.
- Multiple builders can access design libraries custom-designed for the same organization.
- Select a global stylesheet, and toggle on "Use in application" to have any application in the same namespace adapt the same underlying design guidelines.
- Build app design as part of a one-stop-shop process in a product-supported way.
- Embed accessible UI elements just once, with ease.
Build a global stylesheet for each desired type of view to have mix-and-match applicability
For example, this might mean one global stylesheet for maps, another for inbox views, and one more for charts or graphs. Where two or more of the same components are used, multiple stylesheets can be toggled on for combination use. For example, if you have a Slate dashboard, you might apply the "dashboard" styling. If you have an application better viewed in dark mode, you can select a "dark mode" styling if the application builder has finished it. Similarly, apps for one organization can have the same branding and feel adapted.
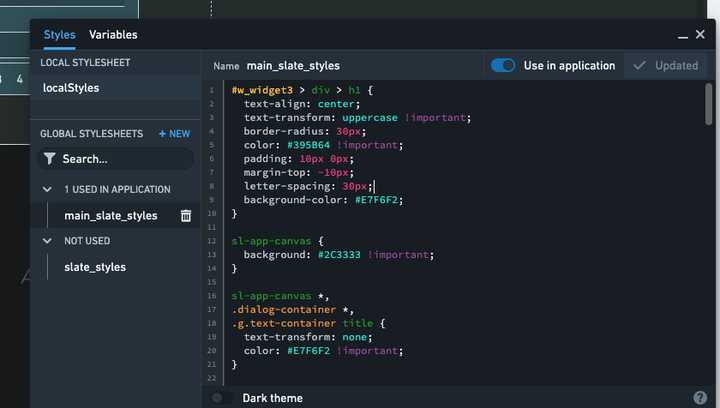
To pick between designing a local or global stylesheet, consider your style needs
If you are creating for a workflow that uses multiple applications end-to-end, you may want to build out global stylesheets that allow other application builders across the workflow chain to apply them, saving time and effort. For a stable production app that should match enterprise level branding, create a global stylesheet to ensure that everyone — from builders to end-users — can benefit from consistent styling that strengthens familiarity and accessibility in your Slate application.
If you have a custom style only available in one local application which must remain unique in appearance, build a local stylesheet instead. We'd also recommend sticking with local stylesheets if you're continuously iterating on the look and feel of an application. You can also make that into a global stylesheet when finalized and approved for use across different applications.
For any shape or size of application, style sheets are key to delivering a quality user experience. Get started by reading the Slate stylesheets documentation.
Additional highlights
Analytics: Contour
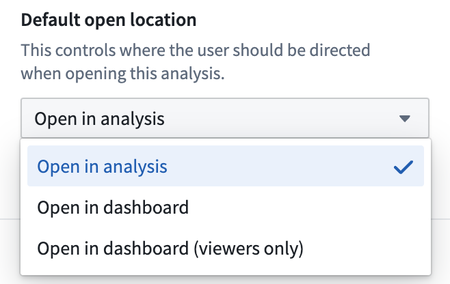
Allow setting default analysis view | Introduced a new setting to change the default view when opening an analysis. Users can now configure an analysis to open in the dashboard by default or open in the dashboard only if the viewer lacks edit permissions. To change this setting, navigate to the settings sidebar and select an option from the Default open location dropdown menu.
Copy and paste boards in a Contour analysis | Boards can now be copied, cut, and pasted within a single Contour analysis. To copy a board use the ... dropdown menu on any board and select either Copy or Cut. Boards can then be pasted anywhere in the same analysis by using the new Paste board option located in between boards in a path.
