6 - Graph Visualization
This content is also available at learn.palantir.com ↗ and is presented here for accessibility purposes.
📖 Task Introduction
Data Lineage allows you to rearrange nodes manually by clicking and dragging them or by using one of the automatic layout functions. We’ll use these functions to generate a clearer view of the flight_alerts_clean pipeline.
🔨 Task Instructions
-
First, to free up space on the screen, feel free to close the Preview by clicking the double down "chevron" arrows to the right of the Code tab. Then, you can use your mouse scroll wheel or the + / - icons near the bottom-left corner of the graph to zoom out and see all the nodes on the graph. To automatically arrange the nodes in a more convenient layout, click on the Select icon in the upper toolbar menu.
-
In the Select dropdown menu, click Select all.
-
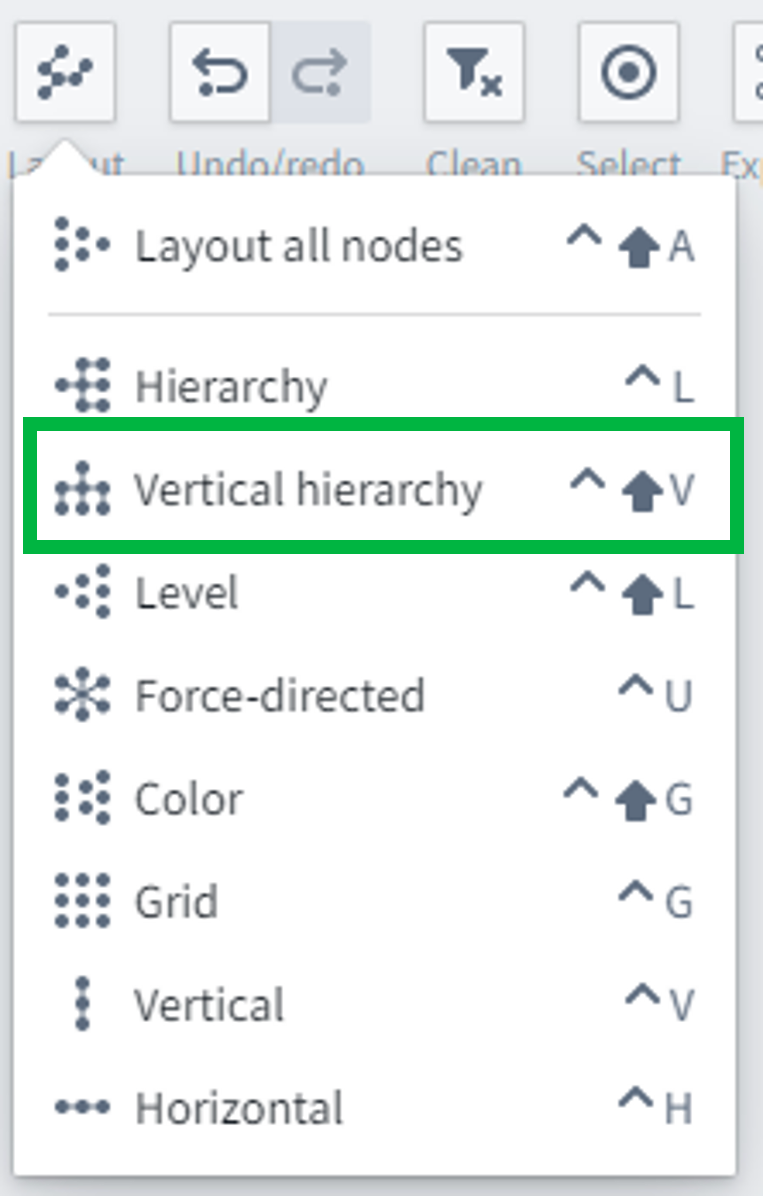
Click the Layout icon in the upper toolbar menu. In the dropdown menu, click Vertical hierarchy.