6 - Build vs. Job Checks
This content is also available at learn.palantir.com ↗ and is presented here for accessibility purposes.
📖 Task Introduction
As of this writing, the Foundry documentation recommends adding two other checks on the inputs and outputs of your pipelines: build status and build duration. While there may still be good reasons for applying these checks on the inputs and outputs of your schedule, the best practice now is to apply schedule duration and schedule status checks, which we will address in the next exercise.
Understanding the difference between a job and a build—as well as how build status and duration checks are redundant with schedule ones—will help you decide whether these checks are needed at any stage of your pipeline.
- Job: a data computation defined by the logic in a single transform. In other words, a job is a single transform that produces a single dataset (or several if a multi-output transform is used).
- Build: a collection of jobs with defined target datasets as defined in the schedule.
The list of available health checks from the previous task also included a Job status check, which succeeds if the dataset on which it is applied successfully builds, even if the build is a part of fails downstream. Job status checks are therefore limited to individual datasets.
A Build status check, by contrast, will monitor the success or failure of all jobs in the build. By applying this check on the output(s) of a schedule, you monitor all jobs in the larger build. One useful application in Foundry for exploring jobs and builds is the Job Tracker. The steps below provide a high-level overview of the information available to you in the Job Tracker once a build has started or finished running.
🔨 Task Instructions
- Go back to your Flight Alerts Pipeline graph, click on the
flight_alerts_cleannode on your graph and then on the History tab across the bottom left of your screen. - A record of all transactions that generated this dataset appears on the left side of the History helper. Click the most recent successful transaction.
- In the Overview tab of the transaction details panel, ctrl+click the View build report link on the right side next to the Job details section header.
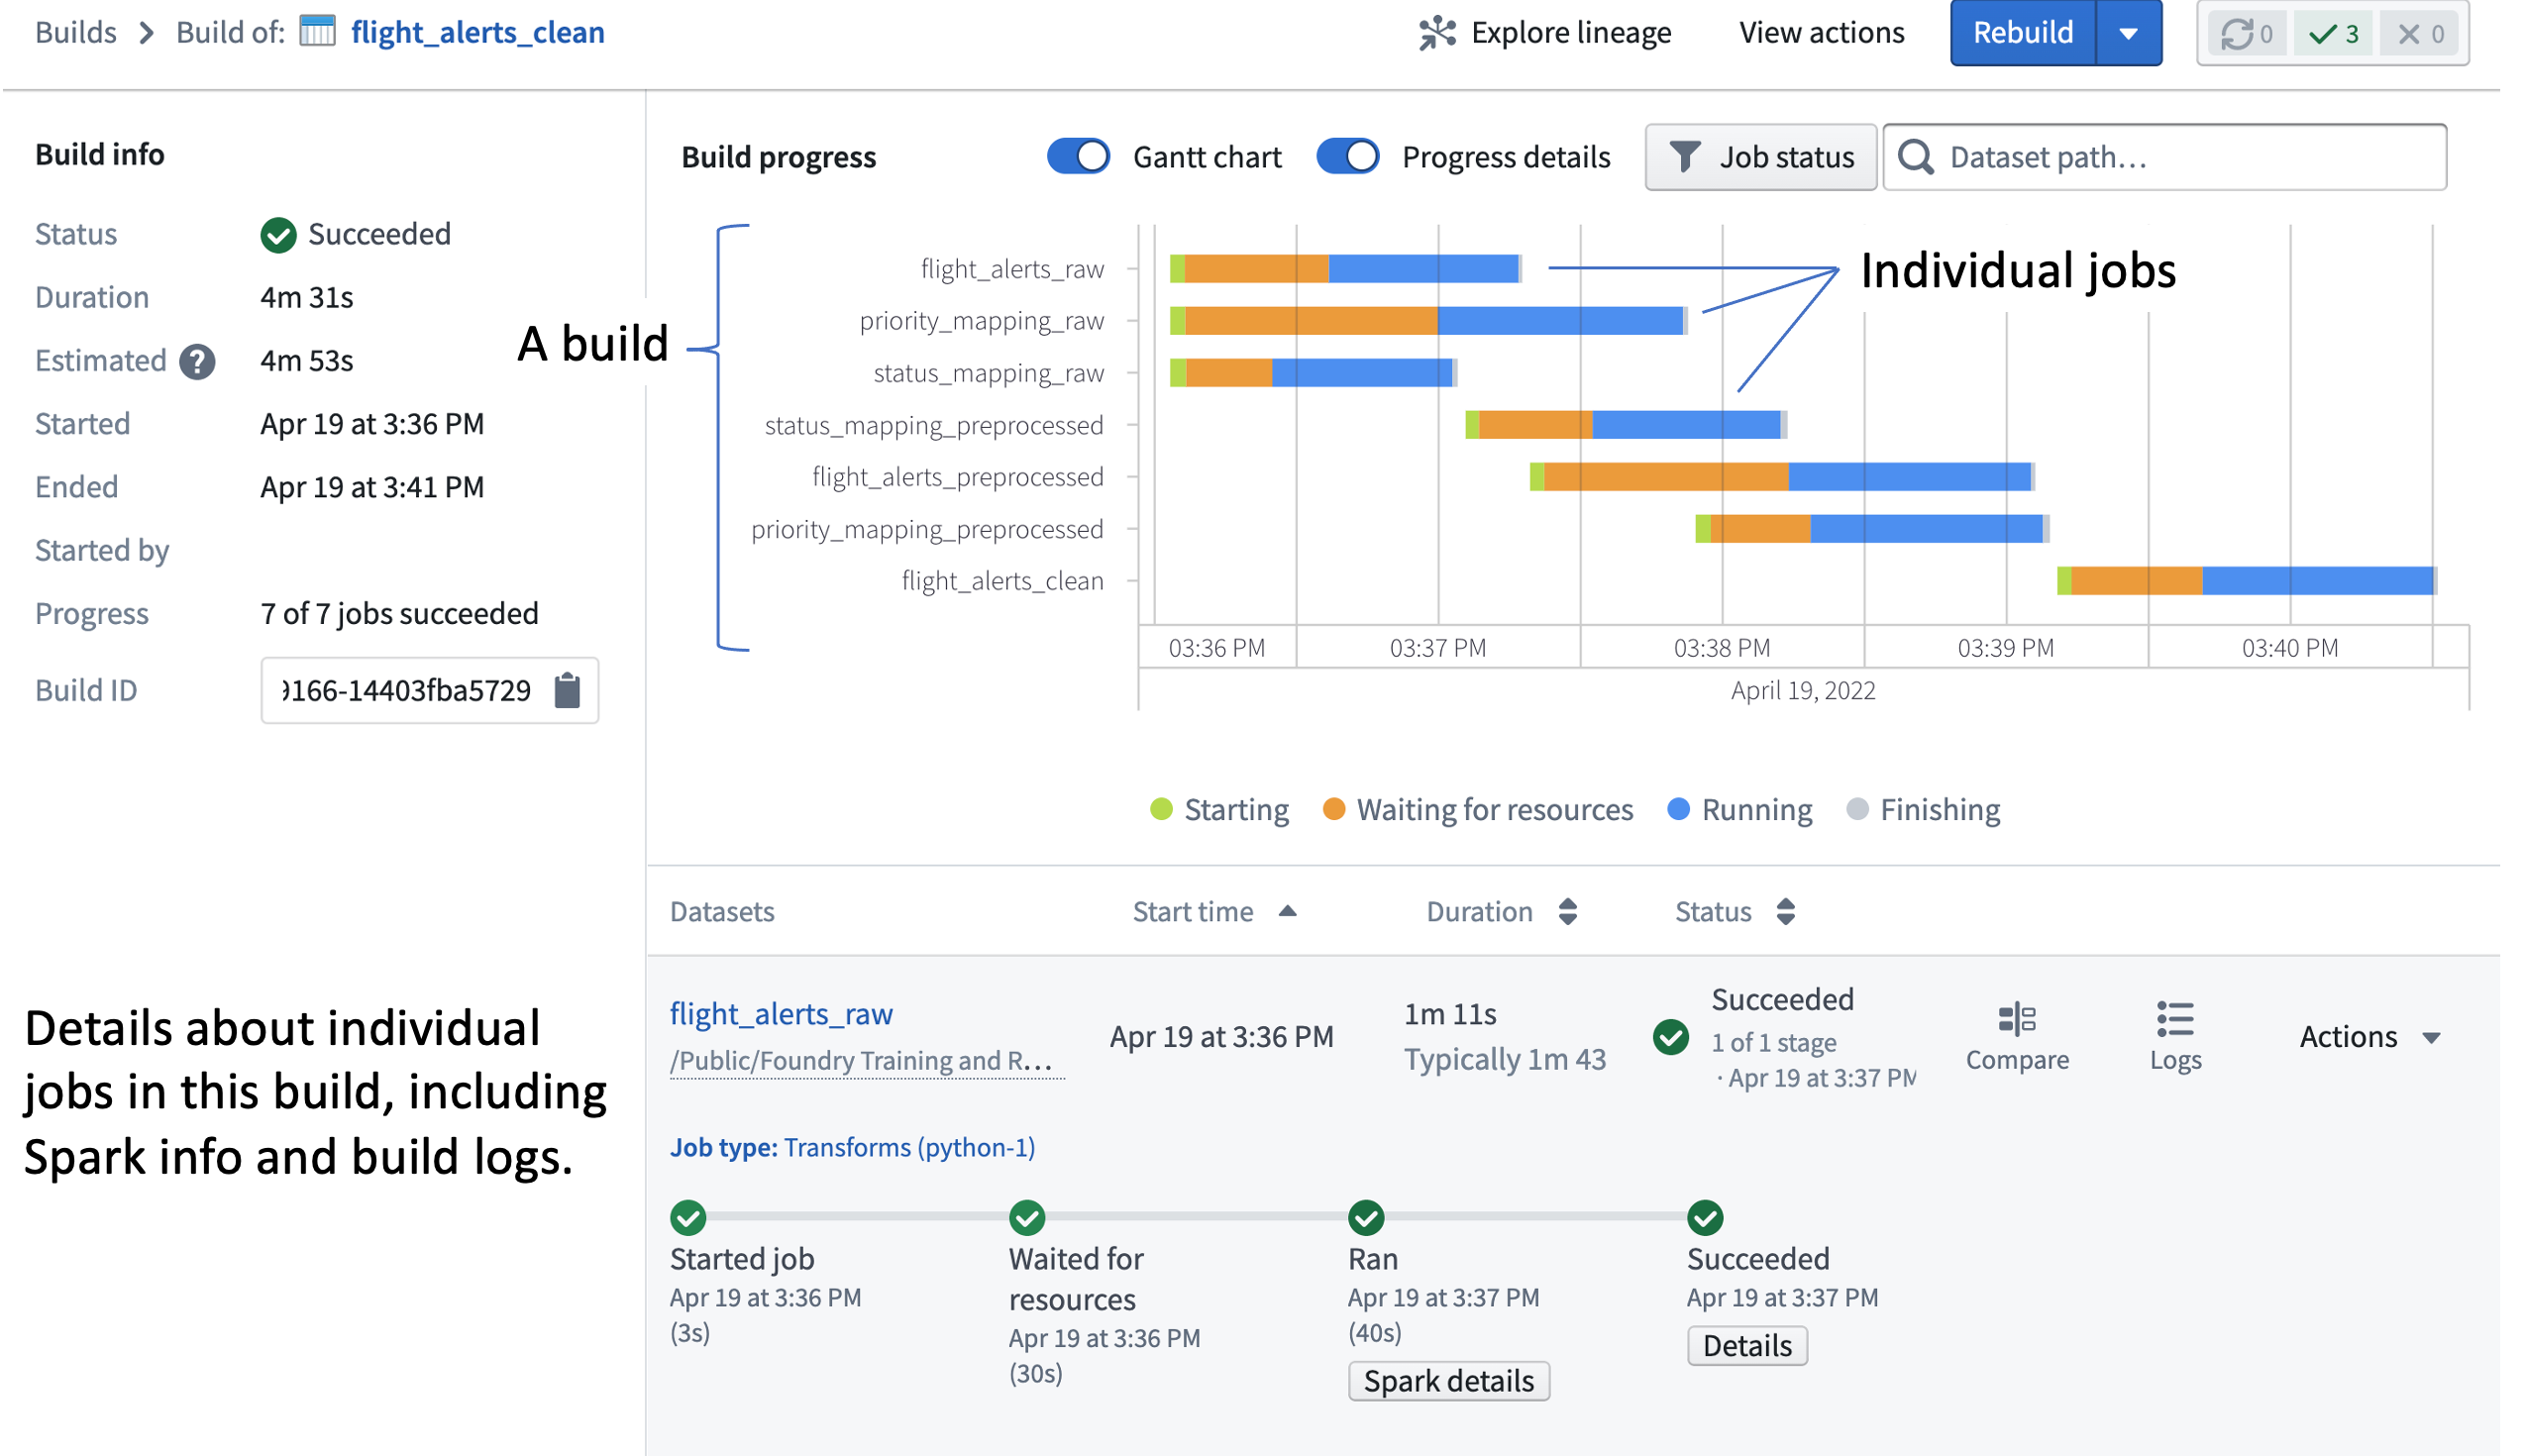
You are now in the Job Tracker application in a new tab in your browser, and your screen might look something like the image below.
📚 Recommended Reading (~2 min read)
Read more about the distinction between Job-Level Checks vs Build-Level Checks in the documentation linked here.